Addicted to Janet, Plus What Could Go Right
Many years ago, renowned money manager and newsletter writer Marty Zweig coined the phrase, “Don’t Fight the Fed!” Zweig’s research found that over history, stocks mostly behaved positively when monetary conditions were favorable (lower rates) but typically encountered trouble when policies were unfavorable (rising rates).
Lower interest rates do not always help the stock market, but in recent years, with the Federal Reserve keeping rates near zero for over 7 years, the correlation between Fed policy and the stock market has become uncannily high.
This is amply illustrated in the chart below, courtesy of Ned Davis Research. What they found was that since mid-1997, there have been 149 Fed meetings.
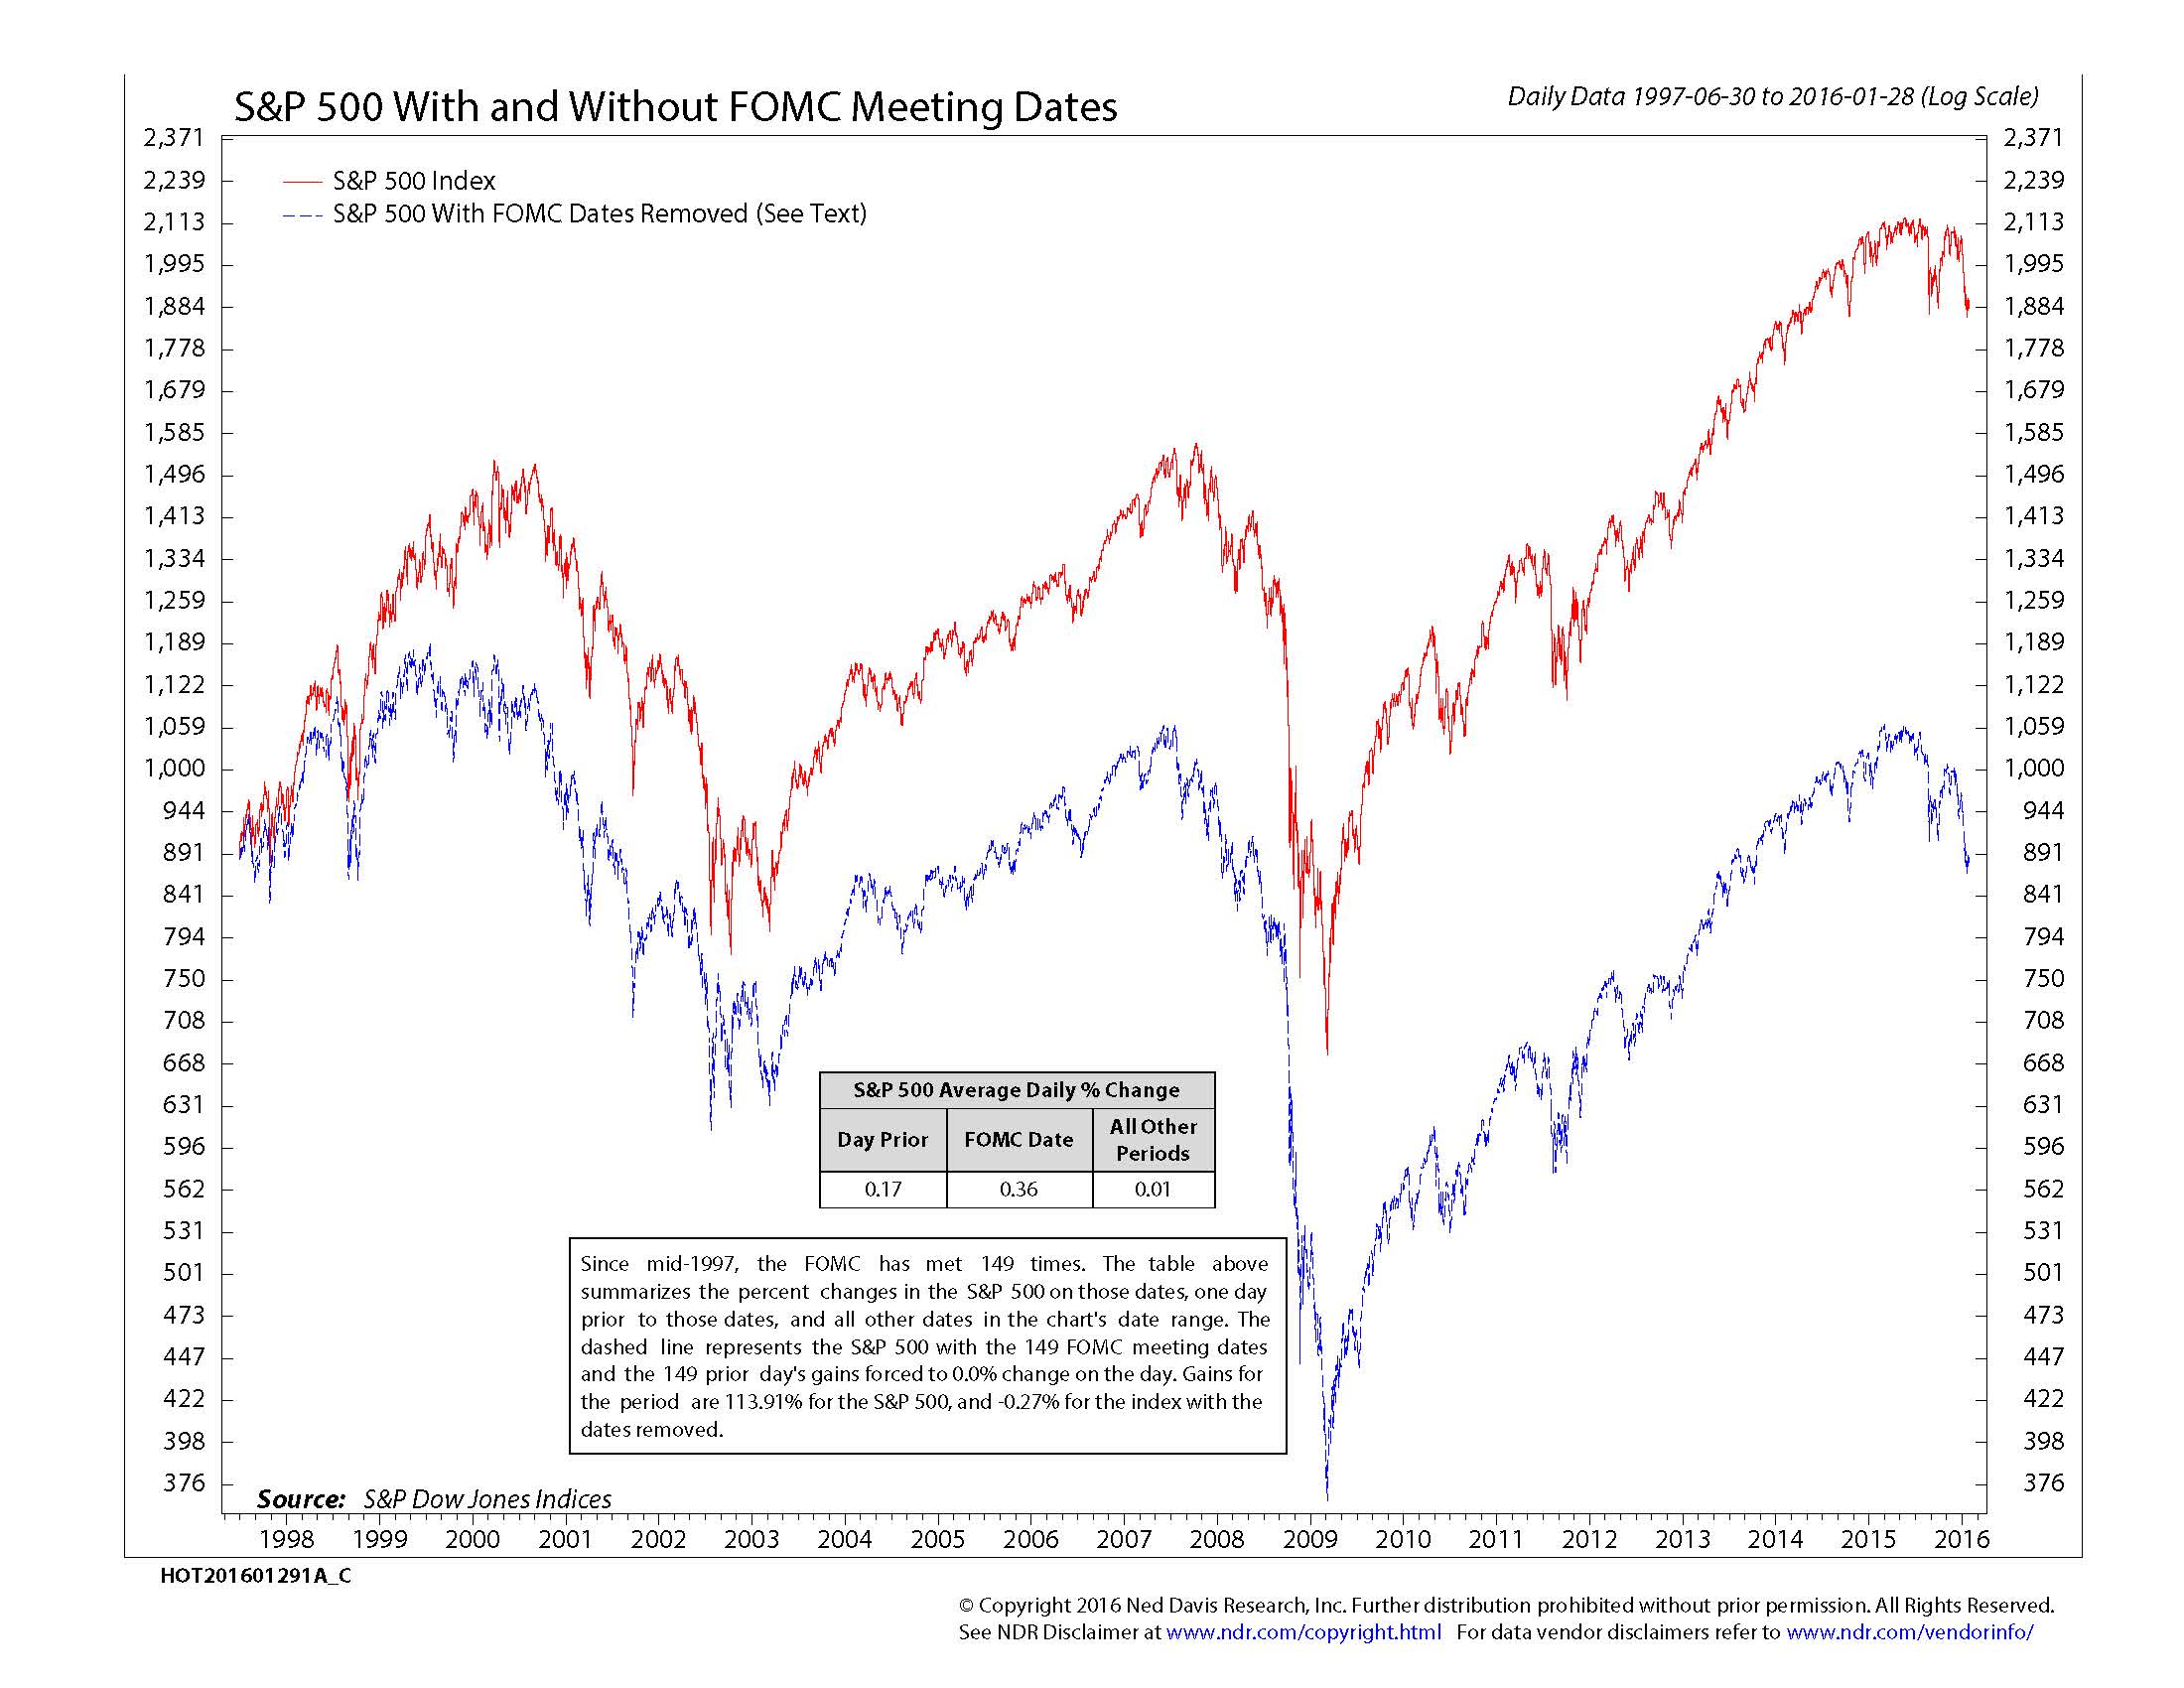
They took the performance of the S&P 500 Index on the day before each meeting, along with the day of each meeting, and found that the index has gained over 112% on these 298 trading days (red line) yet has lost -0.82% without those days (blue line). That’s pretty powerful, and why I used the headline, in referencing Federal Reserve chairwoman Janet Yellen. When the Fed raised rates in mid-December, the first sign of tightening policy, stocks promptly fell over 10% in about 8 weeks. Then, when the Fed reassures everyone that they will be extremely slow in raising rates, stocks recover.
It is a process that has made stocks very dependent on Fed policy, which is likely not a good thing in the long run, but it is the reality of the day, so one must deal with it in evaluating risk and reward.
Positive Breadth
The rally in the stock market off the February 11 low has been stronger than many analysts expected, and that certainly includes us. In our last monthly update February 29, the S&P 500 had gained about 7%, and since then, it has tacked on another 6%, recouping all of its losses and currently slightly above water for the year.
There are certain ways to measure technical strength in the stock market, called breadth, from the number of stocks making new highs, to the number of stocks advancing, as examples. One way is to measure the percentage of stocks above their 50-day moving average, which is shown below in a study by Ned Davis Research.
This is a form of what technician’s call a Breadth Thrust Buy signal.
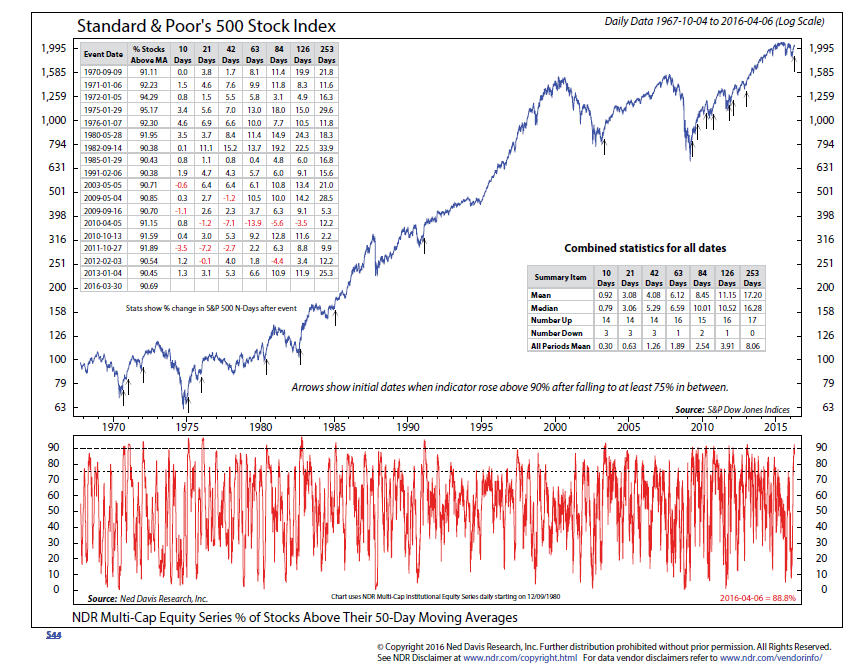
There are several versions of thrust signals. It may be difficult to view the small print of the numbers, but the arrows on the chart show when the indicator rose above 90%, after falling to at least 75% in between. Since 1970, there have been 17 prior cases, the S&P 500 Index has been higher one year later each time, with the smallest gain 2.2% and the median gain 16.28%. There has been only one instance where 63 days later (the equivalent of three months) stocks were negative, though in that case it was a whopping -13.9% decline in 2010.
So, this evidence is in the camp of what can go right. When breadth is this strong, it usually takes time for the momentum to wear off. It is clear that the Fed wants to do anything that will raise inflation and asset prices. At present, most of the breadth indicators for the stock market are more bullish than bearish, but nothing is guaranteed.
Where’s My 4%??
In retirement planning, there is a popular strategy backed up by some long term research from several practitioners that over the 20 to 30 year span of one’s retirement, history has suggested that if you withdraw 4% of your capital on an annual basis, and adjust it for inflation, your money would typically outlive you, and you’d be fine.
As an added bonus, most investors would love to see their principal stay intact while doing this. And no doubt, we’re all human, and emotions and psychology are different for many when they’re retired versus when we are working. Wouldn’t it be ideal to get 4% every year from one’s investments, and not have to worry about your principal?
Unfortunately, that’s not very realistic on a year-by-year basis in today’s environment, where historically low interest rates have been coupled with fluctuating stock valuations and significant downside risk. When one looks at the picture over five or 10 years, it is a much more realistic goal. In this update, I won’t get into the differences between income/cash flow and total return, but I thought it would be instructive to show just how challenging markets have been during the past year, which you will see in the table below.
The ETFs (exchange traded funds) are ranked in order of best performance to worst, and include dividends where applicable, for the time period March 31, 2015 to March 31, 2016. They represent broad areas of the stock market, the bond market, real estate, gold and oil.
GLD SPDR Gold Shares 3.8%
IYR Dow Jones Real Estate Index 2.46
BND Vanguard Total Bond Index 1.8
SPY SPDR S&P 500 Index 1.7
VTI Vanguard Total Stock Index -0.50%
IJH S&P Mid Cap Index -3.7
HYG High Yield Corporate Bond -5.0
EFA European Stock Index -8.3
IWM Russell 2000 Small Stocks -9.7
EEM Emerging Markets Index -12.5
WTI Crude Oil -19.75%
This, by the way, is including the majority of the rebound that stocks and other areas have enjoyed since February 11. Had I taken the data back to November 2014 and ended it in February 2016, a span of nearly 15 months, the results would have looked even worse. Despite the above, diversification isn’t dead. It is just a reminder that investing is not a one-way street with constant, steady progress. A thorough understanding of that, coupled with the discipline to stick with one’s process, especially in difficult times, is essential to long-term success.
Where We Stand
The biggest question at present is whether or not the advance from mid-February is a bear market rally, which will soon fail and lead to significantly lower price lows, or if the worst is behind us, and stocks are moving to greater and greater heights. We have research opinions from both sides, but I don’t have any strong convictions, and simply don’t know.
I can tell you that a few of our stock market tactical risk models have turned positive since the last writing, and our tactical equity exposure is now about 40%, coupled with a 5% position in real estate. In TABR’s Dividend Stock strategy, exposure has been increased to 80% from the 50% floor. In addition, on the fixed income side, we are about half invested in high yield bond funds with a BUY in place from late February. Since they can be highly correlated at times, I will say that as long as high yield bond trends remain positive, that tends to be good for stocks. Seasonal trends for stocks will shift to negative beginning in late April, so we’ll have to see if the positive breadth I noted above can overcome that headwind. All in all, the overall evidence is mixed, and that reflects our stance, which can move in either direction.
Material of a Less Serious Nature
A young woman brings home her fiance to meet her parents. After dinner, her mother tells her father to find out about the young man. The father invites the fiance to his study for a drink.
“So, what are your plans?” the father asks the young man. “I am a Torah scholar,” he replies.
“A Torah scholar. Hmmm,” the father says. “Admirable, but what will you do to provide a nice house for my daughter to live in, as she’s accustomed to?” “I will study,” the young man replies, “and God will provide for us.”
“And how will you buy her a beautiful engagement ring, such as she deserves?” asks the father. “I will concentrate on my studies,” the young man replies, “God will provide for us.”
“And children?” asks the father. “How will you support children?” “Don’t worry, sir, God will provide,” replies the fiance.
The conversation proceeds like this, and each time the father questions, the young idealist insists that God will provide.
Later, the mother asks, “How did it go, Honey?” The father answers, “He has no job and no plans, but the good news is he thinks I’m God.”
Sincerely,

Bob Kargenian, CMT
President
TABR Capital Management, LLC (“TABR”) is an SEC registered investment advisor with its principal place of business in the state of California. TABR and its representatives are in compliance with the current notice filing and registration requirements imposed upon registered investment advisors by those states in which TABR maintains clients. TABR may only transact business in those states in which it is notice filed, or qualifies for an exemption or exclusion from notice filing requirements.
This newsletter is limited to the dissemination of general information pertaining to our investment advisory/management services. Any subsequent, direct communication by TABR with a prospective client shall be conducted by a representative that is either registered or qualifies for an exemption or exclusion from registration in the state where the prospective client resides. For information pertaining to the registration status of TABR, please contact TABR or refer to the Investment Advisor Disclosure web site (www.adviserinfo.sec.gov).
The TABR Model Portfolios are allocated in a range of investments according to TABR’s proprietary investment strategies. TABR’s proprietary investment strategies are allocated amongst individual stocks, bonds, mutual funds, ETFs and other instruments with a view towards income and/or capital appreciation depending on the specific allocation employed by each Model Portfolio. TABR tracks the performance of each Model Portfolio in an actual account that is charged TABR’s investment management fees in the exact manner as would an actual client account. Therefore the performance shown is net of TABR’s investment management fees, and also reflect the deduction of transaction and custodial charges, if any.
Comparison of the TABR Model Portfolios to the Vanguard Total Stock Index Fund, the Vanguard Total International Stock Fund and the Vanguard Total Bond Index Fund is for illustrative purposes only and the volatility of the indices used for comparison may be materially different from the volatility of the TABR Model Portfolios due to varying degrees of diversification and/or other factors.
Past performance of the TABR Model Portfolios may not be indicative of future results and the performance of a specific individual client account may vary substantially from the composite results above in part because client accounts may be allocated among several portfolios. Different types of investments involve varying degrees of risk, and there can be no assurance that any specific investment will be profitable.
The TABR Dividend Strategy presented herein represents back-tested performance results. TABR did not offer the Dividend Strategy as an investment strategy for actual client accounts until September/October 2014. Back-tested performance results are provided solely for informational purposes and are not to be considered investment advice. These figures are hypothetical, prepared with the benefit of hindsight, and have inherent limitations as to their use and relevance. For example, they ignore certain factors such as trade timing, security liquidity, and the fact that economic and market conditions in the future may differ significantly from those in the past. Back-tested performance results reflect prices that are fully adjusted for dividends and other such distributions. The strategy may involve above average portfolio turnover which could negatively impact upon the net after-tax gain experienced by an individual client. Past performance is no indication or guarantee of future results and there can be no assurance the strategy will achieve results similar to those depicted herein.
For additional information about TABR, including fees and services, send for our disclosure statement as set forth on Form ADV from us using the contact information herein. Please read the disclosure statement carefully before you invest or send money.
A list of all recommendations made by TABR within the immediately preceding one year is available upon request at no charge. The sample client experiences described herein are included for illustrative purposes and there can be no assurance that TABR will be able to achieve similar results in comparable situations. No portion of this writing is to be interpreted as a testimonial or endorsement of TABR’s investment advisory services and it is not known whether the clients referenced approve of TABR or its services.