The Bullet Proof Fabulous Five, And Where’s The “High” In High Yield
I’m sure somewhere there must be an emoji to convey sarcasm. If you know of one, make sure to put it at the end of the first part of this month’s headline, because the intent of the message is absolutely to ridicule such a thought.
What thought am I referring to? The notion that 5 of the biggest stocks, which have been leading the market for the last couple of years, are somehow immune from the forces of nature. The relevance of this to the overall stock market is such that the stock market tends to turn down, sometimes in a significant way, when the market’s leading stocks and sectors start to retreat.
Today, those five stocks are Facebook, Amazon, Apple, Netflix and Google (now known as Alphabet). The industry has dubbed these companies the FAANG stocks, but I’m going with the Fab Five. That was the moniker given to the 1991 University of Michigan men’s basketball recruiting class, that is considered perhaps “the greatest class ever recruited.” Hey, I have to work sports in here somewhere.
A bit of stock market history. In the late 1960s and early 1970s, we had the Nifty-Fifty, and one-decision growth stocks such as Polaroid and Xerox. The notion was that all you had to do was buy these large growth companies and sit back and make money forever. Mind you, not all of them were bad. Many are still around today, including Proctor & Gamble, McDonalds, Coca-Cola, IBM and a host of others.
The cycle repeats itself, though, just with different names, and the end results are not pretty. The trend can and usually does go on for a couple of years, until it doesn’t. This narrow leadership led to the 1973-74 bear market, when large stocks declined -40% to -45%. It was repeated in 1999 and 2000 with the Internet stocks, including really good companies like Microsoft and Cisco Systems, and many not so good ones such as Juniper Networks and InfoSpace (its stock went from $1300 to $2).
So, what do we make of today’s Fab Five? I grew up in the 1960s, my brother and I fond devotees of the black and white version of Superman on TV. You might remember that Superman was pretty much bullet proof, except for one thing. Kryptonite. That was the radioactive material from the fictional Superman universe that could pretty much kill him.
Ultimately, expectations, valuations and psychology are going to kill these stocks, just as they will the overall market, some more than others. We thought we’d take a look at the technicals of each stock, as we believe that price action tells all. Because of space, we’re not going to show charts of all five, but we’ll also include some fundamental data derived from both Value Line and Morningstar, and then see if the overall combination of this information points in any particular direction. Then, we’ll revisit this in 3 years and can compare today to what actually happens.
| Stock | YTD Change | Price | VLineEstimate* | FValue* | Uptrend | Support | TechRank* |
| +46% | 168 | +10% – +21% | 155 | 122 | 150 | 4 | |
| Apple | +37% | 157 | +4% – +11% | 145 | 100 | 144 | 5 |
| Amazon | +29% | 968 | +4% – (-6%) | 1200 | 904 | 928 | 5 |
| Netflix | +38% | 171 | +6% – (-4%) | 73 | 116 | 146 | 5 |
| +18% | 914 | +7% – +13% | 910 | 872 | 916 | 4 |
*the estimates from Value Line are what is called their Median Appreciation Potential over the next three to five years, and are expressed in annualized compound numbers. Example–their best case for Amazon is 4% annual gains and worst case is 6% annual losses. The Fair Value number is taken from Morningstar reports for each stock. Finally, the Technical Rank is a system from Dorsey Wright which ranks stocks on five attributes (all of which are related to price). A 0 is the worst rank, and a 5 is the best.
Below are weekly charts for Apple and Amazon, which go back to April 2015, and are courtesy of www.stockcharts.com.

Apple made a new high this past week in a market that is currently experiencing few new highs. Lower lows would not be apparent until the stock goes below about $140.
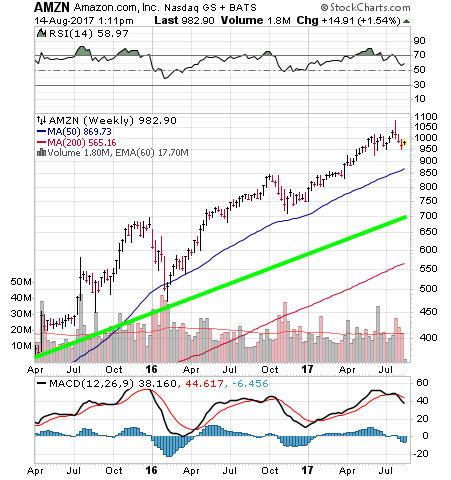
The Amazon chart is above, and though it is still in an uptrend, is giving off a hint of a different picture. Three weeks ago the stock spiked to a new high above 1075, but closed down for that week and is now 10% below its peak. That is a bit hard to tell on the chart because the stock is nearly $1000 per share, which is why percentages can be helpful. In addition, looking at Amazon on a point and figure chart gives one a very different perspective.
Altogether, the five stocks are still technically strong, above their uptrend lines and rising 50-day and 200-day averages. Fundamentally, if you believe Morningstar— Facebook, Apple and Google are all near fair value, while they have Amazon 24% below fair value and Netflix over 130% above fair value. Ironically, in this weekend’s edition of Barron’s, the cover story is on how Netflix could lose 50% of its value in coming years.
Using Value Line’s methodology, Amazon and Netflix appear to have the most downside risk, with Facebook having the most upside potential and Apple and Google having decent estimates. At present, none of the stocks have broken down, which in tandem should lead to broader problems for the overall market, though there is some short term vulnerability that we outline below. When all is said and done, a change in psychology will be the culprit.
Consumer Confidence & Psychology
Below is a chart of Consumer Confidence, as measured by the Conference Board (chart courtesy of InvestTech Research). The reading is at a 16-year high, and reflects widespread positive psychology. At the bottom in early 2009, the indicator reached an all-time low below 30, certainly reflecting the 55% drop in the stock market. With stocks having tripled from that low, the indicator is now reflecting extreme optimism. That’s not necessarily a good thing, as history shows.
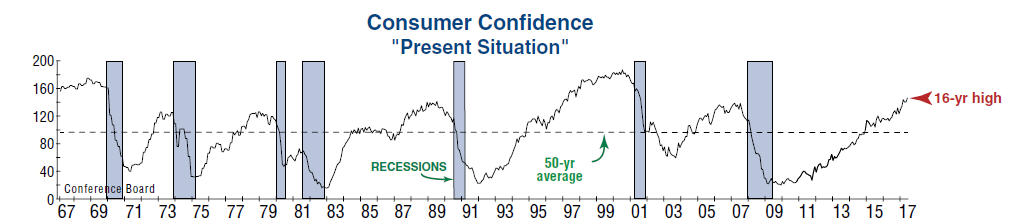
It means that high expectations have likely been baked into stock prices, and there is very little room for error or disappointment. Granted, the indicator was at a similar level in 1997 and went up for another three years (along with stock prices) before the Internet Bubble popped. That could happen again. But, there’s no guarantee it will.
Where’s The “High” In High Yield?
Our favorite part of the bond market is the high yield corporate market, also known as “junk bonds.” The market for below investment grade debt was popularized by Mike Milken and Drexel Burnham in the 1980s and today is a popular asset class. Though the stock market gets much of the attention in the financial press, bonds play a significant role in properly diversified portfolios.
At TABR, nearly half of the approximate $130 million we manage for clients is in our bond strategies, and about 65% of that money is devoted to high yield. Ever since I stumbled upon a very simple trend following formula for this area in my reading back in 1985, we’ve been using a risk management model to move in and out of this area of the bond market. Over the years, it has provided stock market like returns with bond market like risk.
In the 1980s and 1990s, high yield really meant high. Yields were in the high single digits and low teens. But that changed as interest rates on government bonds gradually declined from over 14% in 1982 to under 3% in 2016. Today, the term “high yield” might be considered an oxymoron. At present, the average yield of the 10 funds we own for clients is 5.3%. That still is attractive to many when you consider that the yield on the 10-year Treasury Note is 2.20%.
One way to gauge if this asset class is cheap or expensive relative to history is by looking at what is called the Option-Adjusted Spread (OAS). It is a complex term, so I prefer to look at simply the difference in yield between Treasuries and High Yield. Today, that is 3.1% (5.3 minus 2.2). That is pretty close to the actual Barclays U.S. High Yield OAS, as displayed on the chart below from Ned Davis Research.
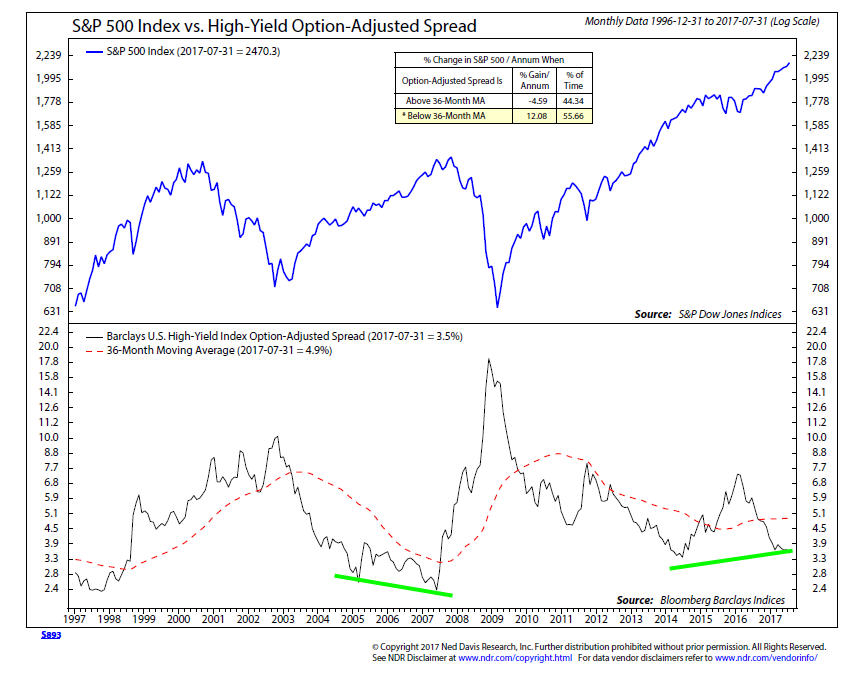
High yield bonds have a high correlation with stocks, so when prices fall, yields rise, as they did sharply in the early 2000s, 2008, and most recently, from 2014 to early 2016. The spread is quite low at present, but it was even lower from 2005 to 2007. What happened back then? I looked at the performance of the Blackrock High Yield Fund (BRHYX) for that period, and here’s what took place:
2005 +4.07%
2006 +11.75%
2007 +2.86%
2008 -27.75%
In early 2014 when the OAS reached similar levels to current readings of about 3.6%, BRHYX gained 3.31% before losing -3.96% in 2015. It then bounced back with a 14% gain last year, as prices became very attractive in February 2016 and nominal yields hit the 9-10% range. Last year, our risk model for this area gave a BUY in late February which lasted over 8 months, terminating right before the election. This year, our model has been on a BUY since January 3, now 7 months and counting.
In my view, there is not a lot of value in this area, which is supported by history. At some point, our model will turn negative, which is when we then move the majority of those assets into short term bond funds to protect capital. At that point, you’re then rooting for falling prices and higher yields, which will present better investment opportunities such as those in 2009, 2012, 2013 and 2016. To do this, though, one needs to be tactical. It can’t be accomplished by doing nothing, which leads into this month’s last topic of Buying and Holding.
Buying and Holding / Passive Indexing
I thought it would be an appropriate timely reminder to touch on this area, after reading Mark Hulbert’s column on it this week in the Wall Street Journal.
Virtually all net inflows into the stock market are going into indexes, which make no distinction between cheap or expensive. Using any kind of risk management (being less than fully invested) for the past 8 years has only hurt one’s bottom line, since there’s been little downside. We know. We’ve lived it. That will not go on forever. Cycles have not disappeared. Passive investment is always going to look great during a long-lasting bull market.
A lot of this money is sitting in retirement accounts, in the form of Target Date funds. The farther out your “retirement” date (such as 2040 or 2045 or beyond), the more the fund is invested in stocks. Right now, the Vanguard 2045 Target Date Fund is 90% in stocks. In the last 12 months ended August 11, the Vanguard S&P 500 Index Fund has gained 13.6% (with dividends). The 2045 Vanguard Target Date Fund has gained 12.39% over the same period, which is 91% of the index.
Just know, that this works in both directions. When the stock market declines 40%, a 90% allocation to stocks, whether it be via a Target Fund or through one’s own custom allocation, is going to lose between 35% and 45%. If you have any portfolios that are invested this aggressively and you can’t handle those kind of losses without bailing out near the bottom and then buying back 30% higher when “things look better,” I’d highly recommend you do some serious soul-searching about your allocations. Why?
Because history is mostly the study of unprecedented events. In the last 12 months, the Cubs won their first World Series in 108 years after being down 3 games to 1, and did it on the road. That virtually never happens. In February, the New England Patriots were down by 25 points in the 3rd quarter of the Super Bowl and won the game. That’s never happened.
From 2000 to 2009, stocks dropped by 50% or more twice. Who’s to say stocks can’t drop by 50% or more three times in 18 or 19 years? To my knowledge, based on data since 1926, that’s never happened. Well, life is full of “that’s never happened before,” and investing in the stock market is no more immune to unprecedented behavior than anything else. Did you know that 10 years ago, in May 2007, the iPhone didn’t even exist?
Right now, stocks have gone almost 8 months without even a 3% decline in the S&P 500. One day, this period of low volatility will end. Risk-on will change to risk-off, optimism will change to pessimism and liquidity will go away. When this occurs and how quickly is unknown, but just know that history shows that markets typically go down much faster than they rise. Who knows, we might see “fire and fury” on the downside that we’ve never seen before.
That shouldn’t be feared, by the way. It is what presents opportunity. And this is not a message to bash buy and hold. Rather, it is a reminder to remember that the exposure to risk is treated much better in some periods than others. At some point in the future, we expect to incorporate a buy/hold position as part of our tactical equity allocation, but it will be when prices are a lot less expensive than at present.
As you will see below, our overall work is still pretty positive, but cracks are being found on the foundation. In baseball terms, my educated guess is we are in the 8th inning. But, as always, we rely on the evidence of our various risk models.
Today’s Evidence And Current Investment Allocations
At present, 7 of our 8 stock market risk models are in positive mode, so tactical equity allocations are around 85% and as conveyed above, our high yield bond risk model remains on its January 3 BUY signal. There is deterioration on the surface, though. Both small cap and mid-cap indexes are in danger of falling below their respective 200-day moving averages. They are leading the way on the downside, which is typical late cycle behavior.
High yield bonds took a hit last week along with stocks, and another similar week will likely turn our risk model negative. That would increase risk in stocks. We’ll just have to wait and see. The configuration of a number of indicators suggest downside risk of between -7% and -10%, and a number of our stock market models would not likely turn negative in that scenario. That’s pretty normal stuff—but humans forget that when it hasn’t happened in awhile.
Material Of A Less Serious Nature
A sweet old lady telephoned St. Joseph’s Hospital . She timidly asked, “Is it possible to speak to someone who can tell me how a patient is doing?”
The operator said, “I’ll be glad to help, dear. What’s the name and room number?”
The woman in her weak, tremulous voice said, “Noreen. Room 302.”
The operator replied, “Let me place you on hold while I check with her nurse.” After a few minutes, the operator returned to the phone and said, “Oh, I have good news. Her nurse just told me that Noreen is doing very well. Her blood pressure is fine; her blood work just came back as normal, and her physician, Dr. Cohen, has scheduled her to be discharged on Tuesday.”
The older woman said, “Thank you. I was so worried. God bless you for the good news.”
The operator replied, “You’re more than welcome. Is Noreen your daughter?”
The woman said, “No. I’m Noreen in 302. No one tells me sh*t.”
We hope you are having a great summer. School is already beginning in parts of the nation, and will be in full force in just 3 to 4 weeks. May the stock market ECLIPSE all your dreams (ok, ok, what about the nightmares?). All of us at TABR greatly appreciate the trust and confidence you place in us.
Sincerely,

Bob Kargenian, CMT
President
TABR Capital Management, LLC (“TABR”) is an SEC registered investment advisor with its principal place of business in the state of California. TABR and its representatives are in compliance with the current notice filing and registration requirements imposed upon registered investment advisors by those states in which TABR maintains clients. TABR may only transact business in those states in which it is notice filed, or qualifies for an exemption or exclusion from notice filing requirements.
This newsletter is limited to the dissemination of general information pertaining to our investment advisory/management services. Any subsequent, direct communication by TABR with a prospective client shall be conducted by a representative that is either registered or qualifies for an exemption or exclusion from registration in the state where the prospective client resides. For information pertaining to the registration status of TABR, please contact TABR or refer to the Investment Advisor Disclosure web site (www.adviserinfo.sec.gov).
The TABR Model Portfolios are allocated in a range of investments according to TABR’s proprietary investment strategies. TABR’s proprietary investment strategies are allocated amongst individual stocks, bonds, mutual funds, ETFs and other instruments with a view towards income and/or capital appreciation depending on the specific allocation employed by each Model Portfolio. TABR tracks the performance of each Model Portfolio in an actual account that is charged TABR’s investment management fees in the exact manner as would an actual client account. Therefore the performance shown is net of TABR’s investment management fees, and also reflect the deduction of transaction and custodial charges, if any.
Comparison of the TABR Model Portfolios to the Vanguard Total Stock Index Fund, the Vanguard Total International Stock Fund and the Vanguard Total Bond Index Fund is for illustrative purposes only and the volatility of the indices used for comparison may be materially different from the volatility of the TABR Model Portfolios due to varying degrees of diversification and/or other factors.
Past performance of the TABR Model Portfolios may not be indicative of future results and the performance of a specific individual client account may vary substantially from the composite results above in part because client accounts may be allocated among several portfolios. Different types of investments involve varying degrees of risk, and there can be no assurance that any specific investment will be profitable.
The TABR Dividend Strategy presented herein represents back-tested performance results. TABR did not offer the Dividend Strategy as an investment strategy for actual client accounts until September/October 2014. Back-tested performance results are provided solely for informational purposes and are not to be considered investment advice. These figures are hypothetical, prepared with the benefit of hindsight, and have inherent limitations as to their use and relevance. For example, they ignore certain factors such as trade timing, security liquidity, and the fact that economic and market conditions in the future may differ significantly from those in the past. Back-tested performance results reflect prices that are fully adjusted for dividends and other such distributions. The strategy may involve above average portfolio turnover which could negatively impact upon the net after-tax gain experienced by an individual client. Past performance is no indication or guarantee of future results and there can be no assurance the strategy will achieve results similar to those depicted herein.
For additional information about TABR, including fees and services, send for our disclosure statement as set forth on Form ADV from us using the contact information herein. Please read the disclosure statement carefully before you invest or send money.
A list of all recommendations made by TABR within the immediately preceding one year is available upon request at no charge. The sample client experiences described herein are included for illustrative purposes and there can be no assurance that TABR will be able to achieve similar results in comparable situations. No portion of this writing is to be interpreted as a testimonial or endorsement of TABR’s investment advisory services and it is not known whether the clients referenced approve of TABR or its services.