Cyber Fraud, Stock Market Valuations, and Dividend Stocks
This quarter, we’d like to focus a bit on the growing incidents of cyber fraud, and some of the steps you can take to minimize problems in this area. Also featured is an updated chart on the Median Price/Earnings Ratio of the S&P 500, along with a reminder about market predictions. Finally, there’s the usual update on the progress of the various portfolios that TABR manages.
Cyber Fraud—It doesn’t just happen to other people
It seems like every few weeks, there is another story about some large corporate entity announcing that someone has hacked into their database and stolen private information about their customers.
It seemed like these episodes gained prominence in 2013 when Home Depot indicated that 53 million email addresses had been stolen. Then Target joined in, with up to 40 million shoppers having their credit card data stolen. Perhaps the worst, though, was the data breach from Anthem/Blue Cross, the health insurer, where anywhere from 8.8 million to 18.8 million non-customers may have been affected.
The severity was ratcheted up with Anthem/Blue Cross, since names, birthdates, Social Security numbers, home addresses, email addresses, employment information and income data were all stolen.
A few weeks ago, these stories became a bit more personal when one of our clients called to inform us that they had been a former customer of Anthem/Blue Cross, and not only had their personal data been stolen, but the perpetrators tried to file a fake tax return with the IRS to claim a refund.
Fortunately, the IRS was able to figure out this was a fraud, since our client had actually filed their tax return and owed money, but one can imagine the feeling of having your personal data stolen. It is a whole different level when Social Security numbers, employment data, home addresses and personal income data are involved, as opposed to just having a breach with your credit card number.
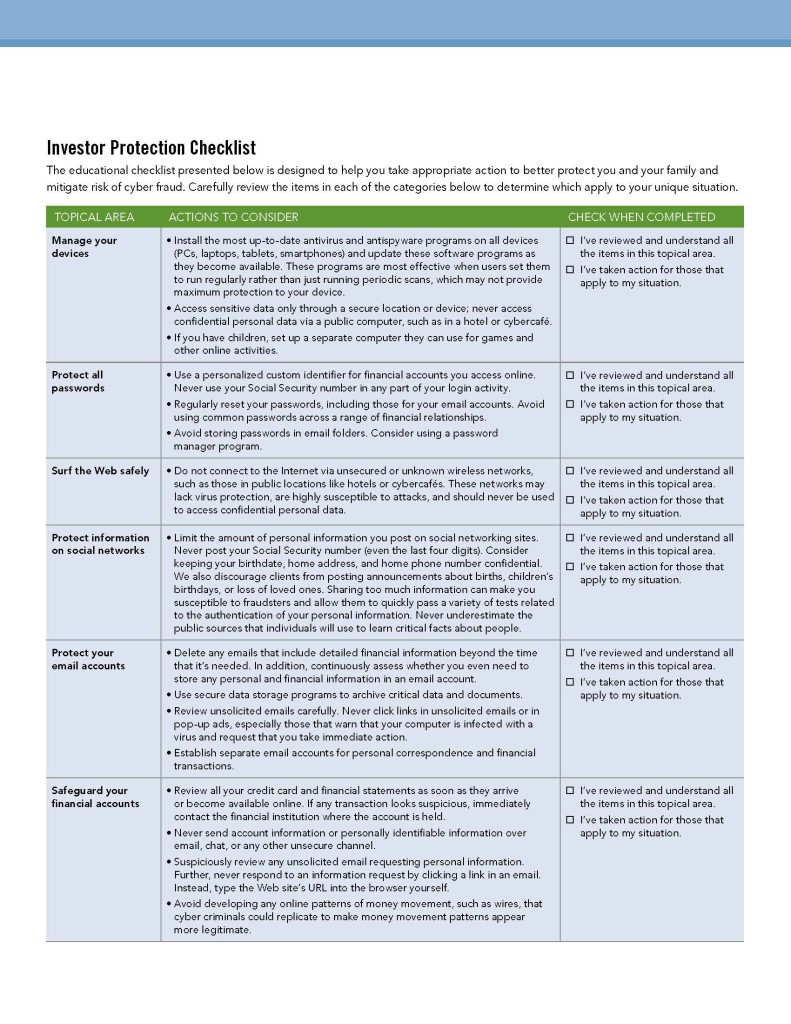
If you’re wondering about some of the steps you can take to protect you and your family, take a look at the Investor Protection Checklist reproduced on the next page. It was taken from a recent white paper published by Fidelity Investments on the subject of Cyber Fraud and what investment advisory firms can be doing to protect themselves and their clients.
 What TABR does in this area
Probably the biggest risk our clients face with us would be Electronic Funds Transfer (EFT) fraud, wire fraud and the establishment of fraudulent accounts to send money to (not with TABR, but at a bank somewhere).
In the case of wires, though we may receive email instructions from clients to wire money, we’re never sending funds via wire without talking to the client first. We certainly have a lot of EFT instructions on file to send automatic monthly income or one-time payments to clients’ bank accounts, but in order to get to that point, our clients must sign an authorization form and provide us with a voided check.
Though clients do have the ability to set up EFT instructions themselves from their bank accounts, we have discouraged them from doing so without involving us. In the instances where this has taken place and we were not notified beforehand, we received a notice from Fidelity, which then caused us to reach out to our client to ask, “hey, did you do this?”
In reality, if a criminal had the name, address, birthdate, Social Security numbers and account numbers from Fidelity of a client’s information, I suspect that they could open a fraudulent bank account. But, in order to move money out of Fidelity, an EFT would need to be established, which typically takes about 3 days. That is when we would be notified, and since we would know that we weren’t the ones doing this, our first step is to call our client.
Another obvious question for us is how do we guard your personal data? Our client database is maintained in the cloud, with one of the largest technology firms in the United States, SalesForce, who is best known for their customer relationship management product. We can only access our data via a user id and password, which we are regularly required to change. For the platform we use with Fidelity, we have to go an extra step, using a security code that is generated by a VeriSign security card or key.
As a result, I don’t keep hardly any contacts on my cell phone. If I am on the go and want to call or text a client or friend and I don’t have their number in my head, I just log in to SalesForce and get the data that way. Please know that SalesForce and Fidelity take the protection of customer data quite seriously, and we’re confident in the processes they have in place.
Is the Stock Market Over-Valued?
This question is probably being asked as much today as “when are interest rates going up?” In the last newsletter, we presented data on the Shiller P/E ratio, which certainly shows stocks as being historically expensive. Unfortunately, it is worthless as a timing indicator, as are most valuation metrics, probably including the one we are featuring below.
The chart below is courtesy of Ned Davis Research, and features the S&P 500 Median Price/Earnings Ratio with its Historical Median. Presently, the ratio is 21.8, and is one standard deviation over its 50-year median of 16.8.
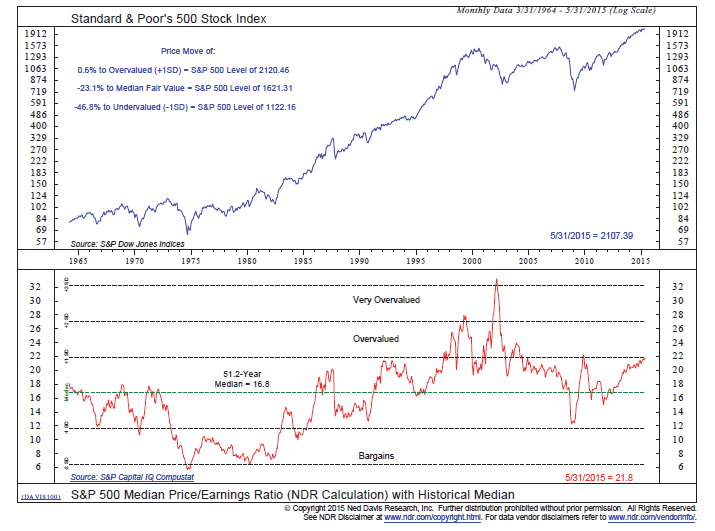
To reach what is considered fair value using this analysis, the S&P 500 would need to decline -23%. What’s to say this ratio couldn’t go to two standard deviations above the median, as it did in the late 1990s and early 2000s? The truth be told, no one knows. If you read or watch the news, you’re bound to hear market predictions, and it’s certainly easy to get caught up in these predictions.
Just last week, the financial weekly Barron’s featured an interview with Raymond James investment strategist Jeffrey Saut, who thinks we’re in a secular bull market and that the S&P 500 could hit 4300 in 9 years. Two weeks ago, partner Steve Medland attended a financial planning conference in San Francisco, and one of the featured speakers was Liz Ann Sonders, the chief strategist for Charles Schwab. She, too, is very bullish.
Contrast those positive outlooks with that of Jeremy Grantham of Grantham Mayo, known for their value investing bent. In their latest 7-year Asset Class Real Return Forecast published on their website, the outlook for U.S. stocks, large and small, is -2.1% and -2.9% respectively. The real return is also known as the inflation-adjusted return. So, if the inflation rate the next 7 years turns out to 3%, they expect large company stocks (think S&P 500) to return about 0.9% annually. Under this inflation assumption, small stocks would return 0.1% annually. By the way, Grantham is not alone.
Similar dire forecasts have been emanating from the likes of fund managers John Hussman and Rob Arnott for the past two to three years. They’ve been dead wrong, but eventually they are going to be right. And that brings me to a broader perspective—the best time to control risk is before negative conditions actually happen.
It is human nature to embrace strategies that have performed well, and to shun those that have performed less than stellar, and today, that issue is being framed as the herd instinct into passive indexing. Unfortunately, this is called chasing performance, and it rarely works. Being fully invested at all times in comparison to tactical investing is a different question than the one being written about quite a bit recently, which is that of active fund management compared to indexing/ETFs. We hope to have more on this subject next quarter, as we’re in the midst of research on this area in regards to our own fund selection process.
Indexing and being fully invested have worked great the past six years, because stocks and bonds have mostly gone up. That will change when the environment changes. In our case, we simply ignore all the forecasts and what people think, and follow the discipline of our various models. Sure, the models aren’t perfect, but they provide a framework for making automatic decisions, when others are left wondering what to do.
In our view, patience and discipline are always important, but perhaps even more so now at this stage of the market cycle. For investors of all types, including TABR’s clients, it is important to understand the limitations of each strategy type. There are pros and cons to everything, as nothing works in all environments. The more one understands about worst-case scenarios (or maximum drawdowns), the better. You’re better equipped to handle the inevitable up and down cycles of the financial markets.
TABR Dividend Stock Account & Fully Invested PBA
As time passes, we will have more and more history on these two strategies, which can complement our main tactical approach. The Dividend Stock strategy had a full quarter under its belt for many accounts, and lagged the S&P 500 in the first quarter by a decent amount (-3.89% vs 0.92%). Utilities and energy are represented quite a bit within the 27 companies in the portfolio, and the Dow Jones Utility Index dropped -5% during the quarter (including dividends), so this was a drag.
Remember, though, this is a combination income and total return play, much like owning rental real estate (without the headaches). TABR’s real-time account began the quarter at $110,546 and received $1155 in dividends in the quarter, which works out to an annualized yield of 4.18%. And, it is 4.52% on the original capital of $102,000. When we rebalanced on March 31, 15 companies were replaced. I don’t expect that each quarter. As I write this on June 11, one of the two longer term models we are using to manage risk with this strategy generated a SELL a few days ago, so all accounts except for new ones are now at 75% invested.
As you can see below, our fully invested PBA (passive but active) account led all strategies for the quarter. This was due to being fully invested, and therefore capturing all of the upside, along with alpha (outperformance) from our fund selections. This approach is similar to what clients would be experiencing with their 401 (k) plans, for those that participate in them. You allocate according to risk, rebalance once per year, and otherwise do nothing.
After the last three years especially, it may be tempting to conclude this is the end all and be all of investing. It is not, in our view, because it does not address risk management in the least. But, that does not mean it has no place in one’s approach. It’s a matter of placing it in perspective of one’s goals, knowing the limitations, and having the discipline to not waver from it during the down part of the cycles.
Below is the performance, net of management fees, of TABR’s five different portfolios at present. These represent a majority of the strategies we are using in client accounts, but not all. The differences are mainly attributed to risk (example—moderate allocation versus conservative allocation or aggressive) and account size. The numbers are for the three months ending March 31, 2015 as well as the peak-to-peak cycle from September 2007 to March 31, 2015.
| Type of Account/Strategy | YTD | Benchmark | 09/07 to 03/15^ | MaxDD |
| TABR Tactical Moderate | +0.63% | + 2.01%* | + 0.93% | -25.06% |
| TABR Tactical Conservative | +0.50 | + 1.87** | n/a | |
| TABR Tactical Bond | +0.38 | + 1.57*** | +5.82 | -19.73 |
| TABR Dividend Stock | -3.89 | + 0.92**** | n/a | |
| TABR Fully Invested PBA | +3.23 | + 2.02 | n/a | |
| Vanguard Total Stock | +1.75 | +6.80 | -55.38 | |
| Vanguard Total IntlStock | +4.06 | – 0.40 | -60.60 | |
| Vanguard Total Bond | +1.57 | +4.90 | -5.36 |
*consists of 40% Vanguard Total Stock Index, 15% Vanguard Total International Stock Index and 45% Vanguard Total Bond Index
**consists of 30% Vanguard Total Stock Index, 10% Vanguard Total International Stock Index and 60% Vanguard Total Bond Index
***Vanguard Total Bond Index
****Vanguard S&P 500 Index Fund from 12/31/14 to 3/31/15
^ denotes annualized returns and actual period is 9/30/2007 to 12/31/2014
MaxDD stands for maximum drawdown, the worst loss from peak to trough in the period noted
Returns shown are net of management fees, and include reinvested dividends
In Closing
Sometimes, coming up with a new twist of conveying the same message can be challenging, especially when not much has changed in a few months. That is the case currently. Next newsletter, I’ll expand on the use of cash in client portfolios, and what role that has played in the past three years, but meanwhile, last letter’s conclusion is worth repeating, so see below.
“During the past three years, any strategy with less than a fully invested portfolio, especially in the stock allocation, has under-performed. Playing defense, and being cautious has hurt, rather than helped portfolios. We know. We’ve been there.
We’ve addressed a variety of areas to close the gap, but please know we’re not about to cancel our auto insurance because we’ve not been in an accident, nor our homeowner’s insurance because there’s been no fire. We always remember our mission at TABR—to help you meet your goals with much less risk following a structured, disciplined approach.
The importance of us “sticking to our knitting” will become quite relevant in the next 12 to 24 months, in our view. All of us at TABR are grateful for the trust and confidence you express in us daily.”
Sincerely,

Bob Kargenian, CMT
President
TABR Capital Management, LLC (“TABR”) is an SEC registered investment advisor with its principal place of business in the state of California. TABR and its representatives are in compliance with the current notice filing and registration requirements imposed upon registered investment advisors by those states in which TABR maintains clients. TABR may only transact business in those states in which it is notice filed, or qualifies for an exemption or exclusion from notice filing requirements.
This newsletter is limited to the dissemination of general information pertaining to our investment advisory/management services. Any subsequent, direct communication by TABR with a prospective client shall be conducted by a representative that is either registered or qualifies for an exemption or exclusion from registration in the state where the prospective client resides. For information pertaining to the registration status of TABR, please contact TABR or refer to the Investment Advisor Disclosure web site (www.adviserinfo.sec.gov).
The TABR Model Portfolios are allocated in a range of investments according to TABR’s proprietary investment strategies. TABR’s proprietary investment strategies are allocated amongst individual stocks, bonds, mutual funds, gold and other instruments with a view towards income and/or capital appreciation depending on the specific allocation employed by each Model Portfolio. TABR tracks the performance of each Model Portfolio in an actual account that is charged TABR’s investment management fees in the exact manner as would an actual client account. Therefore the performance shown is net of TABR’s investment management fees.
Comparison of the TABR Model Portfolios to the Vanguard Total Stock Index Fund, the Vanguard Total International Stock Fund and the Vanguard Total Bond Index Fund is for illustrative purposes only and the volatility of the indices used for comparison may be materially different from the volatility of the TABR Model Portfolios due to varying degrees of diversification and/or other factors.
Past performance of the TABR Model Portfolios may not be indicative of future results and the performance of a specific individual client account may vary substantially from the composite results above in part because client accounts may be allocated among several portfolios. Different types of investments involve varying degrees of risk, and there can be no assurance that any specific investment will be profitable.
The TABR Dividend Strategy presented herein represents back-tested performance results. TABR did not offer the Dividend Strategy as an investment strategy for actual client accounts until September/October 2014. Back-tested performance results are provided solely for informational purposes and are not to be considered investment advice. These figures are hypothetical, prepared with the benefit of hindsight, and have inherent limitations as to their use and relevance. For example, they ignore certain factors such as trade timing, security liquidity, and the fact that economic and market conditions in the future may differ significantly from those in the past. Back-tested performance results reflect prices that are fully adjusted for dividends and other such distributions. The strategy may involve above average portfolio turnover which could negatively impact upon the net after-tax gain experienced by an individual client. Past performance is no indication or guarantee of future results and there can be no assurance the strategy will achieve results similar to those depicted herein.
For additional information about TABR, including fees and services, send for our disclosure statement as set forth on Form ADV from us using the contact information herein. Please read the disclosure statement carefully before you invest or send money.
A list of all recommendations made by TABR within the immediately preceding one year is available upon request at no charge. The sample client experiences described herein are included for illustrative purposes and there can be no assurance that TABR will be able to achieve similar results in comparable situations. No portion of this writing is to be interpreted as a testimonial or endorsement of TABR’s investment advisory services and it is not known whether the clients referenced approve of TABR or its services.