Evidence is Neutral. A Disciplined Process.
On September 29, stocks were near their lows for the year, with the S&P 500 down about 12% from its May peak, and other indexes even more. In the last five weeks, that decline has been mostly erased, with gains of nearly 12% in large cap stocks. Other areas have lagged though, which may set up an even larger divergence in the next couple of months between large companies and the broad market.
Our stock market risk models have been mostly cautious since early July, and they typically in aggregate do not change on a dime, but there has been enough improvement in the last couple of weeks to where our tactical equity exposure is now about 44%. This is supported by recent BUY signals from our real estate model and high yield bond model, along with favorable market seasonality, which turned positive in mid-October.
Of the six intermediate to longer term stock market models we use, three are currently positive, which is why I described the evidence as neutral. It is rare for stocks to go down significantly during November and December, and given that the short term trend is more up than down at present, a new high in some indexes is a distinct possibility. Not everything is in sync, though, and barring a significant improvement in the high yield bond market, the sum of the parts suggests stocks are in a multi-month topping process, similar to 2007.
Interest Rates and Valuations
In the past couple of weeks, yields on the 10-year Treasury Note have surged 30 basis points, now at 2.33%. With Friday’s strong employment report, it now seems a foregone conclusion the Fed will raise interest rates at its next meeting, which concludes December 16. It appears markets are already anticipating this.
What will this mean? There have been a number of studies published this year showing that stocks historically have gone up in the first year after an initial increase in rates by the Fed. With the caveat that no one knows what will happen in the future, I think these studies are ignoring valuations and that rates have been depressed for nearly 7 years. The valuation study we published a few months ago using the S&P 500 Median P/E Ratio, as computed by Ned Davis Research, suggests that stocks have about -25% downside risk from current levels just to get to what is considered “fair value.”
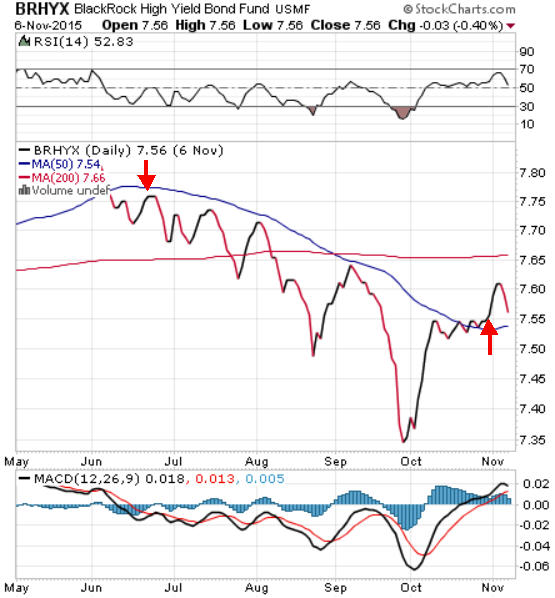
Below is a chart of the Blackrock High Yield bond fund, using weekly data, courtesy of www.stockcharts.com. I’ve inserted a couple of arrows, showing the recent SELL on July 8 and the re-entry BUY on October 26, from our high yield model. In examining the seven funds in client portfolios during this period, I found we bought back at prices ranging from -0.55% to -2.15% lower (including dividends), and avoided drawdowns ranging from -3.69% to -5.10%.
In a perfect world, that is the way a model should work, especially if it can perform consistently over time. But, every model has losses, and every model buys back at higher prices sometimes. In contrast to high yield, that was the case with our real estate model, which sold on June 29 and purchased on November 2. Based on the dividend-adjusted price of the Dow Jones Real Estate Index, prices were 8.9% higher than on June 29. Which brings me to our secondary heading.
A Disciplined Process
There is a money manager and newsletter writer based in Seal Beach, CA by the name of Dan Sullivan, who has been publishing The Chartist since I believe 1969 and The Chartist Mutual Fund letter since around 1989. I’ve been reading his work for many years, as he uses a technical model to time the market and relative strength to select stocks and funds/ETFs.
A couple of the things I admire about Sullivan is his adherence to the discipline of following his models, and the insistence that he invests his own money in every recommendation he makes to clients/subscribers. We’ve emulated this approach at TABR. Below, I constructed a table showing the track record of his stock market model since early 2003, using dividend-adjusted data on the Vanguard S&P 500 Fund.
| Action | Date | Cost | Action | Date | Cost | Gain/Loss | Comment |
| Buy | 4-8-2003 | 64.04 | sell | 8-5-2008 | 105.59 | 64.88% | |
| Buy | 4-15-2009 | 69.49 | sell | 7-9-2009 | 72.45 | 4.25% | |
| Buy | 7-21-2009 | 78.38 | sell | 5-19-2010 | 93.07 | 18.74% | bot back 8.18% higher |
| Buy | 11-5-2010 | 103.17 | sell | 8-8-2011 | 95.52 | -7.41% | bot back 10.8% higher |
| Buy | 1-11-2012 | 111.34 | sell | 8-25-2015 | 172.83 | 55.22% | bot back 16.% higher |
| Buy | 11-3-2015 | 194.87 | bot back 13.3% higher |
As you can see from the table above, there have been only five prior BUY signals from his model since April of 2003. This is clearly a small sample size, with four of the five profitable. When I computed the compound return of using his model on the fund, for the period from 4-8-2003 to 8-25-2015, I found his model earned a 9.3% compound return, while the fund (with dividends) earned 8.3%. It is quite difficult to beat the market, so this is quite an accomplishment.
But, the real value in his approach is limiting the drawdown. During this period, the S&P 500 had a maximum loss from its peak value of over -55%, while I estimate the maximum drawdown from following Sullivan’s model has been just over -18%. This is what risk averse investors want.
Even then, to get these results, one has to have rock solid discipline. In each of the past four SELL signals, one has had to buy back higher anywhere from 8% to 16% higher. Just recently, his model gave a SELL on what has turned out to be the exact low of the year, down -9% on August 25, only to buy back last week, about 13% higher. That’s really hard to take, but is part of being in the markets. There is no perfect method. If one were to only look at 2015, you’d say—“Gosh, that’s terrible. The model is down almost 9% for the year, while the S&P 500 is up about 2%.”
This ignores the fact, though, that the model made 55% on the trade that was initiated back in 2012. It’s all about having the proper perspective, and expectations. I’d be more encouraged by Sullivan’s latest BUY signal if it was supported by more of our risk models, but it’s not at present, so neutral is the stance.
Material of a Less Serious Nature
A 6 year-old and a 4 year-old are raking the yard. The 6 year-old asks, “You know what? I think it’s about time we started learning to cuss.” The 4 year-old nods his head in approval.
The 6 year-old continues. “When we go in for breakfast, I’m gonna say something with hell and you say something with ass.” The 4 year-old agrees with enthusiasm.
When the mother walks into the kitchen and asks the 6 year-old what he wants for breakfast, he replied, “Aw, hell, Mom, I guess I’ll have some Cheerios.” WHACK!
He flies out of his chair, tumbles across the kitchen floor, gets up, and runs upstairs crying his eyes out, with his mother in hot pursuit, slapping his rear with every step. His mom locks him in his room and shouts, “You can stay there until I let you out!”
She then comes back downstairs, looks at the 4 year-old and asks with a stern voice, “And what do YOU want for breakfast, young man?”
“I don’t know,” he blubbers. “But, you can bet your ass it won’t be Cheerios!”
Sincerely,

Bob Kargenian, CMT
President
TABR Capital Management, LLC (“TABR”) is an SEC registered investment advisor with its principal place of business in the state of California. TABR and its representatives are in compliance with the current notice filing and registration requirements imposed upon registered investment advisors by those states in which TABR maintains clients. TABR may only transact business in those states in which it is notice filed, or qualifies for an exemption or exclusion from notice filing requirements.
This newsletter is limited to the dissemination of general information pertaining to our investment advisory/management services. Any subsequent, direct communication by TABR with a prospective client shall be conducted by a representative that is either registered or qualifies for an exemption or exclusion from registration in the state where the prospective client resides. For information pertaining to the registration status of TABR, please contact TABR or refer to the Investment Advisor Disclosure web site (www.adviserinfo.sec.gov).
The TABR Model Portfolios are allocated in a range of investments according to TABR’s proprietary investment strategies. TABR’s proprietary investment strategies are allocated amongst individual stocks, bonds, mutual funds, ETFs and other instruments with a view towards income and/or capital appreciation depending on the specific allocation employed by each Model Portfolio. TABR tracks the performance of each Model Portfolio in an actual account that is charged TABR’s investment management fees in the exact manner as would an actual client account. Therefore the performance shown is net of TABR’s investment management fees, and also reflect the deduction of transaction and custodial charges, if any.
Comparison of the TABR Model Portfolios to the Vanguard Total Stock Index Fund, the Vanguard Total International Stock Fund and the Vanguard Total Bond Index Fund is for illustrative purposes only and the volatility of the indices used for comparison may be materially different from the volatility of the TABR Model Portfolios due to varying degrees of diversification and/or other factors.
Past performance of the TABR Model Portfolios may not be indicative of future results and the performance of a specific individual client account may vary substantially from the composite results above in part because client accounts may be allocated among several portfolios. Different types of investments involve varying degrees of risk, and there can be no assurance that any specific investment will be profitable.
The TABR Dividend Strategy presented herein represents back-tested performance results. TABR did not offer the Dividend Strategy as an investment strategy for actual client accounts until September/October 2014. Back-tested performance results are provided solely for informational purposes and are not to be considered investment advice. These figures are hypothetical, prepared with the benefit of hindsight, and have inherent limitations as to their use and relevance. For example, they ignore certain factors such as trade timing, security liquidity, and the fact that economic and market conditions in the future may differ significantly from those in the past. Back-tested performance results reflect prices that are fully adjusted for dividends and other such distributions. The strategy may involve above average portfolio turnover which could negatively impact upon the net after-tax gain experienced by an individual client. Past performance is no indication or guarantee of future results and there can be no assurance the strategy will achieve results similar to those depicted herein.
For additional information about TABR, including fees and services, send for our disclosure statement as set forth on Form ADV from us using the contact information herein. Please read the disclosure statement carefully before you invest or send money.
A list of all recommendations made by TABR within the immediately preceding one year is available upon request at no charge. The sample client experiences described herein are included for illustrative purposes and there can be no assurance that TABR will be able to achieve similar results in comparable situations. No portion of this writing is to be interpreted as a testimonial or endorsement of TABR’s investment advisory services and it is not known whether the clients referenced approve of TABR or its services.