Inflation, The Role of Cash in Portfolios, Just Say No to Alternatives, and Tax Return vs Total Return
Last quarter, I promised an expansive look at the use of cash (or hedging) in client portfolios. So, that is forthcoming below, along with the latest look at inflation, and the difference between what I will call “tax return vs total return” on your Fidelity statements. Plus, the usual update on the progress of the various portfolios that TABR manages and a comment on Alternative Funds.
Inflation, Social Security COLA & Retirement Planning
There is much angst in the financial press about the upcoming Federal Reserve Board meeting this week, as investors and money managers wait to see if the Fed will ever increase interest rates from essentially 0%, where they have been for about seven years now. Though other data has met the criteria the Fed has outlined, such as the unemployment rate, their target of 2% annual inflation is currently not even close. Given other concerns about stock market declines and uncertainty about China’s growth prospects, along with even more pain to emerging market currencies, it’s very possible the Fed does nothing right now.
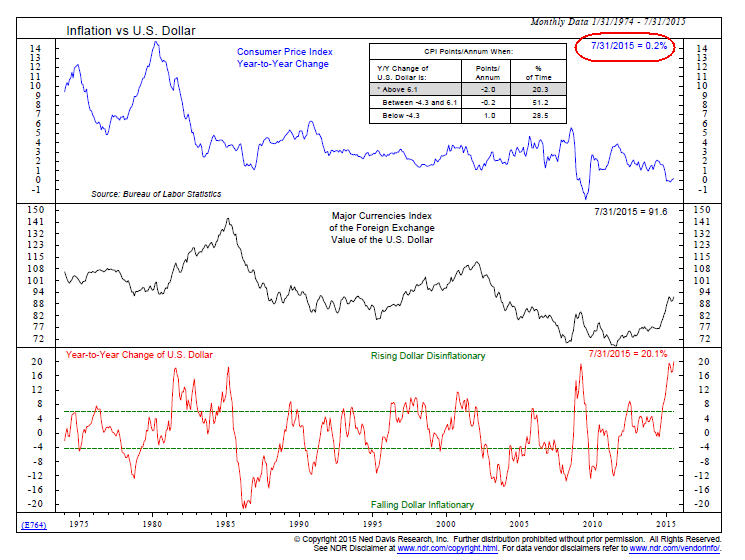
As shown below in the chart, courtesy of Ned Davis Research, the year-to-year price change in the Consumer Price Index, from July 2014 to July 2015 was just 0.2%. In determining the annual COLA (cost-of-living adjustment) that is used for Social Security benefits, which takes effect each January, the government typically uses the year-to-year change from August to August.
We’ll probably not know the official numbers until sometime later this month or in October, but it is possible the inflation change could even be negative for the 12 months ended August 2015, given the plunge in energy prices. When the inflation rate is negative, benefits are not cut, but they simply do not go up. Should this happen, it will be only the third such time in the past 40 years that no COLA would be paid on Social Security benefits, according to Mary Beth Franklin in an article published in Investment News.
I won’t get into the details here, but this also probably means no Medicare premium hike for most beneficiaries because of the “hold harmless” provision that protects the vast majority of recipients. But, this provision does not protect high income earners, so some will in fact be paying more next year, even with no Social Security COLA.
As many of you know, we have to use a future assumption for inflation when we run retirement planning projections. For those in their mid-50s to mid-60s, this data is trying to look out 25 to 35 years. We start with a base case of 3.5% inflation. It is not a forecast of future inflation. We’ve found no model or indicator that can accurately reflect this. It’s simply been the inflation rate in the U.S. since about 1950.
To illustrate its meaning in retirement planning, let’s assume a single or couple is spending $75,000 annually in retirement, on an after-tax basis. At 3.5% inflation, the plan assumes this spending rises by 3.5% each year. So, that would be $77,625 in year 2, $80,341 in year 3, and so on. For some context, though, let’s examine what has been happening with inflation during the past 15 years.
It has actually been averaging about 2.5%. In the past three years, it has been even lower. The COLA for 2014 was 1.8%, the COLA for 2015 was 1.5% and now it appears the COLA for 2016 will be either 0 or perhaps as much as 0.3%. Given the substantial debt levels in the United States, which are higher than at any time in history, I think it is likely that interest rates will remain low for many years. This may mean muted inflation levels as well—I don’t know.
When inflation comes in lower than what we are modeling for a client’s plan, it simply makes that plan stronger over time, and either allows the money to last longer, or for the client to spend more while they are living, both of which are laudable goals. Because energy prices are so depressed when compared with last fall, it may seem likely that a year from now, we’ll be looking at modest inflation. But, one never knows. Some pretty sharp analysts have recently suggested that the price of oil could fall to the $20 level in a worldwide deflationary environment. In any case, 3.5% annual inflation does not seem likely any time soon.
Fidelity Statements—Tax Return vs Total Return
From time to time, a few clients (all unrelated) have called or emailed, and after looking at either their monthly statement, or similar data from their online access to Fidelity’s website, have asked us why we continue to hold certain mutual fund positions in the account, given their substantial losses.
Our initial thoughts in these cases are typically like “what the heck are you talking about?” I know there has to be an explanation, but I also realize your perception can be your reality. Below, we’re going to attempt to show that in many instances, the perception is wrong. But, we want to do this in a light-hearted way. One of our long-time friends and clients is an award-winning journalist, and he often reminds me of the credo “don’t let the facts get in the way of a good story.” Ha.
Before getting into the detail, here is the bottom line of what you see. The % Gain/Loss column that is shown on the Fidelity statements and website represents a tax computation. That is not the same as a total return computation. The tax computation does not adjust for dividends or capital gains paid and reinvested, while the latter does.
Below is the position screen for one of our clients’ accounts, as of January 7, 2015. The portfolio is in TABR’s Passive But Active strategy, and some of the original positions were purchased on June 19, 2014, with the exception of two positions the client previously held (Dodge & Cox Stock & Royce Opportunity).
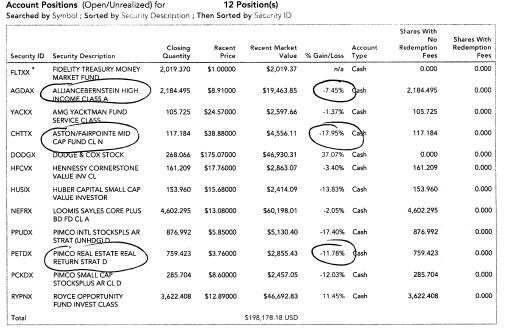
To best illustrate my point, I am going to focus on three positions, which have been highlighted above. The first is Alliance Bernstein High Income (AGDAX). The statement is showing a loss of -7.45%, but when we examine the dividend-adjusted price of the fund on Yahoo Finance, we see it has dropped from 8.79 to 8.59, which is actually a loss of -2.27%. This is a bond fund which pays dividends monthly which are reinvested, but Fidelity’s software does not take this into account.
More glaring differences are apparent when we look at Aston Fairpointe Mid Cap (CHTTX). The statement shows a loss of nearly -18%. But, in December, the fund paid a large capital gain of over $7.60 per share, so its actual total return from purchase date was really -4.07%, not -18%.
And, this is similarly the case when looking at PIMCO Real Estate Real Return (PETDX). The statement shows a loss of nearly -12%, but the fund paid a large dividend of $2.38 per share in December. The dividend-adjusted price of this fund actually went from 6.40 to 7.44 on January 7, which is a gain of over 16%.
Bottom line, it is important for investors to know and remember there is big difference between the tax-computed return of an investment and its total return. We’ve asked the management at Fidelity to rectify this by at least adding an additional column to their statements (preferably side by side) which would show the total return of each investment, adjusted for dividends, capital gains and any purchases or sales. They are in the process of unveiling a new look statement in the next month, and have indicated the above request may be addressed sometime in 2016. We’ll see.
Speaking of tax computations—I should note that last year in November and December, there were an extraordinary amount of large capital gains distributions from many equity mutual funds, likely reflecting the realized gains of many portfolios in 2013 and 2014. I know that our personal tax bill was much larger than normal because of these distributions, but this all works out in the long run. We can’t know where stock prices may be in November, when most funds have concluded their selling for the year, but with nearly 50% of all stocks currently down 20% or more year-to-date, I expect very little in the way of capital gain payouts this year, if any.
The Role of Cash & Hedging in Client Portfolios
Earlier this year, we were having a lunch meeting with one of our long-time clients. Over the years, this particular client has had several astute observations on different topics, and the comments and suggestions have almost always been helpful and relevant to all of our clients. This time was no different.
He’d done some calculations on his own, and realized we’d had a substantial percentage of the portfolios in cash the past few years. Why?
This particular topic is at the heart of why TABR’s performance lagged industry benchmarks by wide margins in 2012, 2013 and 2014, with virtually all of the attribution to the equity side of portfolios. As we’ve previously communicated in prior newsletters, we began to understand this problem in the summer of 2013, and felt we’d pretty much fixed it going forward by the third quarter of 2014. The lessons we’ve learned will not erase the past, but will be extremely valuable in the present and future.
First, let’s start with TABR’s primary money-management philosophy. We are trying to help clients achieve their financial goals with less risk, through the use of Technical Analysis-Based Risk Management. It means playing defense at appropriate times, and not being fully invested at all times, which is the opposite of the passive approach favored by many in the industry. It’s intended to provide a smoother ride than the -40% to -50% losses that stock investors have suffered twice in the past 15 years, and no doubt will suffer again at some point. To achieve these results, one has to be different. And to be different, at some point you’re going to be out of step.
What we found in our analysis was that for the stock market, we were using too many models that were short-term oriented, and not enough that were intermediate to long-term. Ultimately, there is a lot of noise in the stock market, and selloffs of 5% to 10% are quite common, and very difficult to get in and out of. The real value of risk management is minimizing losses when the stock market declines by 20%, 30% and even 50%.
As a result of this short-term orientation, our average tactical equity exposure during 2012 to 2014 was just about 50%, when the trend evidence suggested it should have been much higher. Unfortunately, we were different at the wrong time. Not only is it important to minimize the downside during significant declines, it is also important to reasonably participate in uptrends when they are present. Of the five longer term stock market risk models we are now using, only one of them was in place for the period from 2012 to the present. During the period from 2012 to the middle of 2015, all five of these models were fully invested nearly all of the time. In hindsight, this would have added about 40% of exposure to our equity allocations. At some point, they will be in a bullish position again, but that will likely be after some sort of serious market decline. So, please don’t get the impression that cash or playing defense is irrelevant. It absolutely has its place, especially at the right time, and that gets in to the composition of each model.
Just Say No to Alternatives & Gold/Gold Funds
Though I’ve also covered this before, I’d be remiss if I didn’t mention the role of exposure to the above areas also had in our lag from the past. At the beginning of 2012 and 2013 we had exposure in Moderate portfolios in the four funds listed below in the 22% to 23% range. This was reduced to 8.5% entering 2014 and is now at zero. Look at the comparison against the Vanguard Total Stock Index fund:
2012 2013 2014 2015
Hussman Strategic Growth -12.6 -6.6 -8.50 -0.78
Marketfield Fund 13.50 16.93 -12.31 -6.47
PIMCO All Asset All Authority 17.32 -5.90 -2.76 -8.93
Van Eck Int’l Investors -9.61 -48.91 -6.10 -24.75
Vanguard Total Stock Index 16.25 33.35 12.43 -3.10
We eliminated gold funds in the summer of 2013 (Van Eck), Hussman and Marketfield during the latter part of 2014 and PIMCO’s fund in the first few months of 2015. Needless to say, we would have been better off sticking with our own models, even with being under-invested. Lesson learned.
By the way, investors should note what is different about the stock market decline of the past few weeks in comparison to any declines in 2012, 2013 and 2014. First, the bull market which began in March of 2009 is over 6 years old (if it is not already over), and second, all five of our longer term stock market risk models are negative. Context—just because they are negative is no guarantee stocks will decline. Every one of the models has several historical signals where BUYs have taken place at higher prices than the preceding SELLs. But, every significant decline in stocks since 1985 has taken place when these models are in negative modes. This is no time for complacency.
TABR Dividend Stock Account & Fully Invested PBA
During the first six months of 2015 (and beyond), both energy and utility stocks have been quite poor performers compared to the cap-weighted S&P 500. Since TABR’s Dividend Stock account owns a number of companies in these industries, it is natural for it to be lagging at present.
Dividend income in the second quarter dropped, as a number of higher yielding stocks were sold on the quarterly rebalance and replaced with lower yielding companies. Still, after the first six months, dividend income received is equal to 3.6% annualized of the portfolio value at the beginning of the year. Importantly, the accounts have been in maximum defensive mode of 50% cash, as both of our longer term stock market risk models for this account are in negative mode, one changing in June and the other in early July.
Our fully invested PBA (passive but active) account had small gains at the midpoint of the year, but at this writing, those had evaporated with August’s stock market decline, and tactical portfolios had finally started to show their mettle.
Below is the performance, net of management fees, of TABR’s five different portfolios at present. These represent a majority of the strategies we are using in client accounts, but not all. The differences are mainly attributed to risk (example—moderate allocation versus conservative allocation or aggressive) and account size. The numbers are for the six months ending June 30, 2015 as well as the peak-to-peak cycle from September 2007 to June 30, 2015.
| Type of Account/Strategy | YTD | Benchmark | 09/07 to 06/15^ | MaxDD |
| TABR Tactical Moderate | -0.46% | + 1.45%* | + 0.76% | -25.06% |
| TABR Tactical Conservative | -0.75 | + 0.97** | n/a | |
| TABR Tactical Bond | -0.94 | -0.18*** | +5.45 | -19.73 |
| TABR Dividend Stock | -4.00 | + 1.17**** | n/a | |
| TABR Fully Invested PBA | +1.13 | + 1.55 | n/a | |
| Vanguard Total Stock | +1.83 | +6.60 | -55.38 | |
| Vanguard Total IntlStock | +5.34 | – 0.20 | -60.60 | |
| Vanguard Total Bond | -0.18 | +4.50 | -5.36 |
*consists of 40% Vanguard Total Stock Index, 15% Vanguard Total International Stock Index and 45% Vanguard Total Bond Index
**consists of 30% Vanguard Total Stock Index, 10% Vanguard Total International Stock Index and 60% Vanguard Total Bond Index
***Vanguard Total Bond Index
****Vanguard S&P 500 Index Fund from 12/31/14 to 06/30/2015
^ denotes annualized returns and actual period is 9/30/2007 to 06/30/2015
MaxDD stands for maximum drawdown, the worst loss from peak to trough in the period noted
Returns shown are net of management fees, and include reinvested dividends
In Closing
In the past few months, we’ve been working on some research in regards to our fund selection process, comparing actively managed funds with an ETF (exchange traded fund) portfolio, yet using the same relative strength criteria. We’ll go into this in more detail in the next quarterly letter, and how we plan to use this information with client portfolios going forward.
I mentioned last month that the importance of us “sticking to our knitting” will become quite relevant in the next 12 to 24 months. That was evident in August, and there’s no indication that blue skies are directly ahead. Tactical portfolios are positioned quite conservatively at the moment, reflecting the position of our various models. Remember to check our monthly email updates for any changes. All of us at TABR are grateful for the trust and confidence you express in us daily.
Sincerely,

Bob Kargenian, CMT
President
TABR Capital Management, LLC (“TABR”) is an SEC registered investment advisor with its principal place of business in the state of California. TABR and its representatives are in compliance with the current notice filing and registration requirements imposed upon registered investment advisors by those states in which TABR maintains clients. TABR may only transact business in those states in which it is notice filed, or qualifies for an exemption or exclusion from notice filing requirements.
This newsletter is limited to the dissemination of general information pertaining to our investment advisory/management services. Any subsequent, direct communication by TABR with a prospective client shall be conducted by a representative that is either registered or qualifies for an exemption or exclusion from registration in the state where the prospective client resides. For information pertaining to the registration status of TABR, please contact TABR or refer to the Investment Advisor Disclosure web site (www.adviserinfo.sec.gov.).
The TABR Model Portfolios are allocated in a range of investments according to TABR’s proprietary investment strategies. TABR’s proprietary investment strategies are allocated amongst individual stocks, bonds, mutual funds, ETFs and other instruments with a view towards income and/or capital appreciation depending on the specific allocation employed by each Model Portfolio. TABR tracks the performance of each Model Portfolio in an actual account that is charged TABR’s investment management fees in the exact manner as would an actual client account. Therefore the performance shown is net of TABR’s investment management fees, and also reflect the deduction of transaction and custodial charges, if any.
Comparison of the TABR Model Portfolios to the Vanguard Total Stock Index Fund, the Vanguard Total International Stock Fund and the Vanguard Total Bond Index Fund is for illustrative purposes only and the volatility of the indices used for comparison may be materially different from the volatility of the TABR Model Portfolios due to varying degrees of diversification and/or other factors.
Past performance of the TABR Model Portfolios may not be indicative of future results and the performance of a specific individual client account may vary substantially from the composite results above in part because client accounts may be allocated among several portfolios. Different types of investments involve varying degrees of risk, and there can be no assurance that any specific investment will be profitable.
The TABR Dividend Strategy presented herein represents back-tested performance results. TABR did not offer the Dividend Strategy as an investment strategy for actual client accounts until September/October 2014. Back-tested performance results are provided solely for informational purposes and are not to be considered investment advice. These figures are hypothetical, prepared with the benefit of hindsight, and have inherent limitations as to their use and relevance. For example, they ignore certain factors such as trade timing, security liquidity, and the fact that economic and market conditions in the future may differ significantly from those in the past. Back-tested performance results reflect prices that are fully adjusted for dividends and other such distributions. The strategy may involve above average portfolio turnover which could negatively impact upon the net after-tax gain experienced by an individual client. Past performance is no indication or guarantee of future results and there can be no assurance the strategy will achieve results similar to those depicted herein.
For additional information about TABR, including fees and services, send for our disclosure statement as set forth on Form ADV from us using the contact information herein. Please read the disclosure statement carefully before you invest or send money.
A list of all recommendations made by TABR within the immediately preceding one year is available upon request at no charge. The sample client experiences described herein are included for illustrative purposes and there can be no assurance that TABR will be able to achieve similar results in comparable situations. No portion of this writing is to be interpreted as a testimonial or endorsement of TABR’s investment advisory services and it is not known whether the clients referenced approve of TABR or its services.