Know Your Season, And A Reminder on Perspective
Two weeks ago, our calendars passed September 21, the official beginning of Fall (though it doesn’t seem that way with 95 degree days in Southern California). We also know that on December 21, it will mark the official beginning of Winter. Seasons have a huge impact on you and me.
We know that seasons will come, and seasons will end—they have a duration and all we can do is prepare for them. Each season has its purpose as well. Preparation is the key to seasons, not avoidance. It’s not likely that one would go out and wear shorts and a T-Shirt in NY City in December. Sometimes, it snows in New York. With boots, gloves, sweaters and a heavy jacket, most of the time, that is an inconvenience. But, if one is unprepared for bad weather, whether it be in New York or anywhere, sometimes really bad things can happen.
Honestly, that’s not much different from the financial markets. And, it really helps if one knows what season one is in. If it’s pouring rain in Los Angeles (which hasn’t happened much lately), you certainly don’t drive 85 mph on the freeway, unless you are intent on crashing. Rather, one slows down, and drives cautiously.
In our case, with the help of our various technical and quantitative models, they help to tell us what season the financial markets are in, and therefore, whether it’s OK to drive fast or to slow things down (take on more risk, or reduce risk). If you’ve been reading our commentary regularly, you’ll know since early July we’ve been warning of increased risk, and we’ve taken appropriate action in accordance with our models.
In last month’s email written September 1, we concluded that more selling pressure in the stock market was likely, given the patterns and intensity of the decline which temporarily ended on August 25. After a rebound lasting until the Federal Reserve Board meeting on September 17, stocks then declined anywhere from -6% to -8% in just six days, to this past Tuesday’s close, marking what may be a short term low.
Illustrating this is the chart below, a daily graph of the New York Composite Index, made up of all the stocks on the New York Stock Exchange (chart courtesy of www.stockcharts.com).
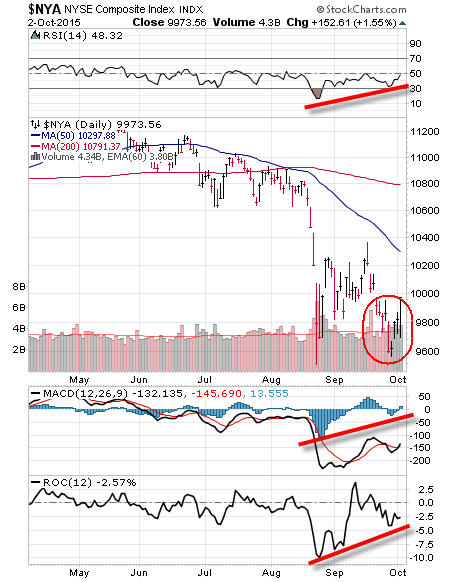
This past week, this index went to a new closing low (as did several other indexes, but not all). However, several momentum indicators made higher lows, as shown on the chart, including the RSI (top clip), MACD and ROC (rate-of-change, bottom clip). In technical jargon, this is known as a positive divergence, and is often present at important turning points (but not always).
For this to be more than just a bounce off an oversold condition, though, prices will have to exceed their September 17 high first. Time will tell.
A Refresher on Market Perspective (and Drawdowns)
Thus far, the decline based on closing prices in the S&P 500 from peak (May 21) to trough on August 25 has been -12.34%. To put this in perspective, look at the graph below, which shows the market declines all the way back to 1950 (courtesy of Corey Hoffstein at Newfound Research).
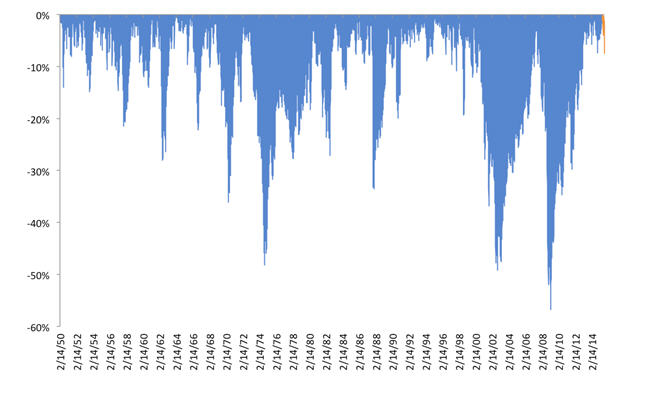
The current decline is barely a blip on the historical record, compared to the significant declines of 1974, 1987, 2000 to 2002 and 2008, which ranged from -35% to -55%.
For those of you who can more easily relate to dollars than percentages, take a look at the graph below, which is simply expressing a 50% drawdown in dollars.
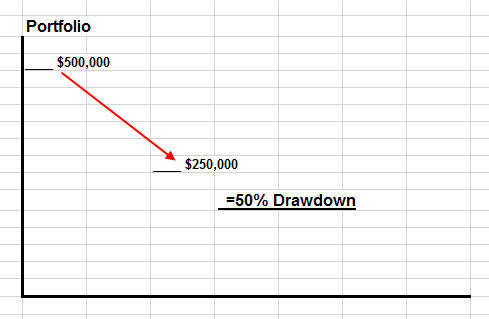
One cannot know when the next decline of -30% to -50% will occur. The spacing of the declines above ranged from 6 years to 13 years. And, since we are more than 6 years from 2008, one could argue the next big decline could take place at any time. My main message on these drawdowns, which are a part of being an investor in the stock market, is just like our message above on seasons—preparation, not avoidance.
TABR’s Moderate Account – What Happened In Real Time
As noted above, thus far, the peak to trough decline in the S&P 500 has been -12.3%, which also included an -11% drop in just 8 days (August 17 to August 25). Other indexes and funds fared even worse, such as the EFA, down -15.4%, the Vanguard Total International Stock Fund, down -17.6% and the EEM (Emerging Markets Index), down -28.9%.
Given our emphasis on risk management, it is fair to ask, how did the TABR Tactical accounts hold up during these declines? Below is a summary of that, and I’ve also included TABR’s Fully Invested account and TABR’s Dividend Stock account for some context. Note–the column on the left is for the period May 21 to August 25, and the column on the right for August 17 to August 25.
| 5/21 to 8/25 | 8-17 to 8/25 | |||||
| S & P 500 Index | -12.35% | -11.00% | ||||
| TABR Tactical Moderate | -3.75 | -1.68 | ||||
| TABR Fully Invested PBA | -10.71 | -7.34 | ||||
| TABR Dividend Stock | -9.96 | -4.94 | ||||
Notice the difference between the Tactical account, and the Fully Invested Account, which maintains a 60% allocation to stock funds and a 40% weight to bond funds. As we’ve maintained, and will continue to emphasize over time, the fully invested approach will capture 100% of the ups and 100% of the downs. It is a more aggressive approach that never plays defense, and it will suffer, sometimes significantly, during severe market declines. In contrast, it will typically do better in strong uptrends.
In contrast, the TABR Tactical account was 60% invested in its stock allocation on May 21 (out of a possible 100%), and had shifted down to 30% by August 17. This resulted in a drawdown of only 30% of the overall stock market decline, and was even better during the 11% plunge. Keep in mind something–we are not necessarily always trying to “beat” the market. Rather, we are trying to achieve client goals over time, with significantly less risk. Should stocks go straight back up from here, and let’s say rally over 10%, the results above will be quite the opposite, with the TABR Tactical account lagging quite a bit. It is all about risk. If investors are using strategies that ultimately they cannot stick with, because at some point, they are losing too much money, what good is that?
For additional context, I also included TABR’s Dividend Stock account in the analysis, since it is an all-stock strategy, but in early July went to a 50% cash position.
Where We Currently Stand
Our overall posture continues to be quite defensive in all areas. Our high yield bond model, real estate model, and 9 out of 10 stock market risk models we maintain continue to be in a negative configuration. Tactical equity exposure is about at 15%. This will rise later in October to the low 20s as seasonal considerations will improve, but we find it hard to see improvement in our models without the stock market showing better internal behavior. We’ll only know in hindsight, but May 21 MAY have marked a major top in the stock market.
Though the fourth quarter may see some type of a rally, it is hard to fathom that two months of decline is enough to correct 6 years of advance, so we subjectively are leaning towards an expectation of lower prices in coming months, at least until our models begin to suggest that the “weather” is better. Remember, in a bear market, the surprises are to the downside, regardless of the news, and the evidence continues to suggest that a majority of stocks are in a bear market.
Material of A Less Serious Nature
A young Scottish lad and lass were sitting on a low stone wall, holding hands, gazing out over the loch. For several minutes they sat silently. Then finally the girl looked at the boy and said, “A penny for your thoughts, Angus.”
“Well, uh, I was a-thinkin’ Brenda… perhaps it’s aboot time for a wee kiss.”
The girl blushed, then leaned over and kissed him lightly on the cheek. Then he blushed.
The two turned once again to gaze out over the loch. Minutes passed and the girl spoke again. “Another penny for your thoughts, Angus.”
“Well, uh, I was a-thinkin’ perhaps it’s aboot time for a wee cuddle, Brenda.”
The girl blushed, then leaned over and cuddled him for a few seconds. Then he blushed.
And the two turned once again to gaze out over the loch. After a while, she again said, “Another penny for your thoughts, Angus.”
“Well, uh, I was thinkin’ perhaps it’s aboot time you let me put my hand on your leg.”
The girl blushed, then took his hand and put it on her knee. Then he blushed.
Then the two turned once again to gaze out over the loch before the girl spoke again. “Another penny for your thoughts, Angus.”
The young man glanced down with a furled brow. “Well, noo,” he said, “noo, my thoughts are a wee bit more serious this time, Brenda.”
“Really?” said the lass in a whisper, starting to fill with anticipation.
“Aye,” said the lad, nodding. The girl looked away in shyness, began to blush, and bit her lip in anticipation of this ultimate request.
Then he said, “Dae ye nae think it’s aboot time ye paid me the first three pennies?”
We’re not certain if we’ll have an update prior to Halloween, so we’ll pray the market doesn’t scare your britches off, and see if we can produce some new photos of the Kargenian/Medland Trick or Treat clan.
Sincerely,

Bob Kargenian, CMT
President
TABR Capital Management, LLC (“TABR”) is an SEC registered investment advisor with its principal place of business in the state of California. TABR and its representatives are in compliance with the current notice filing and registration requirements imposed upon registered investment advisors by those states in which TABR maintains clients. TABR may only transact business in those states in which it is notice filed, or qualifies for an exemption or exclusion from notice filing requirements.
This newsletter is limited to the dissemination of general information pertaining to our investment advisory/management services. Any subsequent, direct communication by TABR with a prospective client shall be conducted by a representative that is either registered or qualifies for an exemption or exclusion from registration in the state where the prospective client resides. For information pertaining to the registration status of TABR, please contact TABR or refer to the Investment Advisor Disclosure web site (www.adviserinfo.sec.gov.).
The TABR Model Portfolios are allocated in a range of investments according to TABR’s proprietary investment strategies. TABR’s proprietary investment strategies are allocated amongst individual stocks, bonds, mutual funds, ETFs and other instruments with a view towards income and/or capital appreciation depending on the specific allocation employed by each Model Portfolio. TABR tracks the performance of each Model Portfolio in an actual account that is charged TABR’s investment management fees in the exact manner as would an actual client account. Therefore the performance shown is net of TABR’s investment management fees, and also reflect the deduction of transaction and custodial charges, if any.
Comparison of the TABR Model Portfolios to the Vanguard Total Stock Index Fund, the Vanguard Total International Stock Fund and the Vanguard Total Bond Index Fund is for illustrative purposes only and the volatility of the indices used for comparison may be materially different from the volatility of the TABR Model Portfolios due to varying degrees of diversification and/or other factors.
Past performance of the TABR Model Portfolios may not be indicative of future results and the performance of a specific individual client account may vary substantially from the composite results above in part because client accounts may be allocated among several portfolios. Different types of investments involve varying degrees of risk, and there can be no assurance that any specific investment will be profitable.
The TABR Dividend Strategy presented herein represents back-tested performance results. TABR did not offer the Dividend Strategy as an investment strategy for actual client accounts until September/October 2014. Back-tested performance results are provided solely for informational purposes and are not to be considered investment advice. These figures are hypothetical, prepared with the benefit of hindsight, and have inherent limitations as to their use and relevance. For example, they ignore certain factors such as trade timing, security liquidity, and the fact that economic and market conditions in the future may differ significantly from those in the past. Back-tested performance results reflect prices that are fully adjusted for dividends and other such distributions. The strategy may involve above average portfolio turnover which could negatively impact upon the net after-tax gain experienced by an individual client. Past performance is no indication or guarantee of future results and there can be no assurance the strategy will achieve results similar to those depicted herein.
For additional information about TABR, including fees and services, send for our disclosure statement as set forth on Form ADV from us using the contact information herein. Please read the disclosure statement carefully before you invest or send money.
A list of all recommendations made by TABR within the immediately preceding one year is available upon request at no charge. The sample client experiences described herein are included for illustrative purposes and there can be no assurance that TABR will be able to achieve similar results in comparable situations. No portion of this writing is to be interpreted as a testimonial or endorsement of TABR’s investment advisory services and it is not known whether the clients referenced approve of TABR or its services.