What We Learn From History Is That People Don’t Learn From History
I was not the one who said that, but was astute enough to find it from all of the reading I do, and it was a quote from none other than Warren Buffett. This is a good time to be reminded, because there is a lot of euphoria built into stock prices since the Trump election victory, which is reflected in many sentiment indicators and one of the more reliable longer term market timing indicators. We’ll look at both below. But, first, some of the good news.
New Highs & Advance Decline Line Suggest Higher Highs
We often talk about market breadth indicators. They can give clues about the health of the stock market. When breadth is confirming price, that is usually a good thing. And, it typically means prices have not made their final high. Recently, daily new highs on the NYSE reached 490 on December 8, the most since May 2013.
In addition, the daily NYSE advance/decline line has reached a new high. According to Lowry’s Research, there have been 19 major stock market peaks since 1926, and in 17 of those cases, there was a divergence in the advance/decline line, typically around 4 to 6 months.
So, if you believe in history, the odds are about 90% that stock prices will be higher in 3 to 6 months than they are now.
A Cautionary Tale about The Longer Term
I’ve featured the indicator below before, and no doubt will write about it in the future. It is called the VLMAP, which stands for Value Line Median Appreciation Potential.
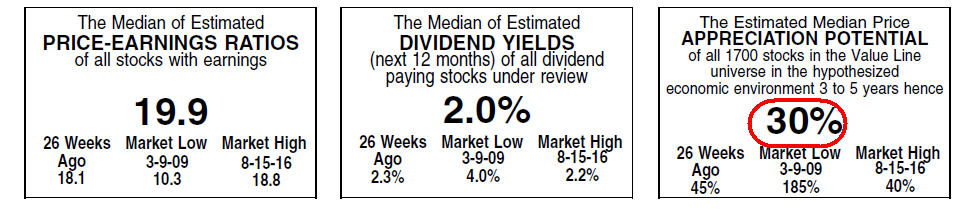
This number is published weekly in the Value Line Investment Survey, a newsletter that has been published since the 1960’s. The VLMAP represents the median of the estimates made by their analysts of how much those stocks will gain over the next 3 to 5 years.
Market Watch columnist Mark Hulbert has been writing about the VLMAP for years, and one of the reasons I follow it closely is because Hulbert’s research shows the model “is one of the select few I have monitored over the past four decades that has actually beaten the stock market.”
I should warn you on a few fronts. This is a valuation-based indicator that can suggest stocks are expensive, or cheap. It is not very helpful over the short term, which can honestly be a few years. I went back into my worksheet and found that in 2013 when stocks were having a terrific year, the indicator got down to 30%, matching the latest weekly reading shown above. This puts the indicator in the 10% of lowest readings since the early 1960’s.
To be specific, it reached 30% on November 1, 2013, and since then the S&P 500 has compounded at 10.6% annually for just over 3 years, and the Russell 3000 at 10.2%. This might make one wonder, because reducing exposure to stocks since then would have been harmful. But, I wouldn’t discount the effectiveness of the indicator, especially as it appears that monetary conditions are tightening.
If one believes in history, the VLMAP is arguing that the next several years could produce substantially below-average returns.
Sentiment Is A Bit Too Frothy
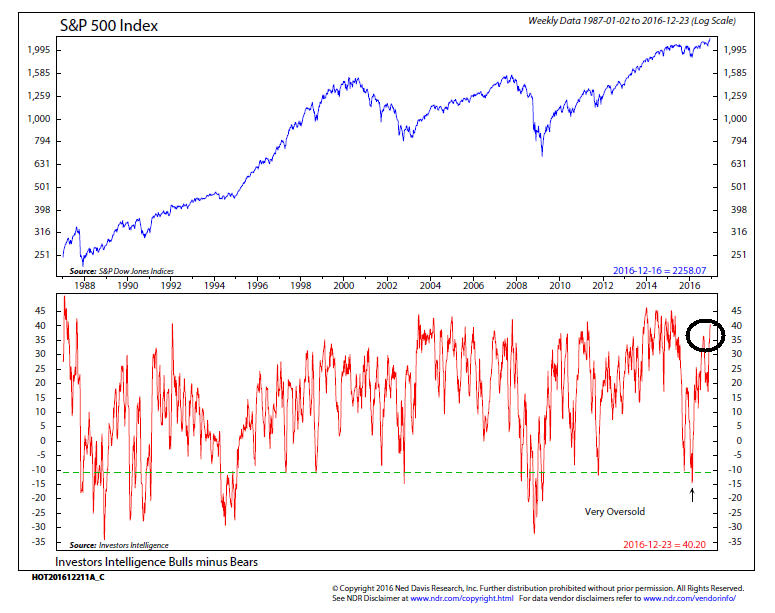
Since November 4, two trading days before the election, the S&P 500 Index has gained 8.6% while the Russell 2000 (small stocks) has surged over 18%. In just over six weeks, sentiment towards the stock market has gone from extreme pessimism based on short term polls to excessive optimism. One of these polls is from Investor’s Intelligence, who has been publishing their bull/bear ratios for many years.
A long term chart of this indicator back to 1988 is shown below, courtesy of Ned Davis Research. We’ve circled the current readings on the far right of the bottom clip of the chart. Sentiment indicators work as opposites. If everybody is bearish, there is no one left to sell, and conversely, if everybody is bullish, there is no one left to buy.
However, the effectiveness of sentiment indicators by themselves is not something one can hang their hat on. Bullish psychology can remain that way for many months while markets continue to rise, just as bearish sentiment can remain in place for many months while markets decline.
You can observe in the chart the period from late 2004 to early 2008. Most of this period was characterized by excessive optimism, yet stocks rose for most of the period except for a minor dip in 2006.
A lot of hope about future policy decisions from President-elect Donald Trump may already be in current stock prices, given the rally since Election Day.
 Forecasts Are For Entertainment, But. . . .
It is natural for clients and other interested parties to ask questions like “what do you think are the prospects for the year ahead?” The boring, but correct answer is, “nobody knows.” But the truth is, television and periodicals might not exist if there wasn’t something to write about the uncertainty of the future.
In terms of investment strategy and process, forecasts and opinions have no place in how we actually manage client portfolios. In our view, they are mostly useless, and can be quite harmful. If the last few months are not enough evidence of this, I’m not sure how else someone could be convinced. If an investor sold all their stocks because they feared the election results, they now look like a schmuck. Not to mention it’s likely cost them a year’s worth of returns in about four weeks.
And, who’s not to say you might also look like a fool if you buy stocks now because you think Donald Trump is going to energize the United States and the economy to its greatest heights ever?
We do understand, though, that clients want to know what you’re thinking and why, so below we’ve featured a cycle chart from Ned Davis Research which blends the one, four and ten year cycles together to offer a projection of what 2017 may look like for the S&P 500.
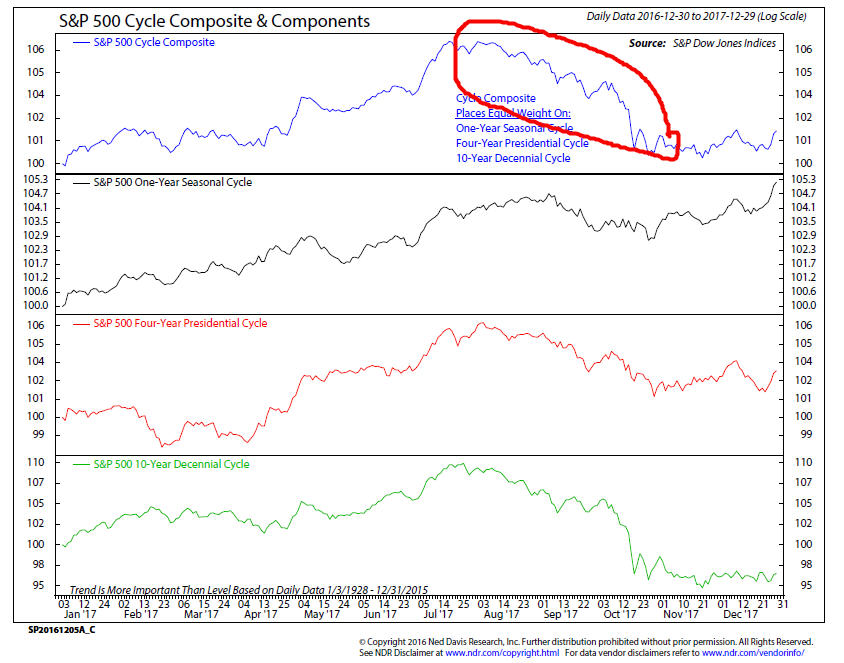
The top clip shows the composite of the three cycles, and shows a generally rising trend for the first half of the year, followed by trouble in the second half.
Last week, Barron’s profiled 10 prominent Wall Street strategists for their outlooks, and not one of them was negative. I should stress that this doesn’t mean they were all out positive. Of the 10, 8 of them projected year-end gains ranging from 1.75% to 6%. Keep in mind, it is pretty rare for Wall Street strategists to be bearish, but the reality of history is that approximately one in every four years, stocks go down.
One quirky stat from Ned Davis is the first year of a Republican President replacing a Democrat. There have only been four such occasions, but the average post-war loss for the S&P 500 has been -10.4%.
As I have emphasized before, monetary policy is likely to be critical. The Fed is now on record of expecting to raise interest rates three times in 2017. Take that with a grain of salt as well, as they projected four hikes in 2016, and there was only one.
My crystal ball is no better than anyone else’s, but here’s my expectation. Stocks will make new highs sometime in the first 4 to 6 months, with the S&P 500 perhaps reaching 2400. The Fed will raise interest rates near mid-year, and that will be the straw that breaks the camel’s back, ushering in a negative environment. As usual, though, we’ll follow the dictates of our various risk models, not our opinions.
Our Dance with American Express
Many of you probably missed this, but in the December 13 edition of the Los Angeles Times, I was featured on the front page of the Business Section in the weekly column by consumer finance writer David Lazarus. Titled “A credit spending limit in name only,” Lazarus conveys the story I told him via email and a phone call of my recent experience with our American Express credit cards.
We established a card for our son, Adam, a year ago prior to him going to Paris for a semester abroad as part of his NYU studies. I established a credit limit on his card of $350. I trust that all of you know what a credit limit is supposed to be for.
Imagine my surprise when I received our bill in October and there were $547 in charges attributed to Adam’s card. Naturally, I called customer service. After about 10 minutes on hold, I was told by a young man that they would look into this and get back to me. Fortunately, I wrote his name down, and his ID #.
Almost two weeks went by with no response. First, we canceled Adam’s card (that is another story of parent/child financial learning), and then I wrote a letter to customer service asking them for an explanation. I also told them that I was not contesting the charges he made (they were legitimate), but I was not paying for anything over the $350 limit until they could explain to me why this took place.
A few weeks later, on the same day, I received two pieces of mail from AmEx. One was our monthly bill, which had a $27 late fee tagged on because I had not paid the entire bill. A separate piece of mail contained a computer generated letter saying they were in receipt of my correspondence and that “in regards to your inquiry about charges on your son’s card and the credit limit, you may call customer service and they will be happy to help you.”
Needless to say, I was pretty angry. So, I called and asked for a supervisor. That took another 20 minutes, and I was finally promised by another young man that he would call me the next day. He did call, and left a message on our home phone, saying he didn’t have an answer yet, but he would call back the next day. Over two weeks went by without a peep.
At that point, I’d had enough and called them and cancelled my card and my wife’s card, and followed that up with another letter, citing their complete lack of a response. I began to wonder if any of this might affect our credit reports because of the late fee charge (even though we were not in the wrong), so I decided to forward my information to Lazarus at the LA Times. To my surprise, he called me the same day and indicated he was in the midst of working on a piece related to this topic, and asked if he could tell the story. He promised me that once he got involved, I would definitely be hearing from American Express.
He was right. Within two days, there was an urgent message from a woman at the Executive Offices of AmEx asking me to call her. She went on to apologize for what happened, but her explanation was typical corporate BS. She said that an authorized transaction could carry over from one billing cycle to the next if it was still being processed at month’s end. I was polite, but quite firm with her, stating that if it hadn’t been for David Lazarus calling them out, she would have never even contacted me.
You can read the complete story by clicking on the following link:
http://www.latimes.com/business/lazarus/la-fi-lazarus-credit-limits-20161213-story.html
As the story and research that Lazarus did conveys, a credit limit isn’t always a credit limit. Know what you have. We know that many of you have a son or daughter in college, learning the nuances of personal finance, just as our son is. We’ve just replaced the Amex cards with a Citibank Visa Double Cash Card, which pays 2% cash back on all purchases with no caps and no restrictions. It’s simply a back up to our main Fidelity VISA, which has a similar benefit and is tied to our Fidelity brokerage accounts. As for American Express, good luck without that COSTCO account. Maybe there’s a reason they lost out to VISA.
Investment Allocations Update
There’s been no change in any of our risk models since our last update, just prior to Thanksgiving. Tactical equity allocations remain at about 60%, while accounts in TABR’s Dividend Stock strategy remain at 82% invested. Our risk models for real estate and high yield bonds remain in negative modes, but the high yield model is very close to going back to positive.
If that happens, our process will move us back to an over-weight position in junk bond funds, but it doesn’t mean I’ll be happy about it. I just don’t feel a BUY signal at this juncture is going to be as positive as the last one that took place in late February. Prices aren’t nearly as cheap, and we now also have a rising interest rate climate.
Material of A Less Serious Nature
In the spirit of forecasting, and not being able to “see” the future, I thought I’d share this short interaction between an employee and his boss. And you thought you’d heard all the excuses. . .
A construction worker calls his boss at 6:30 in the morning and says, “Joe, I’m sorry, but I’m not going to be able to make it today.”
The boss replies, “What’s the problem?”
“Well, I’ve been diagnosed with anal glaucoma.”
“What? What the heck is that?” replied the boss.
The worker said, “I can’t see my ass working today.”
Here’s hoping all of you take some well deserved time off this holiday season, especially to be with family and friends. Thank you for your continued trust and confidence in us. All of us at TABR wish you a Merry Christmas, Happy Hanukkah and a Happy New Year.
Sincerely,

Bob Kargenian, CMT
President
TABR Capital Management, LLC (“TABR”) is an SEC registered investment advisor with its principal place of business in the state of California. TABR and its representatives are in compliance with the current notice filing and registration requirements imposed upon registered investment advisors by those states in which TABR maintains clients. TABR may only transact business in those states in which it is notice filed, or qualifies for an exemption or exclusion from notice filing requirements.
This newsletter is limited to the dissemination of general information pertaining to our investment advisory/management services. Any subsequent, direct communication by TABR with a prospective client shall be conducted by a representative that is either registered or qualifies for an exemption or exclusion from registration in the state where the prospective client resides. For information pertaining to the registration status of TABR, please contact TABR or refer to the Investment Advisor Disclosure web site (www.adviserinfo.sec.gov).
The TABR Model Portfolios are allocated in a range of investments according to TABR’s proprietary investment strategies. TABR’s proprietary investment strategies are allocated amongst individual stocks, bonds, mutual funds, ETFs and other instruments with a view towards income and/or capital appreciation depending on the specific allocation employed by each Model Portfolio. TABR tracks the performance of each Model Portfolio in an actual account that is charged TABR’s investment management fees in the exact manner as would an actual client account. Therefore the performance shown is net of TABR’s investment management fees, and also reflect the deduction of transaction and custodial charges, if any.
Comparison of the TABR Model Portfolios to the Vanguard Total Stock Index Fund, the Vanguard Total International Stock Fund and the Vanguard Total Bond Index Fund is for illustrative purposes only and the volatility of the indices used for comparison may be materially different from the volatility of the TABR Model Portfolios due to varying degrees of diversification and/or other factors.
Past performance of the TABR Model Portfolios may not be indicative of future results and the performance of a specific individual client account may vary substantially from the composite results above in part because client accounts may be allocated among several portfolios. Different types of investments involve varying degrees of risk, and there can be no assurance that any specific investment will be profitable.
The TABR Dividend Strategy presented herein represents back-tested performance results. TABR did not offer the Dividend Strategy as an investment strategy for actual client accounts until September/October 2014. Back-tested performance results are provided solely for informational purposes and are not to be considered investment advice. These figures are hypothetical, prepared with the benefit of hindsight, and have inherent limitations as to their use and relevance. For example, they ignore certain factors such as trade timing, security liquidity, and the fact that economic and market conditions in the future may differ significantly from those in the past. Back-tested performance results reflect prices that are fully adjusted for dividends and other such distributions. The strategy may involve above average portfolio turnover which could negatively impact upon the net after-tax gain experienced by an individual client. Past performance is no indication or guarantee of future results and there can be no assurance the strategy will achieve results similar to those depicted herein.
For additional information about TABR, including fees and services, send for our disclosure statement as set forth on Form ADV from us using the contact information herein. Please read the disclosure statement carefully before you invest or send money.
A list of all recommendations made by TABR within the immediately preceding one year is available upon request at no charge. The sample client experiences described herein are included for illustrative purposes and there can be no assurance that TABR will be able to achieve similar results in comparable situations. No portion of this writing is to be interpreted as a testimonial or endorsement of TABR’s investment advisory services and it is not known whether the clients referenced approve of TABR or its services.