Lump Sum or Pension, Looking Back at 2017, And An Overbought Stock Market
For many workers today, a pension is like a typewriter. They may have heard of one, but they’ve never seen one. That’s because pensions have become a dying breed, as they are just too costly to most employers and have been replaced with defined contribution plans.
Yet, many of our clients and prospective clients who are near retirement DO have pensions, from the likes of such companies as Disney, Kaiser, Rockwell, Kinder-Morgan and others, as well as teachers and other state employees in a variety of professions.
Most, but not all of these employers, offer the prospective retiree a choice of taking a lump sum at retirement, or taking one of several annuity options. The right choice in this decision (or wrong choice), can make a considerable difference in one’s retirement.
In this edition of TABR’s Quarterly Newsletter, we’re going to examine this topic in detail. We’ll also touch on a recap of 2017 and how TABR’s various strategies finished. Finally, we’ll have an update on the overbought nature of the stock market, which started 2018 with a gain of over 7% in the first 26 days, and has given it all back in 6 days. So, buckle up, and get ready to read.
Evaluating the Pension Versus Lump Sum Decision
Despite a number of technical articles on this subject, where the argument is comparing the trade-off of calculating the internal rate of return (IRR) of the pension cash flows versus what might be called the “hurdle” rate that a lump sum would need to generate in order to match the same cash flow, I don’t feel this decision is merely mathematical.
There are too many other variables that come into play, as we have learned in counseling real clients with different sets of needs and circumstances. In some cases, choosing a lump sum is an easy decision, typically when someone’s life expectancy is short, or if the hurdle rate is relatively low. Other times, the return on the annuity is just too good to pass up, since it is guaranteed for life, and then he/she doesn’t have to worry about the risk of outliving the money.
But, these are not easy comparisons, because with the annuity, there is nothing left at the end, even when one selects a joint and survivor option for their spouse. In contrast, a lump sum enables the retiree to invest and potentially earn greater cash flows and still have funds left when they die for their spouse or heirs. Ultimately, this can become a question about longevity and the risks of running out of money.
This is why when recommending a particular option for a client, we look at the entire picture. What other sources of income does the person/couple have? Is there an additional guaranteed stream from Social Security? Is there rental income from property? How much is in retirement plans and after-tax brokerage accounts and savings that can generate income from a portfolio? Is it important to leave money to heirs? What is the health of the person/couple, and what is their family history of longevity? Did both parents die at a young age (like in their 60s), or are they still living in their mid-to-late 80s? What about siblings?
In our view, only when one puts all this information together can one make an intelligent decision. In addition, one needs to understand the personality of the person, and their risk tolerance. Some clients may have plenty of resources, but if they know that a large portion of their spending needs will be covered by guaranteed income, it allows them to sleep better at night, and not worry about what is happening in the financial markets. For others, this aspect is not as bothersome. It just depends on the person. Ultimately, we have found that what is the right decision for you, may not be the right decision for me, no matter what the math may say.
What Is The GATT Rate, And Why Does It Matter?
In a few weeks, we are doing a review and planning session with a long-time friend and client. In this case, both spouses have pensions from S&P 500 companies from former employers. We’re evaluating joint survivor options, which we’ll cover in a moment. You might ask, though, what determines the size of a pension lump sum, or the monthly annuity amounts?
Well, that would be the GATT Rate. This is the yield on the 30-year Treasury Bond, and it is used as a benchmark for calculations of lump sum distributions from defined benefit plans. GATT stands for General Agreement on Tariffs and Trade. A plan’s life expectancy assumptions and the plan’s discount rate determine the lump sum calculation. And importantly, not all plans use the same assumptions (including for life expectancy). Some are more or less favorable, as we have found when comparing options from different insurance companies.
For instance, current actuarial projections show that 65% of people aged 65 will live to 85, and 25% of people aged 65 will live to age 95. This means that many of our clients who may retire at age 65 can expect to live 20 or 30 years in retirement.
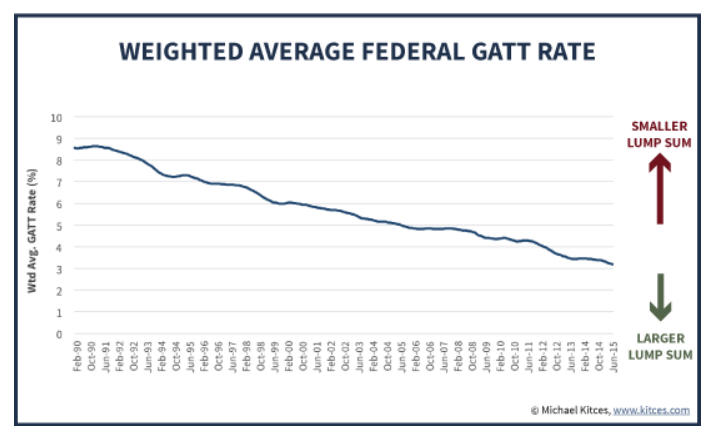
The reason that the discount rate (GATT) is significant is because it is somewhat inversely correlated with the lump sum pension amounts. In higher interest rate environments, the higher GATT rate translates to a higher internal rate of return that must be met, which means the lump sum amount will shrink. In contrast, lower discount rates are associated with larger lump sums, which means they are favorable for producing lump sums which have easier hurdle rates to clear.
To illustrate its history, below I’ve reproduced a chart that financial planner and blogger Michael Kitces (www.kitces.com) created for a 2015 article (thanks Michael!).
Also, below, in table form, I’ve shown the most recent GATT rates from 2017.
| 2017 GATT Rates | |
| December | 2.77% |
| November | 2.80 |
| October | 2.88 |
| September | 2.78 |
| August | 2.80 |
| July | 2.88 |
| June | 2.80 |
| May | 2.96 |
| April | 2.94 |
| March | 3.08 |
| February | 3.03 |
| January | 3.02 |
Besides comparing the internal rate of return of the pension option to a lump sum, there is another factor that retirees should consider. That is, what is the risk that your pension payments could be limited in the event of a default? This is not as likely with a state or city pension, even though many state plans are vastly underfunded, simply because the plans are obligations of the state or city.
In recent years, both the cities of Stockton and San Bernardino went into Chapter 9 bankruptcy and there were reports that within the negotiations, the cities wanted to cut pension obligations but ultimately that was scuttled before possibly going to the California Supreme Court as there was tremendous pressure from the unions involved.
However, it is an entirely different story with corporate pensions. They are subject to the health of the company. And though the Pension Benefit Guaranty Corporation (PBGC) does offer protection to most corporate plans, they do have a maximum benefit, and for those with larger pensions, they could be at risk of losing benefits if their company were to go bankrupt. Not only could this happen, it does happen.
One of our long-time clients spent many years in her career as a flight attendant at United Airlines. United went bankrupt back in 2002, re-organized, and her benefits were taken over by the PBGC and were subsequently slashed by about 50%. Here, there was very little our client could do. Do you remember Eastman Kodak? They filed for bankruptcy in January 2012. How about Enron, a former member of the S&P 500? Gone.
In a slightly different twist, one of our clients back in 2012 was given a “buyout” from his long-time employer, a major telecommunications company, where he had worked for nearly 30 years. He had accumulated a strong pension benefit, and the lump sum option was just over $1.2 million, plus he was only in his mid-50s, so “retirement” was not imminent.
In this case, the lump sum analysis we did actually found that the hurdle rate compared to the annuity options was pretty low, which favored the lump sum, but one of the big reasons he decided to go with the lump sum was his concern that Verizon might have financial problems down the road, which could put his pension in jeopardy.
Sure, here we are six years later and the company appears to be very healthy, but you never know. For our client, having control of the money was more important, and it was a bonus that the math mostly worked in his favor.
Other Options—It Doesn’t Have To Be Black Or White
It’s also important to educate clients that in some cases, they can have their cake and eat it too. What I mean by that is, one does not always have to choose between a lump sum and the pension. You can have both, IF the pension plan offers a lump sum. Not all of them do.
Let me explain. I’ll use an actual case from last year to illustrate. Our client retired after a lengthy career at a major health care provider and had also accumulated a substantial pension benefit, with a lump sum option of just over $1 million. In the spirit of full transparency, they did not consult with us until AFTER they had actually made a decision to take a lump sum, which is something we’d highly suggest you not do, unless you really know what you are doing. These decisions are irrevocable.
In their case, though, they confided to us that they were concerned that if they took the pension, and even selected a survivor benefit, they would leave a lot of money on the table if they were to both die early. So, regardless of the numbers, this was the overriding factor in their process. I’m going to digress here a bit, as one way to overcome the concern of dying young and getting no money back from a pension is to select an annuity option that comes with a period certain feature.
Not all plans have these options, but in this case, 5, 10, 15 and 20-year certain and life annuity options were available. The “certain” aspect of these options means that if the annuitant were to die before the period was up, the remaining payments would still be made to their beneficiary. For example, her plan offered a 15-year certain annuity paying $3938 per month. She was 64 years old in 2017, so that means the payments would go until at least 2032. Now, let’s say in six years, she has a heart attack and dies unexpectedly. What happens to her pension?
In this illustration, she would have received 6 years’ worth of payments (72 x 3938), or $283,536. But, there would still be 9 years of payments left, or 108 payments (12 x 9), totaling $425,304 that would be paid to her spouse as the beneficiary. This is one way to “ensure” that you don’t leave a ton of money on the table if you die early. To be sure, the longer period of “certainty,” the less money you will be guaranteed on a monthly basis.
Now, let’s contrast this choice of a period certain annuity with a simple Joint and Survivor annuity, which is a common option with most plans. Below are four different Joint and Survivor options that were available, in lieu of a lump sum of $742,790.
| Form of Payment | Monthly Benefit | Survivor’s Monthly Benefit |
| 50% Joint & Survivor Annuity | $4,534 | $2,267 |
| 66 2/3% Joint & Survivor Annuity | $4,136 | $2,757 |
| 75% Joint & Survivor Annuity | $4,023 | $3,017 |
| 100% Joint & Survivor Annuity with 15-Year Certain & Pop-Up | $3,719 | $3,719 |
Here’s how these options work. If one were to choose the 50% Joint & Survivor option, they would receive $4,534 in monthly benefits until they die, at which point their spouse would see a 50% reduction in benefits to $2,267. When their spouse dies (if they had not pre-deceased the annuitant/retiree), all benefits stop. This would be true of the top 3 options illustrated above, but not the option with the 15-year certain and Pop-Up.
So, to go back to the concerns of our client, here is an illustration of a bad outcome. They select the 75% Joint Survivor Annuity, and three years from now, they are tragically killed in a car crash as they headed to a family dinner on a Friday night. Poof. No more benefits, not even to heirs. In the 15-year Certain option, though, another 12 years of payments would be made to their heirs.
Besides liquidity issues and potential default issues, along with return comparisons, how does one decide which direction to go? In addition to looking at other sources of income like Social Security, and how much is saved in retirement and after-tax brokerage accounts, one of the first areas to consider is life expectancy, and family longevity. In this case, our real-life couple, who we’ll call Cathy and Todd, are 64 and 67, respectively. In looking at the Joint Life Mortality Calculator partially shown below, we get some really helpful data to consider.
| Age | Age | Probability Alive | |||||||
| Year | Todd | Cathy | Todd | Cathy | Both | Todd Only | Cathy Only | Either | Neither |
| 0 | 67 | 64 | 100% | 100% | 100% | 0% | 0% | 100% | 0% |
| 1 | 68 | 65 | 98 | 99 | 97 | 1 | 2 | 100 | 0 |
| 2 | 69 | 66 | 96 | 98 | 94 | 2 | 4 | 100 | 0 |
| 3 | 70 | 67 | 93 | 97 | 90 | 3 | 7 | 100 | 0 |
| 4 | 71 | 68 | 91 | 95 | 86 | 4 | 9 | 100 | 0 |
| 5 | 72 | 69 | 88 | 94 | 82 | 5 | 11 | 99 | 1 |
| 6 | 73 | 70 | 85 | 92 | 78 | 7 | 14 | 99 | 1 |
| 7 | 74 | 71 | 82 | 91 | 74 | 8 | 16 | 98 | 2 |
| 8 | 75 | 72 | 79 | 89 | 70 | 9 | 19 | 98 | 2 |
| 9 | 76 | 73 | 75 | 87 | 65 | 10 | 21 | 97 | 3 |
| 10 | 77 | 74 | 72 | 85 | 61 | 11 | 24 | 96 | 4 |
| 11 | 78 | 75 | 68 | 82 | 56 | 12 | 26 | 94 | 6 |
| 12 | 79 | 76 | 64 | 80 | 51 | 13 | 29 | 93 | 7 |
| 13 | 80 | 77 | 60 | 77 | 46 | 14 | 31 | 91 | 9 |
| 14 | 81 | 78 | 56 | 75 | 42 | 14 | 33 | 89 | 11 |
| 15 | 82 | 79 | 52 | 72 | 37 | 15 | 35 | 86 | 14 |
| 16 | 83 | 80 | 47 | 69 | 33 | 15 | 36 | 83 | 17 |
| 17 | 84 | 81 | 43 | 65 | 28 | 15 | 37 | 80 | 20 |
| 18 | 85 | 82 | 39 | 62 | 24 | 15 | 38 | 77 | 23 |
| 19 | 86 | 83 | 34 | 58 | 20 | 14 | 38 | 73 | 27 |
| 20 | 87 | 84 | 30 | 54 | 16 | 14 | 38 | 68 | 32 |
Here are some additional things to consider when viewing this table. The data used is not personalized to the person’s health history. This is data based on the average life spans of men and women, and the tables are updated periodically as new data becomes available. The table goes out to beyond age 100, but I stopped after 20 years for space reasons.
What we see is that after 20 years, there is a 30% chance that Todd will be alive, but a 54% chance that Cathy will be living. Yet, there is only a 16% chance both will be living. The four far right columns look at things a bit differently. After 20 years, there is a strong 68% chance that one of them will be alive, but also a 32% chance (nearly 1 in 3) that neither will be here.
Then, throw in the fact that Cathy’s Mom is still living at age 95, and both of Todd’s parents died at age 87, and you begin to get the picture that they have pretty decent longevity odds. As it turned out, our clients had also expressed an interest in having a portion of their retirement income guaranteed (in addition to Social Security). So, an annuity of some sort was on their mind, but they just didn’t want the entire sum in an annuity (loss of control and liquidity). So, how does one accomplish this?
What you do, IF a lump sum is an option, is first process a lump sum rollover to an IRA. In this case, there was about $1 million transferred to an IRA. From there, in collaboration with the client, one can decide how much to put into an annuity of some sort, and how much to leave in the IRA, which would then be invested in a traditional stock/bond portfolio tailored to the clients’ risk preferences and income needs. For the sake of argument here, say we invest $500,000 in an annuity and leave $500,000 in the IRA. Presto. The client gets both some guaranteed income and some liquidity. This is typically not possible within the company plan options, as one has to choose one or the other, and most plans will not allow you to take a “partial” pension.
Some Other Things To Be Aware Of
Depending on the plan assumptions and the life expectancy tables being used by the plan, sometimes the math works in favor of the client not only taking a lump sum, but also doing so even if to do an annuity on their own. And, candidly, sometimes the plan is more favorable. This gets into the vagaries of a group plan versus an individual plan.
Besides all of the external factors we’ve cited above that need to be considered, the normal method of comparing a lump sum option to an annuity option is to calculate what is called the Internal Rate of Return (IRR). This is the interest rate at which the present value of all the cash flows from an investment equal zero. In this context, this is the same as the “hurdle” rate I referred to above. Below is a comparison of our clients’ lump sum option ($742,790) to a couple of the annuity options and their respective IRR.
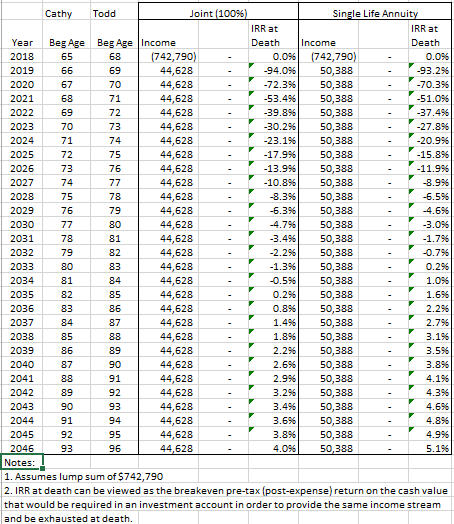
You can see that the longer the client lives, the higher the IRR of the annuity. At age 90, for the Joint 100% Survivor option, the IRR is 3.4%. That is the hurdle rate that the lump sum must do better than. At face value, that is a pretty low rate and in favor of the lump sum, but remember these don’t look like apples vs apples. For instance, to produce $44,628 annually from a lump sum of $742,790, one would need to earn 6% on the capital. That’s not so easy, though it is possible (but not guaranteed). Obviously, if one could do that over time, it would be a no brainer to take the lump sum, since once Todd and Cathy had passed away, there would still be $742,000 left to pass on to their heirs, while with the annuity options, there would be nothing.
I can tell you that we would not advise someone to take the lump sum in this example, and then draw $44,000 a year in income at a 6% draw rate, and expect to keep their principal intact 20 years from now. What would be more realistic would be to take a 4% draw rate of say about $30,000. This would increase the odds of having a large lump sum left over. The shortfall could be made up from other areas that the client has, sometimes including life insurance.
A Warning On Lump Sums
I hope that we’ve painted a picture for you in that the correct answer to this question of lump sum versus pension is highly individualized, and dependent on putting all the puzzle pieces together and then marinating them with the collaborative feedback of the client. In closing, there are two other things to be aware of.
Some clients don’t have the discipline to take a lump sum. What I mean is, they don’t have the discipline to take reasonable draws and stick to it. Instead, some of them see this big pile of money and for some reason, think it is always going to be there, so they just spend and spend and spend. Candidly, for many of them, if not most of them, they’ve never had that much money before. So, knowing yourself is really important. As advisors, we can only do so much. We can warn clients that they are taking too much money out of their accounts and it’s not going to last, but we cannot stop them from spending. It is their money, and sometimes the choices people make in these areas can have unpleasant consequences.
Secondly, when faced with this decision, we think it’s critically important for clients to work with a fiduciary, fee-only advisor who has their best interests at heart. We are tooting our own horn here, along with that of colleagues like us, but hear me out. If an advisor gets paid by commissions, and many of them still do, especially those who work heavily with insurance products, they are almost always going to recommend a lump sum to you, because that is the only way they can sell a product and get a big commission or put the assets under management to get a fee. In simple terms, this is a huge conflict of interest.
Despite the increased recognition today in the financial press of the importance of working with a fiduciary advisor/planner, we continue to come across terrible, horrible insurance products that a number of our clients and prospective clients have been sold by other advisors. Many of these policies and products are quite difficult for even us to understand, let alone clients, and it’s a shame that some of this crap exists in our industry. Mind you, I’m not saying that all fiduciary advisors are great at what they do. They aren’t. That would be like saying all doctors are great. Hell, you can finish at the bottom of your medical class and they still call you Doctor. The message is—know who you are dealing with and where they are coming from.
Looking Back At 2017
We’ve always found it useful to look backwards and contemplate what we’ve done. This can be helpful even when things seem to be going right, but even more so when they’re not. It’s how one can make course corrections, and fix things.
Transparency has been a fixture at TABR since we were founded in 2004. The vast majority of RIAs in our business do not publish a track record. They may cite compliance issues, or the work necessary to comply with regulations, or that all their clients have “customized” portfolios. Simply put, we do publish one, because we believe in our process, and our staff backs that up by investing the vast majority of their personal savings in the exact same strategies we use for clients.
Sometimes, the numbers aren’t pretty. That is part of being in investment management. Even the best money managers in the business go through years of underperformance. We are no different. The key is, in our view, sticking with your discipline, but also having the courage to fix things when something may be amiss.
And though below you will see comparisons to industry benchmarks, ultimately we are judged by helping our clients achieve their goals, with substantially less risk than passive, buy and hold strategies. Besides our combined 47 years of financial planning and investment management wisdom, that is probably the one big difference and edge we have over competitors.
As one could imagine with a number of stock indexes up over 20% for the year, it was a good year for the financial markets, including fixed income.
Stock Allocations
Our tactical equity allocations began the year 60% invested, were up to 85% by mid-July and then moved to 100% invested in mid-October. Only two changes to our core group of ETF’s took place as the relative strength rankings were pretty stable all year. We added the QQQ (Nasdaq 100) in March and the IEMG (Emerging Markets) in September. On average, equity exposure was 80% during the year, and we estimate that our combination of ETFs and funds earned a 17% return for the year.
But, when the combined equity benchmark we use is up 22.63% (which is 75% Vanguard Total Stock and 25% Vanguard Total International Stock), and one is holding 20% cash for the year, there is going to be a decent lag compared to being fully invested.
A couple of portfolio notes. Early in the year, we made a decision to eliminate a 5% allocation to Real Estate that we had been using with a risk model we had developed back in 2006 and 2007. Our reasoning was that we no longer felt the edge from the model and importantly, also felt that real estate was getting more and more correlated with the overall stock market (unlike back in 2000), and therefore the diversification really wasn’t providing anything at all.
So, we moved those funds to our overall general stock market allocation. It has only been one year since making this change, but thus far, it has been helpful. The Dow Jones Real Estate Index (IYR), which we have owned in the past as a proxy for this asset class, was up just 9.37% for the year, and is already down over -5.6% in 2018 (with our model still clinging to a BUY).
The other change was to stop using style box funds from Pro Funds and Rydex, and go entirely with our ETF lineup, which will also be the case when we get into an environment where we’ll need to use inverse funds. In the past, when our risk models were greater than 50% invested, we might own Pro Funds Mid Cap Value (MLPIX) as an extra position beyond the ETFs. The edge in expenses is just too much to ignore, though. For instance, MLPIX charges 1.78% while the S&P Midcap Value ETF (IJJ) charges 0.25%.
We see similar discrepancies with the inverse funds and ETFs. The inverse S&P 500 Fund BRPIX charges 1.63% but the inverse S&P 500 ETF, SH, charges 0.89%. The difference in performance of the two funds is almost entirely due to the difference in the expense ratio. All of these things contribute to the bottom line, and are better for our clients and their portfolios.
Bond Allocations
The 10-year Treasury Yield ended the year almost exactly where it began, at 2.40%. The benchmark Vanguard Total Bond Fund gained 3.43% for the year, but each of our bond strategies bested this number, and TABR’s all-bond account gained 5.9%. Below are the full-year returns for 3 of the 4 strategies in our accounts.
PIMCO Income Fund 8.60%
Sierra Strategic Income Fund 5.88%
BSCO Guggenheim 2024 Bullet Share 5.41%
About 60-65% of our bond money is devoted to corporate high yield, in combination with short term bond funds and our risk model for high yield. We are currently using about 12 different high yield funds, such as Lord Abbett High Yield and JP Morgan High Yield. We estimate returns for the various combinations ranged from about 6.4% to 7.3%. Our risk model for high yield was on a BUY signal the entire year, and we were about 85% invested in high yield and 15% in short term funds.
Below is the performance, net of management fees, of TABR’s five different portfolios at present. These represent a majority of the strategies we are using in client accounts, but not all. The differences are mainly attributed to risk (example—moderate allocation versus conservative allocation or aggressive) and account size. The numbers are for the one year ending December 31, 2017.
| Type of Account/Strategy | 2017 Return | Benchmark |
| TABR Tactical Moderate | 8.3% | 13.03%* |
| TABR Tactical Conservative | 6.8% | 10.15%** |
| TABR Bond Account | 5.9% | 3.43%*** |
| TABR Dividend Stock | 12.8% | 21.67%**** |
| TABR Passive Index Mix | 12.3% | 14.95%***** |
| Vanguard Total Stock Market Index | 21.05% | n/a |
| Vanguard Total International Stock Index | 27.40% | n/a |
| Vanguard Total Bond Market Index | 3.43% | n/a |
| Vanguard S&P 500 Index Fund | 21.67% | n/a |
*consists of 37.5% Vanguard Total Stock Index, 12.5% Vanguard Total International Stock Index and 50% Vanguard Total Bond Index
**consists of 26.25% Vanguard Total Stock Index, 8.75% Vanguard Total International Stock Index and 65% Vanguard Total Bond Index
***Vanguard Total Bond Index
****Vanguard S&P 500 Index Fund
*****consists of 45% Vanguard Total Stock Index, 15% Vanguard Total International Stock Index and 40% Vanguard Total Bond Index.
Returns shown are net of management fees, and include reinvested dividends
An Overbought Stock Market
Everyone has been wondering when downside volatility was going to return to the stock market. For 15 months, it has been the opposite of that workout mantra—in this case, call it All Gain and No Pain. Until the last six market days. After surging 7.5% in the first 26 days of January, (pretty much a year’s return in about 3 weeks), stocks have dropped -7.8% in just six days, with the most intense selling in over 3 years. I know what you’re thinking—is the bull market finally over?
First, some perspective. The stock market, as measured by the Relative Strength Index (RSI), recently reached on its monthly chart one of the most overbought readings of the past 100 years. There have only been four prior occasions, and none of them were great times for adding to positions. As a general rule, a reading above 70 is considered overbought (bearish), while a reading under 30 is considered oversold (bullish).
The chart below, courtesy of www.stockcharts.com, is using daily data back to September 2016, and one can see stocks have not been oversold on this basis since November 2016. On a very short term basis, the McClellan Oscillator, a measure of advancing and declining stocks, hit its most oversold reading in over 3 years. A bounce, perhaps a sharp one, is likely from either the rising trendline on the chart around the 2600 level, or the 200-day moving average at 2533.
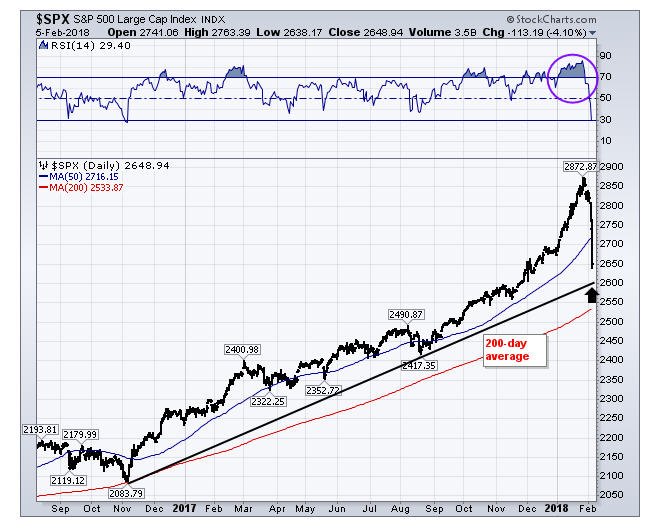
As I have mentioned in past updates, the stock market has typically not made a major peak without first creating a number of divergences in breadth indicators. Except for the Dow Jones Utility Average, everything was in gear at the January 26 peak, just 10 days ago. So, if the past is any indication, the recent highs should be surpassed in the next few months. That doesn’t mean they will be. Anything can happen in the stock market, as we have all witnessed in the past 15 months. We will adjust to the evidence as it changes.
Regarding that, over the weekend one of our 8 stock market risk models generated a SELL, so equity allocations were reduced on Monday to about 86%, which is still an above average level. Our high yield bond model has also weakened, but we will not know if a SELL comes about until the rest of this week’s data plays out. It is important to remember that stocks have typically declined much faster than they go up, and the last week has been a reminder of this.
If you may be wondering what we may be doing in response to the last week, our answer is that we will be doing the same thing we’ve been doing the past 16 months (and beyond). That is, simply following our process. It is a lot more fun when our portfolio’s go up, but the reality is, dealing with the downside of markets is one of the most important things in portfolio management.
Material Of A Less Serious Nature
There was a terrible fire at Hanson’s ice fishing house and a body was discovered in the charred remains. The morgue needed someone to identify the body, so they sent for his two best hunting and fishing friends, Sven and Ole.
The mortician greeted Sven first. “I know you, Hans, and Ole were almost inseparable the past few decades. I’m sorry you have to see this.” With that, he pulled back the sheet covering the body.
Sven peered closely and said, “Yup, his face is burned up pretty bad. You better roll him over.” The mortician rolled the body over and Sven said, “Nope, that ain’t Hans.”
The mortician thought this was rather strange, so he brought Ole in to confirm the identity. Ole looked at the body and said, “Yup, he’s pretty well burnt up, roll him over.” The mortician again rolled him over and Ole said, “No, it ain’t Hans.”
“How can you tell?” the mortician asked.
“Well…..” said Ole, “Hans had two assholes.”
“What? He had two assholes?” asked the mortician.
“Yup, we never seen ’em, but everybody used to say: “There’s Hans with them two assholes.'”
As always, we are grateful for the trust and confidence you place in all of us at TABR.
Sincerely,

Bob Kargenian, CMT
President
TABR Capital Management, LLC (“TABR”) is an SEC registered investment advisor with its principal place of business in the state of California. TABR and its representatives are in compliance with the current notice filing and registration requirements imposed upon registered investment advisors by those states in which TABR maintains clients. TABR may only transact business in those states in which it is notice filed, or qualifies for an exemption or exclusion from notice filing requirements.
This newsletter is limited to the dissemination of general information pertaining to our investment advisory/management services. Any subsequent, direct communication by TABR with a prospective client shall be conducted by a representative that is either registered or qualifies for an exemption or exclusion from registration in the state where the prospective client resides. For information pertaining to the registration status of TABR, please contact TABR or refer to the Investment Advisor Disclosure web site (www.adviserinfo.sec.gov).
The TABR Model Portfolios are allocated in a range of investments according to TABR’s proprietary investment strategies. TABR’s proprietary investment strategies are allocated amongst individual stocks, bonds, mutual funds, ETFs and other instruments with a view towards income and/or capital appreciation depending on the specific allocation employed by each Model Portfolio. TABR tracks the performance of each Model Portfolio in an actual account that is charged TABR’s investment management fees in the exact manner as would an actual client account. Therefore the performance shown is net of TABR’s investment management fees, and also reflect the deduction of transaction and custodial charges, if any.
Comparison of the TABR Model Portfolios to the Vanguard Total Stock Index Fund, the Vanguard Total International Stock Fund and the Vanguard Total Bond Index Fund is for illustrative purposes only and the volatility of the indices used for comparison may be materially different from the volatility of the TABR Model Portfolios due to varying degrees of diversification and/or other factors.
Past performance of the TABR Model Portfolios may not be indicative of future results and the performance of a specific individual client account may vary substantially from the composite results above in part because client accounts may be allocated among several portfolios. Different types of investments involve varying degrees of risk, and there can be no assurance that any specific investment will be profitable.
The TABR Dividend Strategy presented herein represents back-tested performance results. TABR did not offer the Dividend Strategy as an investment strategy for actual client accounts until September/October 2014. Back-tested performance results are provided solely for informational purposes and are not to be considered investment advice. These figures are hypothetical, prepared with the benefit of hindsight, and have inherent limitations as to their use and relevance. For example, they ignore certain factors such as trade timing, security liquidity, and the fact that economic and market conditions in the future may differ significantly from those in the past. Back-tested performance results reflect prices that are fully adjusted for dividends and other such distributions. The strategy may involve above average portfolio turnover which could negatively impact upon the net after-tax gain experienced by an individual client. Past performance is no indication or guarantee of future results and there can be no assurance the strategy will achieve results similar to those depicted herein.
For additional information about TABR, including fees and services, send for our disclosure statement as set forth on Form ADV from us using the contact information herein. Please read the disclosure statement carefully before you invest or send money.
A list of all recommendations made by TABR within the immediately preceding one year is available upon request at no charge. The sample client experiences described herein are included for illustrative purposes and there can be no assurance that TABR will be able to achieve similar results in comparable situations. No portion of this writing is to be interpreted as a testimonial or endorsement of TABR’s investment advisory services and it is not known whether the clients referenced approve of TABR or its services.