Monthly Update January 2015
CONCLUSION—Expect More Up and Down Volatility
In the 5 trading days ending January 6, the S&P 500 Index dropped nearly -4% and in the process, wiped out the entire gains from the normally favorable seasonal periods in November and December. In actuality, December was a down month for that index, but other indexes did rise.
Much of the selling pressure has been attributed to the continuing price decline in oil. There’s no way to know the bottom for oil, but the chart below courtesy of Ned Davis Research suggests a price low may not be far off.
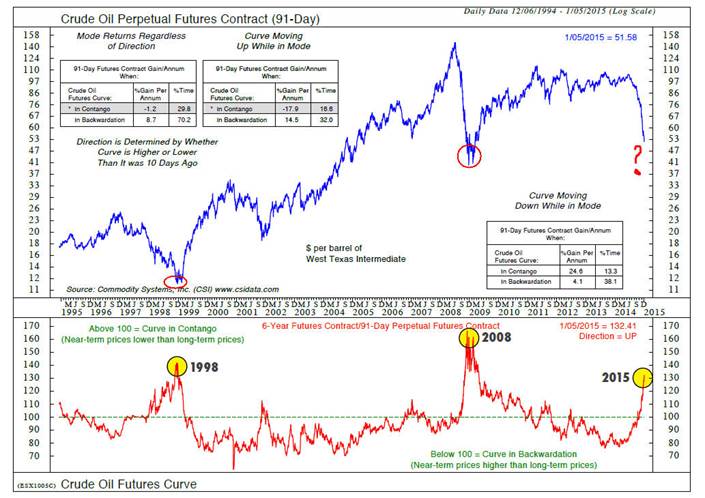
The oil market is in a situation called contango, which is where the future spot price of a commodity is below the current price. People are willing to pay more for a commodity at some point in the future than the actual expected price. In the last 20 years, there have been two prior cases where the futures curve in Crude Oil has reached similar contango levels, and these have marked important price bottoms. Note, however, that the level reached over 160 in 2008, so though the crude oil market is exhibiting extreme signs of panic, it is possible prices could go much lower, even below $40 per barrel. As I mentioned in last month’s email, this process is deflationary, and not necessarily a positive.
2015—Something’s Got To Give
As I’ve written many times in the past, forecasting financial markets is mostly a waste of time. The accuracy of economists and Wall Street strategists is dismal, yet everyone is always wondering, “what do you expect markets to do?”
Our preferred method is to examine what historical research says as a roadmap, but ultimately to rely on various models which will react and change when market dynamics change.
As noted previously, analysis using the Presidential Cycle pattern shows that in the third year of a President’s term, there has not been a down year since the mid-1930’s. There is a similar positive bent using the Decennial Cycle, as years ending in 5 have all been positive since 1925. So, no worries, eh?
Just to confuse you—consider this. “Since 1875, we have never seen the S&P 500 rise for seven calendar years in a row, so an eighth year would seem highly unlikely,” Societe Generale’s Roland Kaloyan remarked in a December 17 note to clients. The bottom line is, one can always find something to justify their opinion, but as Paul Whitfield wrote in a recent Investor’s Business Daily column, “Success in the stock market comes from adjusting your strategy to the current reality, not from guessing the future.”
Objectively, there was some positive near term evidence a couple of weeks ago. On December 17, upside volume exceeded down volume by a ratio greater than 10 to 1. This was followed on December 18 when up volume was greater than 4 to 1 over down volume. This Volume Thrust signal was developed by Dan Sullivan of The Chartist newsletter, and it has an excellent historical record. The table below was produced by Ned Davis Research, and they took the data back to 1949.
When looking out six months after the signal date (126 days), in 27 of the 29 prior cases, stocks were higher, with median gains of over 12%. Likewise, there have been only 3 losing signals looking out 9 months later and one year later.
S&P 500 INDEX
% Gain Around the START of Up/Down Volume >10, >4
(Screened for 35 Days)
| Event Date 10-Days | 21-Days | 63-Days | 126-Days | 189-Days 252-Days | ||
| 7/20/1949 | 1.20 | 3.54 | 6.15 | 12.56 | 16.57 | 26.12 |
| 9/22/1949 | 1.81 | 2.77 | 6.13 | 11.10 | 17.42 | 20.06 |
| 7/19/1950 | 3.40 | 6.80 | 13.54 | 20.22 | 24.65 | 23 .73 |
| 11/9/ 1950 | 1.87 | -1.72 | 8.79 | 12.18 | 9.35 | 20.21 |
| 12/ 18/ 1950 | 4.63 | 7.30 | 10.13 | 8.11 | 15.57 | 15.3 1 |
| 1/27/ 1951 | 2.60 | 1.81 | 3.11 | 0.51 | 10.50 | 9.48 |
| 11/ 19/ 1952 | 1.11 | 3.24 | 1.18 | -1.18 | -4.03 | -3.51 |
| 11/4/ 1954 | 1.89 | 5.91 | 11.03 | 15.23 | 29.07 | 29.04 |
| 1/ 10/1955 | -0.75 | 1.87 | 4.61 | 19.45 | 18.41 | 23.39 |
| 3/16/1955 | 1.50 | 5.50 | 10.87 | 25 .04 | 25 .26 | 33 .38 |
| 9/28/1955 | -6.30 | -4.90 | 1.90 | 9.41 | 6.36 | 2.91 |
| 10/3/ 1956 | -0.04 | 0.52 | 0.30 | -3.87 | 5.66 | -7.54 |
| 11/29/ 1957 | -2.37 | -4.15 | -2.11 | 5 .68 | 14.24 | 25.79 |
| 11/28/ 1958 | 1.41 | 5.20 | 7.18 | 11.72 | 13.36 | 11.05 |
| 6/7/ 1967 | 1.42 | 0.86 | 3 .83 | 5 .20 | -2.07 | 11.55 |
| 5/ 28/ 1970 | -0.21 | – 1.53 | 8.85 | 13.63 | 29.90 | 33.48 |
| 11/29/1971 | 4.88 | 9.42 | 13.68 | 18.47 | 18.48 | 24.95 |
| 8/23/1982 | 4.53 | 6.79 | 18.01 | 27.47 | 39.64 | 41.23 |
| 10/ 7/ 1982 | 7.97 | 10.37 | 12.79 | 17.83 | 30.09 | 30.23 |
| 8/3/1984 | 1.10 | 1.56 | 3.17 | 10.03 | 10.92 | 17.94 |
| 11/2 1/ 1986 | 2.16 | 0.20 | 15.06 | 17.59 | 35.58 | -1.57 |
| 1/ 5/ 1987 | 6.80 | 9.44 | 19.12 | 20.91 | 30.09 | 1.49 |
| 10/ 30/ 1987 | -2.44 | -7.86 | 1.29 | 3.88 | 8.11 | 10.62 |
| 6/ 1/ 1988 | 2.91 | 2.55 | – 1.57 | 1.58 | 7.66 | 20.18 |
| 3/18/2009 | 2.11 | 9.47 | 14.65 | 34.55 | 39.48 | 46.76 |
| 7/8/2010 | 2.19 | 4.80 | 8.38 | 19.28 | 24.79 | 26.44 |
| 9/2/2010 | 3.26 | 4.31 | 12.06 | 21.20 | 19.27 | 10.49 |
| 12/2/ 2010 | 1.75 | 4.12 | 8.16 | 6.44 | -1.40 | 1.89 |
| 1/ 2/2013 | 0.70 | 3.47 | 6.67 | 10.46 | 15.83 | 25.27 |
| 12/ 18/ 2014 | ||||||
| Mean | 1.76 | 3.16 | 7.83 | 12.92 | 17.54 | 18.29 |
| Median | 1.81 | 3.47 | 8.16 | 12.18 | 16.57 | 20. 18 |
| A ll Mean | 0.34 | 0.72 | 2.15 | 4.38 | 6.62 | 8.89 |
| Ned Davis Research | Group | HOT20 14 7 2237 . 1 | ||||
No indicator is perfect, and as I noted in the headline, something has to give in 2015. But given that advance/decline lines continue to confirm price highs all the way into late December, and this typically precedes market peaks by four to six months, the odds continue to favor higher prices for the first four to six months of 2015. If there is to be a significant decline this year, analysis suggests it would take place sometime after June/July. I’ve not said one word about stock market valuations—they are a terrible timing tool, but I will save a good chart on that area for next month’s email or for the quarterly print letter.
Portfolio Allocations
Not much change here at all. At present, the majority of our stock market risk models are positive, indicating 70% tactical equity exposure. This is in contrast to our high yield bond models, which remain 90% invested in short term bond funds (since August 1). The position in Loomis Sayles Bond remains at 30%, reflecting weakness in corporate bond prices, yet our GNMA model remains 100% invested, and our real estate model remains strongly positive. Regardless of near-term volatility, heavily defensive positions are not warranted at this time by our collective models, and we remain mildly positive, but not quite fully invested in our tactical strategies. In December, we finished rebalancing all accounts, and have completely eliminated holdings in Hussman Strategic Growth (HSGFX) and significantly reduced allocations to PIMCO All Asset All Authority. More commentary will be forthcoming on these decisions in the quarterly print letter, but as I’ve written previously, my stubbornness with Hussman has been wrong, and it’s been a learning experience that will help us, and therefore, our clients, as we move forward.
Material of a Less Serious Nature
Finally, we’ll begin the New Year with a classic:
Three golf partners died in a car wreck and went to heaven.
Upon arrival they discover the most beautiful golf course
they have ever seen. St. Peter tells them that they are all
welcome to play the course, but he cautions them that there
is only one rule: Don’t hit the ducks in your first three
months here.
The men all have blank expressions, and finally one of them
asks, “The ducks?”
“Yes”, St. Peter replies, “There are millions of ducks
walking around the course and if one gets hit, he quacks
then the one next to him quacks and soon they’re all
quacking to beat the band and it really breaks the
tranquility. If you hit the ducks, you’ll be punished,
otherwise everything is yours to enjoy.”
Upon entering the course, the men noted that there were
indeed large numbers of ducks everywhere. Within fifteen
minutes, one of the guys hit a duck. The duck quacked, the
one next to it quacked and soon there was a deafening roar
of duck quacks.
St. Peter walked up with an extremely homely woman in tow
and asks, “Who hit the duck?”
The guy who had done it admitted, “I did.”
St. Peter immediately pulled out a pair of handcuffs and
cuffed the man’s right hand to the homely woman’s left
hand. “I told you not to hit the ducks,”, he said. Now
you’ll be handcuffed together for eternity.”
The other two men were very cautious not to hit any ducks,
but a couple of weeks later, one of them accidentally did.
The quacks were as deafening as before and within minutes
St. Peter walked up with an even uglier woman. St.Peter
cuffed the man’s right hand to the homely woman’s left
hand.
“I told you not to hit the ducks,” he said; “Now
you’ll be handcuffed together for eternity.”
The third man was extremely careful. Some days he wouldn’t
even move for fear of even nudging a duck. After three
months of this he still hadn’t hit a duck. St. Peter
walked up to the man at the end of the three months and had
with him a knock-out gorgeous woman, the most beautiful
woman the man had ever seen. St. Peter smiled to the man and
then, without a word, handcuffed him to the beautiful woman
and walked off.
The man, knowing that he would be handcuffed to this woman
for eternity, let out a contented sigh and wondered aloud,
“I wonder what I did to deserve this?”
The woman responds, “I don’t know about you, but I hit a
duck.”
Here’s to a great 2015.
Sincerely,
Bob Kargenian, CMT
TABR Capital Management, LLC(“TABR”) is an SEC registered investment advisor with its principal place of business in the state of California. TABR and its representatives are in compliance with the current registration and notice filing requirements imposed upon registered investment advisors by those states in which TABR maintains clients. TABR may only transact business in those states in which it is notice filed, or qualifies for an exemption or exclusion from notice filing requirements.
This newsletter is limited to the dissemination of general information pertaining to our investment advisory/management services. Any subsequent, direct communication by TABR with a prospective client shall be conducted by a representative that is either registered or qualifies for an exemption or exclusion from registration in the state where the prospective client resides. For information pertaining to the registration status of TABR, please contact TABR or refer to the Investment Advisor Disclosure web site(www.adviserinfo.sec.gov.).
For additional information about TABR, including fees and services, send for our disclosure brochure as set forth on Form ADV from us using the contact information herein. Please read the disclosure brochure carefully before you invest or send money.
The results of TABR’s Model Portfolios are net of actual fees deducted from client accounts and include the reinvestment of dividends and other earnings. Comparison of the TABR Model Portfolios to other indices is for illustrative purposes only and the volatility of the indices used for comparison may be materially different from the volatility of the TABR Model Portfolios due to varying degrees of diversification and/or other factors. The returns noted of various market indices include reinvested dividends unless otherwise noted.
Comparison of the TABR Model Portfolios to the Vanguard Total Stock Index Fund, the Vanguard Total International Stock Fund and the Vanguard Total Bond Index is for illustrative purposes only and the volatility of the indices used for comparison may be materially different from the volatility of the TABR Model Portfolios due to varying degrees of diversification and/or other factors.
Past performance of the TABR Model Portfolios may not be indicative of future results and the performance of a specific individual client account may vary substantially from the model results above in part because client accounts may be allocated among several portfolios or have substantial cash flow in or out of the account. Different types of investments involve varying degrees of risk, and there can be no assurance that any specific investment will be profitable.
This newsletter contains general information that is not suitable for everyone. The information contained herein should not be construed as personalized investment advice. There is no guarantee that the views and opinions expressed in this newsletter will come to pass. Investing in the stock market involves gains and losses and may not be suitable for all investors. Information presented herein is subject to change without notice and should not be considered as a solicitation to buy or sell any security.
A list of all recommendations made by TABR within the immediately preceding one year is available upon request at no charge.