Nothing Goes Up Forever, But Then Again, Maybe The Horse Will Talk
Much of what we fear is never realized. This is true in life, as well as in markets. We think we know what tomorrow will bring. The reality is, we don’t know, either for better or worse. Tomorrow is but a fog.
The story is told of a man who was caught stealing in a far-off kingdom. As he was brought before the king, he was informed that the penalty for stealing is death. Despite the stress of the inevitable, the man seemed relatively calm. He knew that the king had a beloved, prized horse that was treated like a member of the family. And the thief planned on playing a hunch.
When the man was brought before the king to be judged and sent to his execution, the thief asked if he could say a few words. The king agreed.
“Your majesty, I know you have a wonderful horse. If you will give me one year to work with him, I will teach your horse to talk. If I am successful, you will spare my life.” The king thought over the man’s offer for a moment and agreed.
On the way out of the king’s chamber, one of the man’s friends said, “Are you crazy? You can’t teach the horse to talk! You’ll be dead in a year.” To which the temporarily reprieved man replied, “You may be right. But you know what? A lot can happen in a year. I may die of natural causes, the king may die, or …….the horse may talk.”
What does this story have to do with markets? As we’ve been pointing out, fundamental valuation indicators of various sorts have been suggesting that stocks are quite overvalued, and that future returns for the next five to ten years could be quite muted (perhaps similar to the thief dying). But as we’ve also conveyed, valuations are terrible for timing. Another illustration of this lies below, which is the Intrinsic Value indicator used by the Leuthold Group, as part of their Major Trend Index.
Maybe The Horse Will Talk
The history of this indicator goes back nearly 42 years. Its range has been approximately +700 to -1700. Currently, it is about -550, which as you can see below, is worse than it was in 2007, prior to a 50% plus drop in the stock market.
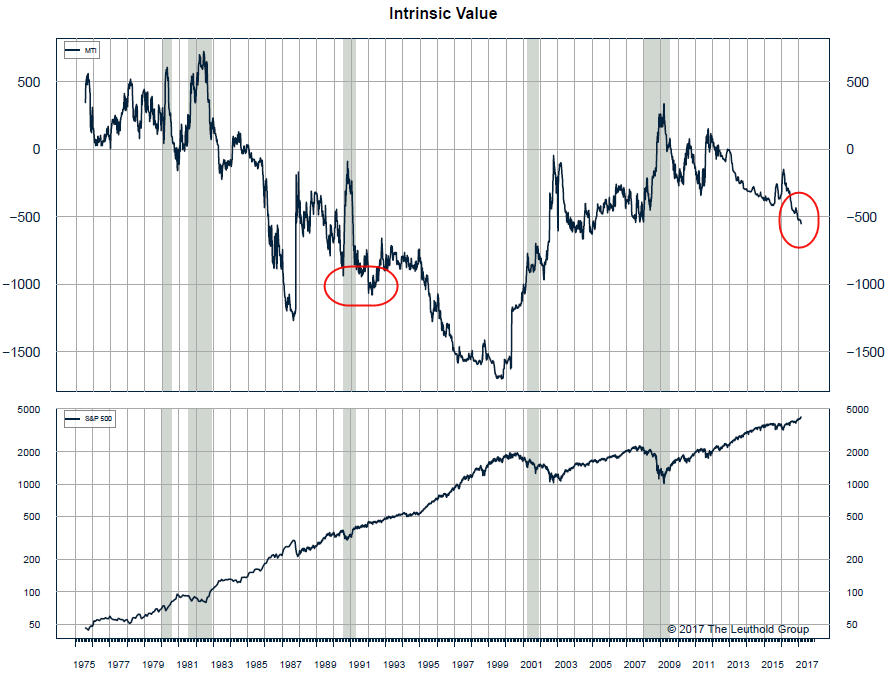
But take a look at the reading around 1992, when it was approximately -1050. That is about double today’s negative reading. Yet, stocks went up substantially between 1992 and 1999, before valuations finally mattered, and stocks entered the 2000-2003 bear market. Valuations are a gauge of risk, and it is clear stocks are expensive, but in and of itself, that is not a SELL signal.
Another Way Of Looking At Things
Ned Davis Research created some interesting asset allocation charts a few years ago which plot equities as a percentage of household financial assets, and then linking this indicator to the subsequent rolling 10-year S&P 500 Index Total Return. This chart is shown below, courtesy of NDR, and the correlation between the two is an astounding 0.91, with the data going back to 1951. For those of you not familiar with statistics, this is extremely high.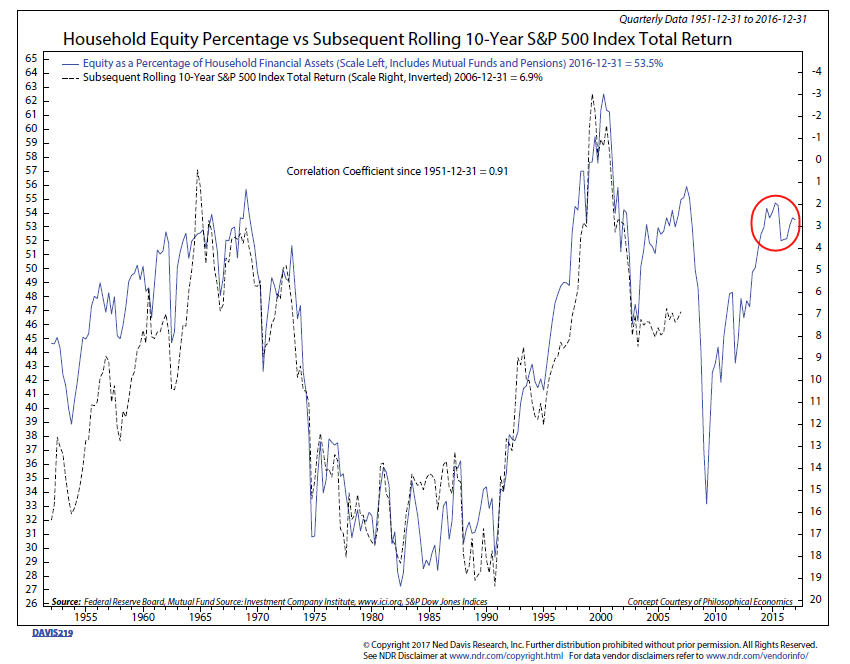
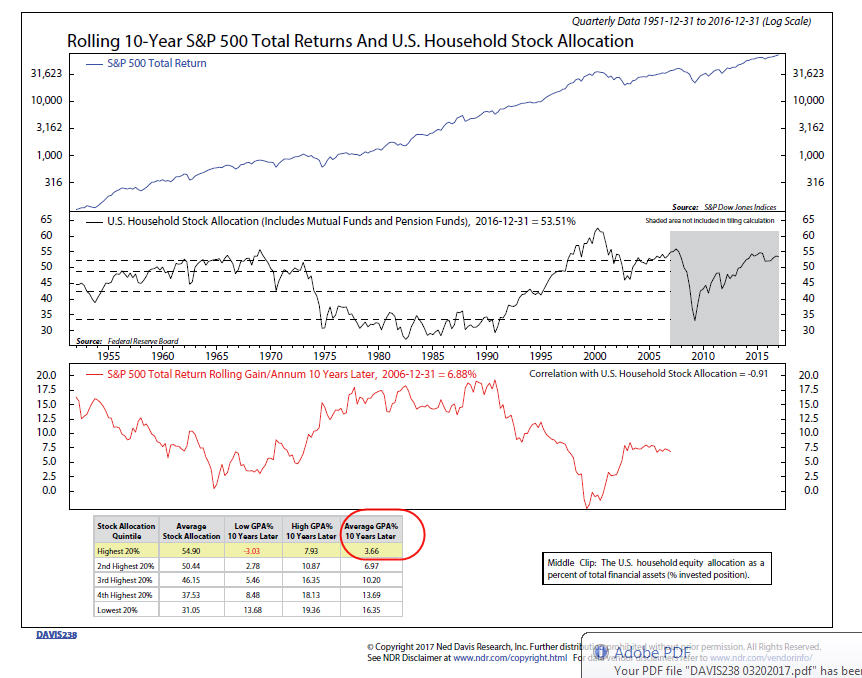
In the second chart below, NDR broke the readings into quintiles, and then computed the average GPA (gain per annum) 10 years later, along with the lowest and highest GPA for that quintile. At present, the indicator is suggesting an average gain for the next 10 years of about 2.5%. That’s below what one could earn in bonds (which have a lot less risk, I might add). But, look at the low and high range. Prior outcomes for the highest 20% of readings have ranged from -3.03% to 7.93%. In other words, maybe the horse never talks, but there are times when the king dies.
Today’s Evidence And Current Investment Allocations
Very little has changed in our outlook, with stock market allocations remaining at around 65% of maximum, and our high yield corporate bond risk model still on its BUY signal from January 3. Most stock market peaks display negative divergences, or non-confirmations, but at the recent peak a couple of weeks ago, almost everything was in gear. As a result, the probabilities continue to favor higher prices three to six months out, even if there is an intervening price decline of -5 to -10%.
Last week, the Federal Reserve Board increased the Fed Funds rate to a range of 0.75% to 1%, the third increase since December 2015. Partly because of recent weakness in energy prices, our high yield bond model had weakened considerably through last Tuesday, but reversed sharply after the Fed’s decision.
In recent years, stocks have been deemed to be more valuable by many on Wall Street as interest rates declined to zero, and essentially stayed there. If that axiom is true, then stocks MUST be less valuable when interest rates rise. How high do yields have to go before stocks tumble? There is no way to know, but the technicals will tell us by the way the market is acting, and right now, it is still acting moderately bullish.
Why Buying And Holding Stocks Is Different (Than Funds)
Passive investing is all the rage these days, and I suppose the assumption is mostly true that if you purchase domestic stocks funds, and hold on long enough, you’ll eventually make money. That hasn’t been the case with several foreign countries, but it really becomes problematic with individual companies. A recent story on a prominent name you’ll all recognize is a great reminder that diligent, on-going portfolio management is really important.
I’m not certain I’ve ever heard anyone complain about having a negative experience shopping at Nordstrom. The goods are high quality, and the service reputation is much like that of Ritz Carlton—do whatever it takes to please the customer.
You’d think, therefore, that the company would be doing great. Mind you, they’re profitable and make money every year. But look at the monthly chart below. On April 20, 2007 the stock closed at 56.72 and last Friday, March 17 it was at 43.92. I computed the dividend adjusted compound return for this nearly 10 year period, and found that Nordstrom stock has gained all of 0.4% a year. Trust me, you can’t buy their $500 suits, even at the post-Christmas Men’s Sale, with returns like that.
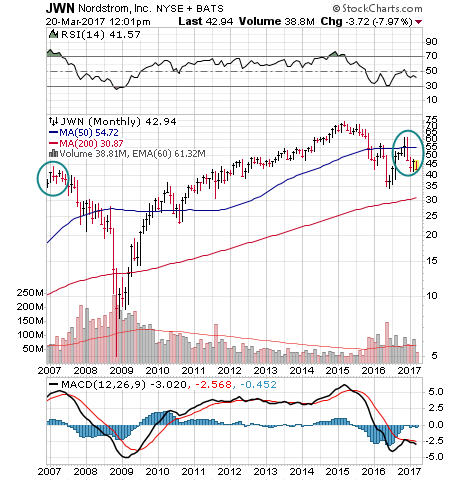
I won’t pretend to know what’s happened in this period, but can tell you that 10 years ago they earned $2.80 per share and in 2017, are expected to earn only $3.15. Stocks are a long term claim on discounted cash flow and earnings growth is normally part of that. On that front, Nordstrom has failed miserably.
Contrast that with COSTCO, another store with a great reputation (and products). In the exact same period I measured Nordstrom, the price of COSTCO stock has gone from 55.12 to 167.81, and the compound return using dividend adjusted data has been 14.3%, during a period when their earnings have grown from $2.63 per share to $5.90 per share.
It’s really hard to know which companies will become the COSTCO’s, and which will become the Nordstrom’s. I think that may be why most investors and advisors have gone more and more to using mutual funds and ETF’s. In an index of say 500 companies, a number of poor performers won’t doom you. For those investing in individual companies, this is a stark reminder—you can’t set them and forget them.
An IRA Funding Reminder
This year’s tax filing deadline is Tuesday, April 18. This is because April 15, the normal deadline, falls on a weekend, and Monday, April 17 is recognized as Emancipation Day. For those of you who wait until the last minute to make IRA, Roth IRA and SEP IRA contributions for 2016 into your accounts, we need to physically have your checks in hand no later than Monday, April 17 so we will have time to scan them and deposit them. Remember, Friday, April 14 is the Good Friday holiday and we will be closed and there will be no mail delivery. Checks should be made payable to Fidelity Investments. Bottom line—don’t wait until the last minute.
Material Of A Less Serious Nature
The local bar was so sure that its bartender was the strongest man around that it offered a standing $1000 bet. The bartender would squeeze a lemon until all the juice ran into a glass and hand the lemon to a patron. Anyone who could squeeze one more drop of juice would win the money. Many people had tried over time, but no one could do it.
One day, a scrawny little man came in, wearing thick glasses and a polyester suit, and said in a tiny, squeakly voice, “I’d like to try the bet.” After the laughter had died down, the bartender said OK, grabbed a lemon, and squeezed away. He then handed the wrinkled remains of the rind to the little man.
But the crowd’s laughter turned to total silence as the man clenched his fist around the lemon and six drops fell into the glass. The crowd cheered, the bartender paid the $1,000, and asked the little man, “What do you do for a living? Are you a lumberjack, a weight lifter , or what?”
The man replied, “I work for the IRS.”
Here’s hoping you have positive encounters with the IRS. Haha. Hey, things can’t be all bad. Professional baseball gets going in two weeks, college baseball is in full swing and the Stanley Cup playoffs are right around the corner, but sadly without my Dallas Stars.
All of us at TABR are grateful for the trust and confidence you express in us daily.
Sincerely,

Bob Kargenian, CMT
President
TABR Capital Management, LLC (“TABR”) is an SEC registered investment advisor with its principal place of business in the state of California. TABR and its representatives are in compliance with the current notice filing and registration requirements imposed upon registered investment advisors by those states in which TABR maintains clients. TABR may only transact business in those states in which it is notice filed, or qualifies for an exemption or exclusion from notice filing requirements.
This newsletter is limited to the dissemination of general information pertaining to our investment advisory/management services. Any subsequent, direct communication by TABR with a prospective client shall be conducted by a representative that is either registered or qualifies for an exemption or exclusion from registration in the state where the prospective client resides. For information pertaining to the registration status of TABR, please contact TABR or refer to the Investment Advisor Disclosure web site (www.adviserinfo.sec.gov).
The TABR Model Portfolios are allocated in a range of investments according to TABR’s proprietary investment strategies. TABR’s proprietary investment strategies are allocated amongst individual stocks, bonds, mutual funds, ETFs and other instruments with a view towards income and/or capital appreciation depending on the specific allocation employed by each Model Portfolio. TABR tracks the performance of each Model Portfolio in an actual account that is charged TABR’s investment management fees in the exact manner as would an actual client account. Therefore the performance shown is net of TABR’s investment management fees, and also reflect the deduction of transaction and custodial charges, if any.
Comparison of the TABR Model Portfolios to the Vanguard Total Stock Index Fund, the Vanguard Total International Stock Fund and the Vanguard Total Bond Index Fund is for illustrative purposes only and the volatility of the indices used for comparison may be materially different from the volatility of the TABR Model Portfolios due to varying degrees of diversification and/or other factors.
Past performance of the TABR Model Portfolios may not be indicative of future results and the performance of a specific individual client account may vary substantially from the composite results above in part because client accounts may be allocated among several portfolios. Different types of investments involve varying degrees of risk, and there can be no assurance that any specific investment will be profitable.
The TABR Dividend Strategy presented herein represents back-tested performance results. TABR did not offer the Dividend Strategy as an investment strategy for actual client accounts until September/October 2014. Back-tested performance results are provided solely for informational purposes and are not to be considered investment advice. These figures are hypothetical, prepared with the benefit of hindsight, and have inherent limitations as to their use and relevance. For example, they ignore certain factors such as trade timing, security liquidity, and the fact that economic and market conditions in the future may differ significantly from those in the past. Back-tested performance results reflect prices that are fully adjusted for dividends and other such distributions. The strategy may involve above average portfolio turnover which could negatively impact upon the net after-tax gain experienced by an individual client. Past performance is no indication or guarantee of future results and there can be no assurance the strategy will achieve results similar to those depicted herein.
For additional information about TABR, including fees and services, send for our disclosure statement as set forth on Form ADV from us using the contact information herein. Please read the disclosure statement carefully before you invest or send money.
A list of all recommendations made by TABR within the immediately preceding one year is available upon request at no charge. The sample client experiences described herein are included for illustrative purposes and there can be no assurance that TABR will be able to achieve similar results in comparable situations. No portion of this writing is to be interpreted as a testimonial or endorsement of TABR’s investment advisory services and it is not known whether the clients referenced approve of TABR or its services.