Supply And Demand Is More Important Than Sentiment Or Valuation, But. . .
In last month’s update just prior to Christmas, we put forth the evidence that market breadth was confirming the new highs in stock prices and that based on history, this portended higher prices in coming months. Nothing has taken place to change that view, as it continues to be reinforced.
Since December 22, the S&P 500 has gained 1.62%. That may not seem like much, but on an annualized basis, it is nearly 18% per annum. Global equities have been even stronger, with the Vanguard Total International Stock Fund gaining 5.27% during the same period. Could this be the beginning of a change in fortunes for international stocks, in comparison to U.S. equities?
That’s possible, but we wouldn’t go about guessing. In this area, we are guided by our relative strength rankings, and international equities continue to be at the bottom, while small and mid-cap stocks remain at the top.
Sentiment indicators remain optimistic (which is a contrary indicator) and valuations are among the most expensive in history (see below), but investors (and money managers for that matter) will be best served by ignoring these external indicators and concentrate their focus on the performance of supply and demand.
A Healthier Technical Background Today Than May 2015
In that respect, the stock market is in a better place today than at its previous peak in May 2015, which eventually led to a 14% decline, which terminated in February 2016. To better illustrate this, Doug Ramsey, the Chief Investment Strategist at Leuthold Weeden Capital Management, created a table which compared the S&P 500 to seven different indicators at prior market tops going back to 1990. That table is reproduced below, courtesy of the Leuthold Group.

Ramsey calls this process his Red Flag Indicator. The thinking behind it is that at the vast majority of stock market peaks, there are divergences in the various indicators (as I had mentioned last month). You can see that in the five prior cases since 1990, there has been an average of 6.3 warnings (out of a possible 7). That sends a message that markets are out of sync, and it normally leads to a significant decline.
As the charts below show, which compare the various indicators/indexes from 2014-2015 to 2016-17, we are in a much different situation at present. As of last week, only one of the 7 indicators, the Dow Jones Utilities Average, was not confirming the new highs in stock indexes.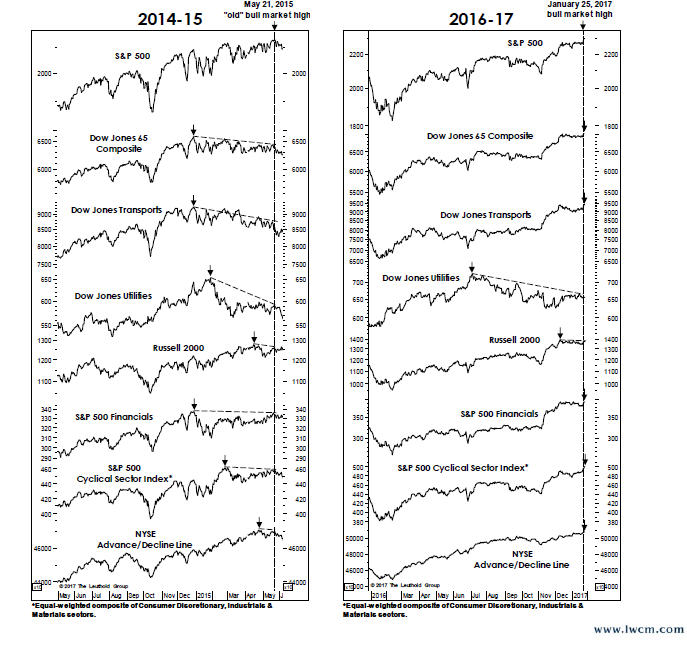
Bottom line, this has bullish implications for the next three to six months, at a minimum. This doesn’t preclude a correction of about 5% beginning at any time. Even if that takes place, though, higher prices are still likely before the end of this bull market.
An Expansion in Psychology
We’ve mentioned several times in the past 24 months (maybe longer) that stock prices were expensive relative to history, using several different metrics, from dividend yields, price to earnings, capitalization to GDP (gross domestic product) and price to sales, to name a few. The chart below, courtesy of Ned Davis Research, is a great illustration of what has taken place the past few years. It depicts the price/sales ratio of the S&P 500, using quarterly data going back to 1954.

The current ratio of 1.90 has only been exceeded one time in the past 60 years, and that was at the market peak of 1999-2000. But, let’s take a look at what has happened to sales in comparison to prices. Sales, as shown in the table in the upper right portion of the chart, have only increased since 2012 by 6.4%, yet the S&P 500 Index during that same period has gained 74%.
So, sales growth is not supporting the expansion in prices, nor is earnings growth. What’s taken place is that investors have been willing to pay a higher price for the same amount of sales. This is all driven by psychology, and certainly some would argue that it has been facilitated by the zero interest rate policy that the Federal Reserve has pursued for the past 7 to 8 years.
In looking at this chart, it might be easy to conclude that something has changed since around 1997. Prior to 1997, the ratio vacillated from about 1.24 to as low as about 0.40. But since 1997, it has only been below 1.24 for a few years, mostly because of the collapse in stocks during the 2007-2009 bear market.
It might be tempting to conclude that “this time it’s different,” and that we’re in a new era of elevated valuations that will go on for many years. Anything is possible, which is why we favor technicals over fundamentals, but I would be quite cautious about assuming that conclusion. Rather, I agree with the comments from Howard Marks of Oaktree Capital, in his book, “The Most Important Thing.”
Marks said, “Ignoring cycles and extrapolating trends is one of the most dangerous things an investor can do. People often act as if companies that are doing well will do well forever, and investments that are outperforming will outperform forever, and vice versa. Instead, it’s the opposite that’s more likely to be true.
“The next time you’re approached with a deal predicated on cycles having ceased to occur, remember that invariably that’s a losing bet.”
Fidelity Tax Documents
Yes, it’s that time of year again. We just wanted to remind you that the first mailing of 1099 forms was mailed (and posted online) on January 28. They will do a second mailing on February 18 that will include information that was not available at the first deadline. There is a final mailing on March 4 for situations where information was not available at the earlier deadlines.
Our recommendation would be to make any tax appointments with your CPA after February 18, so you’re not having to come back to them with additional data. As always, if you need something in this area and don’t have it, don’t hesitate to call our office and speak with Mary or Sylvia. Sometimes, we have access to this information before you do.
Investment Allocations Update
With the weekly data ending December 30, our risk model for high yield bond funds turned positive, so on the first trading day of 2017, our accounts moved to an approximate 80/20 over-weight position in high yield, in comparison to short duration bond funds. Prices are up about 1.25% since then, so there has been decent follow-through thus far, but we’re not expecting a repeat of the February 2016 BUY signal, which led to an approximate gain of over 12%.
In many ways, bonds are just as expensive as stocks, but our process and trend-following model demands that we be heavily invested. In stocks, most of our risk models are positive, and exposure is at about 63%, which we consider to be moderately positive. We are looking to get to 70% on some weakness.
I also wanted to announce that for now, we’ve suspended our allocations to real estate, where we’ve either used a real estate mutual fund or a real estate ETF, such as the Dow Jones Real Estate Index (IYR). We’ve been studying some research in this area, along with on-going research we’ve maintained on sector investing. At present, we’re not convinced that our model for this area is adding enough value above and beyond buy and hold for the diversification benefits.
As a result, we’ve just shifted the real estate allocation within portfolios to our broad-based equity exposure. Real estate represented 3% in Conservative accounts, 5% in Moderate accounts and 7% in Aggressive accounts. A lot of times, simple is better. Though this was not part of our decision process, I might add that in real estate, cap rates are extremely low, which means real estate is quite expensive, both on the commercial side and residential side.
Material of A Less Serious Nature
An older couple recently learned how to send text messages on their mobile phones. One afternoon, the wife went out to meet a friend for coffee. The two ladies got to talking about their husbands and decided to up the romance levels in their relationships.
Capitalizing on her new skill, the wife decided to send her husband a romantic text message: “If you are sleeping, send me your dreams. If you are laughing, send me your smile. If you are eating, send me a bite. If you are drinking, send me a sip. If you are crying, send me your tears. I love you.”
After a few minutes, the husband texted her back:
“I’m on the toilet. Please advise.”
As always, thanks for your continued trust and confidence in all of us at TABR. As the Chinese proverb states, we are certainly living in interesting times.
Sincerely,

Bob Kargenian, CMT
President
TABR Capital Management, LLC (“TABR”) is an SEC registered investment advisor with its principal place of business in the state of California. TABR and its representatives are in compliance with the current notice filing and registration requirements imposed upon registered investment advisors by those states in which TABR maintains clients. TABR may only transact business in those states in which it is notice filed, or qualifies for an exemption or exclusion from notice filing requirements.
This newsletter is limited to the dissemination of general information pertaining to our investment advisory/management services. Any subsequent, direct communication by TABR with a prospective client shall be conducted by a representative that is either registered or qualifies for an exemption or exclusion from registration in the state where the prospective client resides. For information pertaining to the registration status of TABR, please contact TABR or refer to the Investment Advisor Disclosure web site (www.adviserinfo.sec.gov).
The TABR Model Portfolios are allocated in a range of investments according to TABR’s proprietary investment strategies. TABR’s proprietary investment strategies are allocated amongst individual stocks, bonds, mutual funds, ETFs and other instruments with a view towards income and/or capital appreciation depending on the specific allocation employed by each Model Portfolio. TABR tracks the performance of each Model Portfolio in an actual account that is charged TABR’s investment management fees in the exact manner as would an actual client account. Therefore the performance shown is net of TABR’s investment management fees, and also reflect the deduction of transaction and custodial charges, if any.
Comparison of the TABR Model Portfolios to the Vanguard Total Stock Index Fund, the Vanguard Total International Stock Fund and the Vanguard Total Bond Index Fund is for illustrative purposes only and the volatility of the indices used for comparison may be materially different from the volatility of the TABR Model Portfolios due to varying degrees of diversification and/or other factors.
Past performance of the TABR Model Portfolios may not be indicative of future results and the performance of a specific individual client account may vary substantially from the composite results above in part because client accounts may be allocated among several portfolios. Different types of investments involve varying degrees of risk, and there can be no assurance that any specific investment will be profitable.
The TABR Dividend Strategy presented herein represents back-tested performance results. TABR did not offer the Dividend Strategy as an investment strategy for actual client accounts until September/October 2014. Back-tested performance results are provided solely for informational purposes and are not to be considered investment advice. These figures are hypothetical, prepared with the benefit of hindsight, and have inherent limitations as to their use and relevance. For example, they ignore certain factors such as trade timing, security liquidity, and the fact that economic and market conditions in the future may differ significantly from those in the past. Back-tested performance results reflect prices that are fully adjusted for dividends and other such distributions. The strategy may involve above average portfolio turnover which could negatively impact upon the net after-tax gain experienced by an individual client. Past performance is no indication or guarantee of future results and there can be no assurance the strategy will achieve results similar to those depicted herein.
For additional information about TABR, including fees and services, send for our disclosure statement as set forth on Form ADV from us using the contact information herein. Please read the disclosure statement carefully before you invest or send money.
A list of all recommendations made by TABR within the immediately preceding one year is available upon request at no charge. The sample client experiences described herein are included for illustrative purposes and there can be no assurance that TABR will be able to achieve similar results in comparable situations. No portion of this writing is to be interpreted as a testimonial or endorsement of TABR’s investment advisory services and it is not known whether the clients referenced approve of TABR or its services.