The Ins & Outs of 529 College Plans, And Beware Of Ratios
In this edition of our quarterly newsletter, we’re going to tackle the majority of the key points when considering investing in a 529 College Plan account. In addition, we have what we hope is an enlightening piece on the use of ratios when examining financial markets.
529 College Savings Plans—What You Should Know
Back in 1996, qualified tuition programs, or more commonly known as 529 plans, were created under the Small Business Job Protection Act as a means of allowing taxpayers to save for college expenses for a designated beneficiary. Many states offer these plans, but you’re not obligated to use your state plan, as it depends on whether there is any advantage in doing so.
There are actually two types of plans—prepaid tuition plans and savings plans. Only a handful of states offer the prepaid plans, which allow one to lock in the current costs of tuition, since future prices have generally been rising every year. They aren’t nearly as popular because they have two distinct drawbacks. First, the money can only be applied to tuition and fees at in-state public colleges and universities. Second, room, board, books and other expenses aren’t covered.
Just for those reasons, prepaid plans aren’t a good choice. How are you going to know where your son or daughter is going to college when they are in their formative years? I certainly don’t think either my wife or I expected that our son would be going to New York University, even when he was in high school in Yorba Linda.
The savings plans allow families to invest in preselected investment portfolios that grow or decrease in sync with the financial markets. Almost all plans today offer age-based options which decrease risk as the beneficiary ages and gets closer to enrollment when withdrawals would begin. In addition, one can customize their allocation to their own risk tolerance. More on that later.
One of the main benefits of 529 plans is that the account grows tax-free, and when you withdraw funds to pay for qualified expenses, there are no taxes on the gains made. If you start saving when a child is young, this tax advantage can mean saving thousands of dollars in comparison to an account which has to pay taxes along the way.
Eligible institutions include most accredited colleges and graduate schools, including professional and trade schools. Though we tend to think of these plans for our kids or grandkids, they can also be used for yourself. Say you have a bachelor’s degree when you’re 22 and go into the workforce for many years, and then realize when you are 30 that a master’s degree would greatly improve your career path. Funding a 529 plan along the way, or keeping one open where all the funds had not been exhausted could be used to fund grad school.
What Can The Funds Be Used For?
When the money is withdrawn, it can be used for “qualified, college-related expenses.” This would include tuition, room and board, meal plans, computers and internet service. As a general rule of thumb, if you are required to have something as part of your college education, you can likely use 529 funds to purchase it. However, this doesn’t include cell phones, cell phone plans or transportation expenses to and from school.
In State Versus Out Of State Plans
Keep in mind that contributions to a 529 plan are not deductible for tax purposes at the federal level, but that more than 30 states provide tax deductions or tax credits for contributions. For example, California does not offer any benefit for using their state plan, so we use the College America Plan from the State of Virginia for all of our California clients, since it is run by American Funds, which has a combination of some of the lowest expense funds and best long-term performance in the industry.
On the other hand, the state of New York offers up to a $10,000 annual deduction, Oklahoma offers up to $20,000 for a married couple and Pennsylvania offers up to a $28,000 per-beneficiary deduction. Some states require that you use their plan in order to claim the deduction, but others do not.
Some Administrative Things To Be Aware Of
Only one person can be the owner of an account, and there can only be one beneficiary, but you can designate a contingent owner (such as a spouse). One common question we get is this—what if my child doesn’t go to college? What happens to the money?
First, if that were to happen, and the couple has more than one child, the beneficiary can be changed to the other child, and even to a niece or nephew. In the worst case scenario, if the funds are never used for college, the owner could close the account and they would have to pay taxes on the gains, along with a 10% penalty.
For instance, say a couple had contributed $50,000 to their daughter’s account and it had grown to $70,000 by the end of high school, but the daughter never attends college. The couple (again, only one spouse can be an owner) would pay taxes on the $20,000 of gains (treated just like ordinary income) plus a 10% penalty on those gains.
You can contribute up to $14,000 per year, which qualifies for the federal gift tax exclusion, so a couple could contribute up to $28,000 annually. Under special rules just for 529 plans, you can gift a lump sum of up to $70,000 (and avoid federal gift tax), provided you make an election to spread the gift over five years.
Most states have maximum limits to these plans, which typically range from $300,000 to $500,000 per beneficiary. Once those limits are reached, no further contributions are permitted. Keep in mind that people other than the account owner can contribute to the plan, and there are no income restrictions on who can own or contribute to a plan. For instance, we have several instances where grandparents have established plans with us for their grandchildren, and they are funding the plans with their own savings.
529 Plans And Financial Aid
When it comes to financial aid, not all 529 plans are treated equally. Much depends on who actually owns the 529 plan. According to the U.S. Department of Education, every dollar stored in a 529 account in a parent’s name will subtract up to 5.6% from your families need-based financial aid package.
However, if the 529 plans are held by grandma or grandpa, they won’t appear on the FAFSA (Free Application for Federal Student Aid). As that money is withdrawn to pay for college expenses, those amounts must be reported on the following year’s financial aid forms as untaxed income to the student, and it can reduce the amount of aid by up to 50%. To avoid that potential situation, the grandparents could transfer that ownership before college to the parents, if such transfers are allowed by the state.
We found that seven states have ownership transfer restrictions—Arizona, Delaware, Louisiana, Massachusetts, New Hampshire, New York and Tennessee. And frankly, it is not a slam dunk that all grandparents would want to give up control of the money, either to the parents or the student. Each situation should be evaluated with its own merits.
Though this sounds onerous, I wouldn’t let it be an obstacle to using a 529 plan. The reality is, many of the people who are able to save for college have incomes that typically make it difficult to qualify for financial aid. But I don’t think qualifying for financial aid is the goal. Rather, I think the best combination is to save, and apply for merit based scholarships. Even the most expensive private colleges offer merit scholarships, often to students of parents who have substantial incomes. These days, graduating from college in four years with no debt is one of the best outcomes one can imagine.
Not All Plans Are Created Equal
In this realm, there are plans that are sold directly to the public, such as New York and Pennyslyvania’s plans, and others which are sold through financial advisors. Fees, expenses and commissions can vary considerably, as I discovered in examining just three different plans.
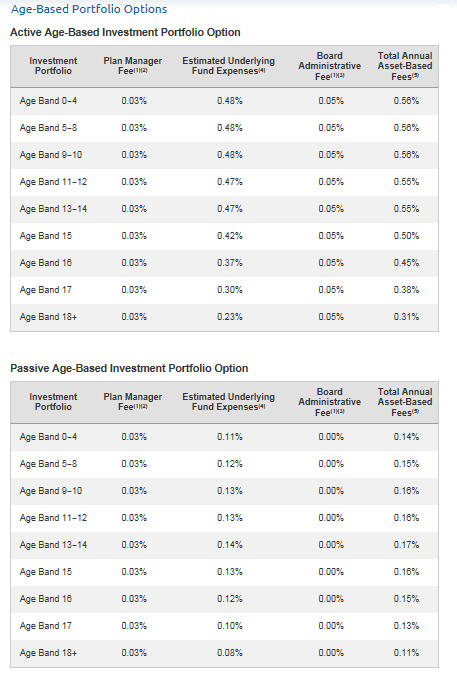
For instance, the California plan uses TIAA-CREF for the advisory firm (or mutual fund firm, if you wish). The plan offers active portfolio options, passive portfolio options, a guaranteed return option, and both active and passive age-based options. This plan is sold directly to consumers, and has fund expense ratios which range from 13 basis points (bps) to 56 bps. Some of these options are shown below.
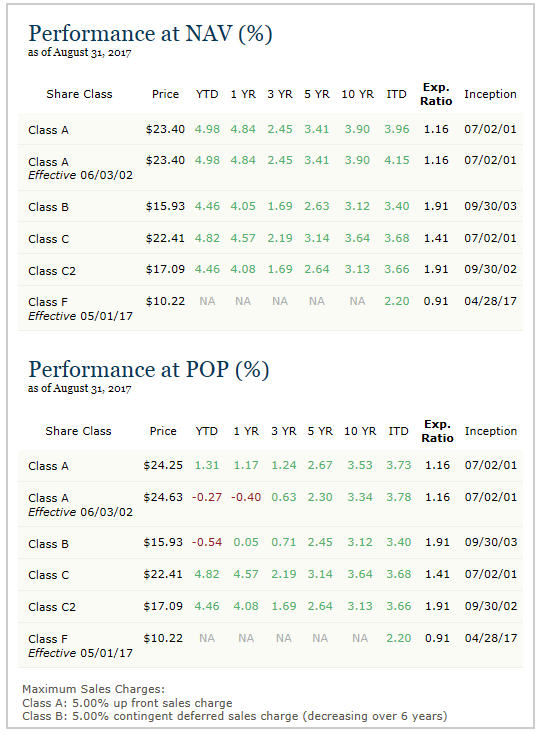
On the high extreme is the John Hancock Freedom Plan, which is sold by financial advisors who receive commissions, and therefore are not fiduciaries under the law. This plan has portfolio options which include funds from different companies, such as T. Rowe Price, John Hancock, Oppenheimer and American Funds. Below is a breakdown of the expenses of the various share classes Hancock offers for their College Portfolio, one of four different investment options they provide.
As you can see, the expenses range from 91 bps to 191 bps. The Class A, B and C shares also have sales commissions related to them, on top of the fund expenses. Only in May of 2017 did Hancock introduce Class F shares, which are sold by fee-based advisors and have no sales commissions or distribution fees.
In the middle is the State of Virginia plan, which is advised by American Funds, which we’ve referred to above (they are also known as the Capital Group, are based in Los Angeles, and are the 3rd largest money manager in the industry, behind only Fidelity and Vanguard).
The Virginia plan is also sold by advisors, some of whom receive commissions, and some who don’t (like us at TABR). Much like with Hancock, what you pay depends heavily on the type of advisor one is working with, and the share class that is used. For instance, for their College Date Target Series 2021 (for students beginning college enrollment in 2021), look at the annual fees that the portfolios charge for their 5 different shares classes:
A shares 0.71%
B shares 1.49%
C shares 1.50%
E shares 0.97%
F-1 shares 0.50%
The A shares also come with an up-front commission that can be as large as 5.25% of every dollar contributed. B and C shares are sold with no up-front commission, but have deferred sales charges which can typically last from one year to five years. B shares are almost extinct now, and given the focus on fiduciary status, I expect C shares to eventually go that route as well. As a fee-only advisor and acknowledged fiduciary, we are able to use the F-1 shares for our clients.
Probably the biggest complaint I have against American Funds is that they have 17 different share classes (and there are a number of fund companies like them). This is caused by a regulatory environment that favors different types of assets over others (retirement plan assets vs after-tax, as example), and has different forms of compensation, depending on the type of advisor.
Though I will not go into it here, since it is off-topic, last week the Office Of Management and Budget proposed that the Department of Labor’s Fiduciary rule governing financial advisors be postponed until at least July 2019. The relevance of being a fiduciary, and doing what’s in the best interests of clients, has never been greater.
Investment Choices and Strategy
The conventional wisdom as to how to allocate funds between stocks and bonds for a college 529 plan seems to be that the farther away the college enrollment date is, the higher percentage should be in stocks. Simply put, a 2-year old has 16 years to grow the money, but a 12-year old only has 6. As a result, age-based options now seem to be available in almost every plan for those that don’t want to do much analysis.
For example, below are the allocations for the American Funds College Target Date Series, as of March 2016:
| Name of Series | Growth | Growth & Income | Balanced | Bonds |
| AmericanFunds College 2033 Fund | 18.5% | 65.5% | 3% | 13% |
| American Funds College 2030 Fund | 12.8% | 50.6% | 10% | 22.6% |
| American Funds College 2027 Fund | 6.4% | 42.5% | 11.9% | 39.2% |
| American Funds College 2024 Fund | 0% | 31.3% | 17.2% | 51.5% |
| American Funds College 2021 Fund | 0% | 13.2% | 15.4% | 71.4% |
| American Funds College 2018 Fund | 0% | 0% | 7.1% | 92.9% |
| American Funds College Enrollment Fund | 0% | 0% | 0% | 100% |
You can see from the table that for a 2-year old in the 2033 Fund, the stock allocation is around 84%, but for a senior in high school who will be starting college next August or September, the College 2018 Fund is about 96% in bonds. Follow along with the logic here. If the student is either starting college now or will next year, and the parents or grandparents have diligently saved for maybe as long as 16 years and amassed $50,000 or $100,000 or even $200,000 or more, I don’t know many that would be thrilled with a 20% or greater stock market decline right when the money is starting to be used.
Consider if one was in a 50/50 stock/bond allocation, and stocks declined 25%, and the balance in the account was $100,000 prior to the decline. Assuming the bond portion contributed 0-3%, the stock portion would cause a 12.5% decline in the overall account, so one would be looking at dollar losses of about $11,000. Obviously, if the account was $200,000, those losses would be double that. Depending on the college, that could represent nearly two years worth of tuition (UCLA at $12,900 per year), or not even one semester (NYU at over $46,000 per year). Could you handle that, knowing you have a fixed expense?
If the answer is no, a heavy bond allocation is absolutely essential, even though you are giving up the upside in markets if they happen to do well. For our part, we’ve been using a customized allocation for clients since 2010 when we began to establish accounts. We’re not necessarily in sync with the thought that one should be heavy in stocks when kids are 1-5 years old. We actually prefer a more balanced approach, for a smoother ride. We initially began using the following mix:
American Balanced Fund 60%
Growth Fund of America 20%
Bond Fund of America 20%
This was in order to achieve the traditional mix of 60% stocks and 40% bonds. Several years ago, American Balanced had about 65% of its portfolio in stocks, which gave us 39%, plus the 20% in Bond Fund of America, and presto, we have our near 60/40 mix. In the past two years, we’ve altered this mix to 50/50, because of rising stock market valuations, and now have reduced American Balanced to 50% and increased Bond Fund of America to 30%. But, within our client mix, we have accounts with beneficiaries ranging from 1 year old to 15.
Per the matrix above, a 15-year old should likely have at least 80% in bonds. The formulas are certainly helpful, but ultimately, we have conversations with each client about how much risk they are comfortable with and tailor the mix to those wishes. Everyone is different. Even though 2008 may have been the largest decline in about 75 years for the stock market, anything can happen at any time, so we think talking about those scenarios is important.
It is certainly plausible that a 12-year old could have $200,000 in an account, so what if there was a 38% decline in stocks like 2008 and it wiped out 19% of the account, or $38,000 (assuming a 50/50 stock/bond mix)? There is certainly time to recover that, and history shows that it likely would happen prior to six years. But, some people don’t want to go through that. At $200,000, even with a child at 12 and six years to go, they might say, “you know what, we are almost fully funded, I don’t want to see hardly any of this disappear, let’s move to 90% bonds.” And the only way to know that is to have a conversation—something that a robot or mathematical algorithm can’t do.
Other Options—Coverdell ESA And UTMA Accounts
I’m going to spend very little time in this area, since my intent was to educate on the intricacies of 529 college plans. There are three other methods one can consider for college savings.
Education Savings Accounts (ESA) were introduced in 1997, and have many features similar to a 529, including tax-free growth. The definition of qualified institutions however include primary and secondary schools, not just college.
The big problem, though, is that the contribution limit is $2000 per year, and there are income limits for donors (95 to 110K for singles, 190 to 220K for couples). In my view, these are a waste and should be eliminated. How could one possibly make a dent in college savings by putting away $2000 per year? Don’t get me started. Why should IRA contributions be limited to $6500 (for people with no company retirement plan), yet a worker who has a 401 (k) can put away up to $24,000? Why are there 457 plans, 403 (b) plans and 401 (a) plans, not to mention 401 (k) plans? As I said, don’t get me started.
UTMA Accounts (Uniform Transfer to Minors Act) are types of custodial accounts that are set up by an adult on behalf of a minor. There is more flexibility with these accounts, since they are set up at a bank or brokerage, and the money can be invested in a wide variety of assets, just like an IRA brokerage or taxable brokerage account. By the way, these can also be known as UGMA Accounts (Uniform Gifts to Minors Act).
A couple of big differences with UTMA’s is that the income produced is taxed to the child, and ultimately, the funds and control of the account are turned over to the child at 18 or 21, depending on the state. Unlike a 529 plan, funds in an UTMA can be used for anything that benefits the child, such as a new car. They are not restricted to college expenses. However, they are less favorable regarding financial aid packages since the government uses 20% in the formula instead of 5.6%, as noted above.
Regarding the transferability rules, it used to be that parents would tell us that they wouldn’t even tell their kids about the accounts, therefore they wouldn’t give up control when they reached 21. However, most financial institutions are enforcing the law these days, so as a parent, I wouldn’t count on “hiding” assets from your kids.
Finally, there is another option that I did not mention in the headline. That would be to establish an irrevocable trust for your child. This is costly, usually about $2000 or a bit more, and the trust would have its own ID number, and a trust tax return would need to be filed each year. But, it allows parents or others to establish a set of rules as to how funds would be disbursed over time, perhaps with different incentives, or ages attained. There is also a lot of flexibility in that language can be used so that funds can be used for anything.
When our son Adam was born in 1994, only UTMA accounts existed. And frankly, 529 plans in the early years were terribly designed. We did fund Coverdell accounts through the backdoor, by gifting $2000 to my Mom and then having her fund the account, but ultimately found that to be a pain in the rear. Ultimately, in 2000 we created a custom irrevocable trust for our son and did the same for our daughter in 2005. They’re not for everybody, but we do have a few clients who have followed this path as well.
Don’t Fall In Love And Totally Rely on Ratios
Today, perhaps thanks to the internet and the ease of finding information, there are a lot less unknowns compared to say 20 years ago, when it comes to financial market research. Recently, it seems like not a week goes by without seeing a story on how expensive the stock market is, relative to history, using price to earnings ratios, or price to sales, or price to dividends, for example.
In fact, in TABR’s July monthly update, I featured a chart of Robert Shiller’s CAPE (cyclically adjusted price earnings) ratio, which showed that since 1926, only once have stocks been priced more expensively than today, and that was in the 1999-2000 period known as the technology bubble.
No doubt you’ve heard the saying that goes something like this—“those that don’t know history are doomed to repeat it.” I certainly think that having historical context is helpful from a risk perspective, but I think one can get into trouble by assuming that data is always going to mean revert, because it has in the past. What made me think of this is what’s been happening with gold and gold stocks these past 9 years.
To illustrate this, below is a monthly chart going back to 1984 of the Gold/XAU ratio. That is, the price of gold each day, divided by the XAU, which is an index of precious metals mining companies which is traded on the Philadelphia Stock Exchange. The chart is courtesy of www.stockcharts.com.
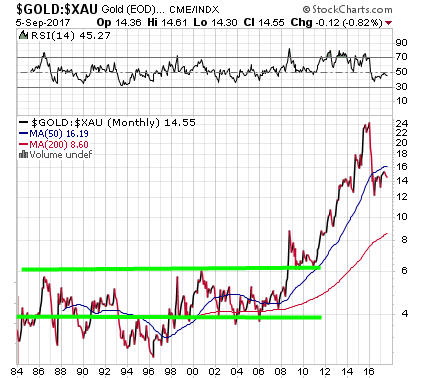
You can see from the chart that from 1984 to 2008, the ratio was mostly bound between 4 and 6, though there was a lengthy period from about 1993 to 1998 where it stayed below 4. In the early 2000s, we came across a trading system where the rules were quite simple—you bought gold stocks when the ratio was greater than 4 to 1, and sold them when the ratio was less than 4 to 1. This was backed up by a study that money manager John Hussman had published in the late 1990s where he indicated that the XAU had advanced at a 24.8% compound rate when the ratio was above 4 to 1, but had an annualized loss of over -13% when the ratio was below 4.
Though these levels are not shown on the ratio chart, let me give some perspective with the ups and downs of the XAU Index. Historical data goes back to December 1983.
December 19, 1983 107.06
December 29, 2000 51.41
December 31, 2007 173.32
January 19, 2016 38.84
September 1, 2017 90.54
Yes, that’s correct—the index is below where it was nearly 34 years ago. Yet, there have been some significant moves, both up and down. In the 7 years ending December 2007, the index compounded at 19% per year, but then has lost almost -17% annually to its more recent bottom in January 2016. Notice what happened to the ratio, though in 2008.
It crossed above 6, where it had NEVER been before, and ultimately peaked above 24 in January 2016, before receding to its current level at 14.69. What happened? Markets changed. If you were relying on data that told you gold stocks were cheap when the ratio was 6 to 1, you would have been sucked into a trade where ultimately, gold stocks fell over -75%.
My message in bringing this up goes back to the notion that one needs to be very careful with fundamental analysis and the history of valuations when it comes to looking at stock market valuations or even the trend of interest rates. Yields have gone lower than most people thought possible. Maybe price earnings ratios will stay elevated for years. We don’t know. We think stocks are expensive relative to history, but we don’t know. Markets change.
This is why we think it’s important to use a process that is dynamic. Hence, our emphasis on the use of technical analysis with quantitative data and risk management models which are not dependent on the use of fundamental valuation ratios.
Back From Summer
Early September means school is resuming, and that’s certainly the case for our daughter, Caroline, who begins the 7th grade today. Unlike those star college freshman basketball players who join the NBA after one year, the Kargenian family is not one and done. More like, one down and years to go. Below is a recent snapshot of Caroline at our favorite breakfast joint, The Original Pancake House. Dad is already prepping her for college with a cup of coffee (not!).

As always, we very much appreciate the trust and confidence you place in all of us at TABR.
Sincerely,

Bob Kargenian, CMT
President
TABR Capital Management, LLC (“TABR”) is an SEC registered investment advisor with its principal place of business in the state of California. TABR and its representatives are in compliance with the current notice filing and registration requirements imposed upon registered investment advisors by those states in which TABR maintains clients. TABR may only transact business in those states in which it is notice filed, or qualifies for an exemption or exclusion from notice filing requirements.
This newsletter is limited to the dissemination of general information pertaining to our investment advisory/management services. Any subsequent, direct communication by TABR with a prospective client shall be conducted by a representative that is either registered or qualifies for an exemption or exclusion from registration in the state where the prospective client resides. For information pertaining to the registration status of TABR, please contact TABR or refer to the Investment Advisor Disclosure web site (www.adviserinfo.sec.gov).
The TABR Model Portfolios are allocated in a range of investments according to TABR’s proprietary investment strategies. TABR’s proprietary investment strategies are allocated amongst individual stocks, bonds, mutual funds, ETFs and other instruments with a view towards income and/or capital appreciation depending on the specific allocation employed by each Model Portfolio. TABR tracks the performance of each Model Portfolio in an actual account that is charged TABR’s investment management fees in the exact manner as would an actual client account. Therefore the performance shown is net of TABR’s investment management fees, and also reflect the deduction of transaction and custodial charges, if any.
Comparison of the TABR Model Portfolios to the Vanguard Total Stock Index Fund, the Vanguard Total International Stock Fund and the Vanguard Total Bond Index Fund is for illustrative purposes only and the volatility of the indices used for comparison may be materially different from the volatility of the TABR Model Portfolios due to varying degrees of diversification and/or other factors.
Past performance of the TABR Model Portfolios may not be indicative of future results and the performance of a specific individual client account may vary substantially from the composite results above in part because client accounts may be allocated among several portfolios. Different types of investments involve varying degrees of risk, and there can be no assurance that any specific investment will be profitable.
The TABR Dividend Strategy presented herein represents back-tested performance results. TABR did not offer the Dividend Strategy as an investment strategy for actual client accounts until September/October 2014. Back-tested performance results are provided solely for informational purposes and are not to be considered investment advice. These figures are hypothetical, prepared with the benefit of hindsight, and have inherent limitations as to their use and relevance. For example, they ignore certain factors such as trade timing, security liquidity, and the fact that economic and market conditions in the future may differ significantly from those in the past. Back-tested performance results reflect prices that are fully adjusted for dividends and other such distributions. The strategy may involve above average portfolio turnover which could negatively impact upon the net after-tax gain experienced by an individual client. Past performance is no indication or guarantee of future results and there can be no assurance the strategy will achieve results similar to those depicted herein.
For additional information about TABR, including fees and services, send for our disclosure statement as set forth on Form ADV from us using the contact information herein. Please read the disclosure statement carefully before you invest or send money.
A list of all recommendations made by TABR within the immediately preceding one year is available upon request at no charge. The sample client experiences described herein are included for illustrative purposes and there can be no assurance that TABR will be able to achieve similar results in comparable situations. No portion of this writing is to be interpreted as a testimonial or endorsement of TABR’s investment advisory services and it is not known whether the clients referenced approve of TABR or its services.