Monthly Update February 2015
CONCLUSION—Trading Range, But Mostly Bullish Until Proven Otherwise
Most stock indexes were down about -3% in January, and this brought out the chorus of “as January goes, so goes the rest of the year.” But that calendar anomaly has not worked in recent years, and here we are, two weeks into Febuary, and the losses have been replaced with slight gains.
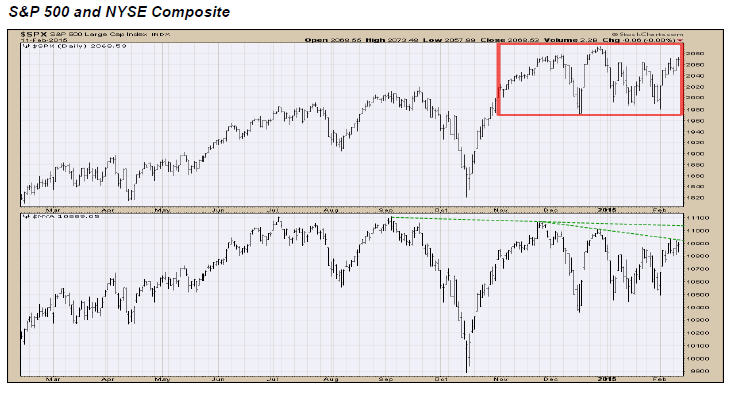 As the chart above illustrates, courtesy of Walter Murphy’s Insights, stock markets have been in a fairly narrow trading range since early November. In the case of the S&P 500 (red rectangle), the range has been from about 1950 to 2095, or just over 7%, and we are currently at the top of the range now, with the index closing at a new high on Friday, February 13. The index is just 1% higher than its November 26 closing value, but there has been quite a bit of up/down movement as one can see from the chart. In my comment last month about expecting more volatility, during the first five weeks of 2015, the average daily change in the S&P 500 was nearly double that of 2014, 0.94% to 0.52%.
At some point, stocks will break out of this range, either higher or lower, but there is no definitive way to know in which direction. Some divergences are present, as most indexes have not made new highs, and there has been a steep drop the past two weeks in the Dow Jones Utility Average, but advance/decline lines have mostly been confirming price action, suggesting price highs later, rather than sooner. A few days ago, Ned Davis Research noted that the S&P 500 Index has gone 815 trading days (since October 2011) without a 10% correction. One certainly seems overdue, but in the 1990s, stocks went seven years without a 10% pullback. One never knows. All in all, the tape suggests above average exposure and that is what we have (see below). A major stock market decline, which is usually associated with a recession, seems remote at the moment. But, there is something to keep watch on.
The Threat of Deflation
Last month we featured a chart on the plunge in the price of oil. Some European countries have negative interest rates. This is implying a weak economic backdrop in much of the world. Inflation is subdued in the United States as well, registering under the 2% target from the Federal Reserve Board. Below is a chart of the Reuters/Jefferies CRB Index (from www.stockcharts.com), which is representative of a broad base of commodities, including oil, gold, coffee, and agricultural products such as corn and soybeans.
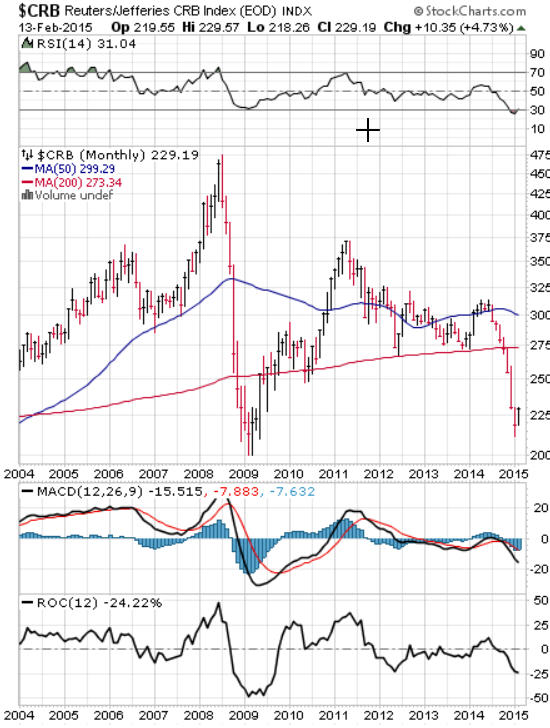
As one can see, prices have approached the bottom in 2009 near the 200 level. Oil has already enjoyed a decent rally from its recent low, so it is possible that commodity prices may be near an important, long term bottom. But, if this index were to break below the 200 level and continue south, deflation issues would move to the forefront.
Portfolio Allocations
Our tactical equity allocations have been at least at 70% for all but 3 days thus far in 2015, and that is where they stand at present. This is above average exposure, and under normal conditions, would be even higher. Our risk model for real estate continues in its bullish mode since early last year, but we are getting mixed messages from our bond models. When models are positive, one of our two biggest bond allocations is to the Loomis Sayles Bond Fund, which is a multi-sector fund. Much of the time, it acts like a corporate high yield bond fund. Since December 15, two of the three models we use for this fund have been negative, and on January 21, the last one kicked in, so we currently have no exposure in the fund. The proceeds are now 1/3 invested in PIMCO Total Return and 2/3 in Loomis Sayles Limited Term Maturity (or in cash with certain accounts).
In contrast to this, our risk model for high yield corporate bonds funds turned positive a week ago, the first time since August 1. We are now 90% over-weight in high yield and 10% in short term funds with that allocation, while our GNMA model remains positive. Normally, when our high yield model is in a positive mode, it tends to bode well for stocks, so we’ll see if there is follow through.
Material of a Less Serious Nature
A Grandfather’s Patience
A woman in a supermarket is following a grandfather and his badly behaved 3-year-old grandson. It’s obvious to
her that he has his hands full with the child screaming for candy in the candy aisle, cookies in the cookie aisle and for fruit, cereal and soda in the other aisles. Meanwhile, Grandpa is working his way around, saying in a controlled voice, “Easy William, we won’t be long . . . easy, boy.”
Another outburst and she hears the grandpa calmly say:
“It’s okay, William, just a couple more minutes and we’ll be out of here. Hang in there, boy”
At the checkout, the little terror is throwing items out of the cart and Grandpa says again in a controlled voice, “William, William, relax buddy, don’t get upset. We’ll be home in five minutes, stay cool, William.”
Very impressed, the woman goes outside where the grandfather is loading his groceries and the boy into the car.
She says to the elderly man, “It’s none of my business, but you were amazing in there. I don’t know how you did it. That whole time you kept your composure, and no matter how loud and disruptive he got, you just calmly kept saying ‘things would be okay.’ William is very lucky to have you as his grandpa.”
“Thanks”, said the grandpa, “but, I’m William. The little fart’s name is Kevin.”
Here’s hoping you had a terrific Valentine’s Day. Our princess Caroline is now officially 10—wow, how time flies. And, it’s a reminder that parts of my curly hair are turning Fifty Shades of Grey. Ha!
Sincerely,
Bob Kargenian, CMT
TABR Capital Management, LLC(“TABR”) is an SEC registered investment advisor with its principal place of business in the state of California. TABR and its representatives are in compliance with the current registration and notice filing requirements imposed upon registered investment advisors by those states in which TABR maintains clients. TABR may only transact business in those states in which it is notice filed, or qualifies for an exemption or exclusion from notice filing requirements.
This newsletter is limited to the dissemination of general information pertaining to our investment advisory/management services. Any subsequent, direct communication by TABR with a prospective client shall be conducted by a representative that is either registered or qualifies for an exemption or exclusion from registration in the state where the prospective client resides. For information pertaining to the registration status of TABR, please contact TABR or refer to the Investment Advisor Disclosure web site(www.adviserinfo.sec.gov.).
For additional information about TABR, including fees and services, send for our disclosure brochure as set forth on Form ADV from us using the contact information herein. Please read the disclosure brochure carefully before you invest or send money.
The results of TABR’s Model Portfolios are net of actual fees deducted from client accounts and include the reinvestment of dividends and other earnings. Comparison of the TABR Model Portfolios to other indices is for illustrative purposes only and the volatility of the indices used for comparison may be materially different from the volatility of the TABR Model Portfolios due to varying degrees of diversification and/or other factors. The returns noted of various market indices include reinvested dividends unless otherwise noted.
Comparison of the TABR Model Portfolios to the Vanguard Total Stock Index Fund, the Vanguard Total International Stock Fund and the Vanguard Total Bond Index is for illustrative purposes only and the volatility of the indices used for comparison may be materially different from the volatility of the TABR Model Portfolios due to varying degrees of diversification and/or other factors.
Past performance of the TABR Model Portfolios may not be indicative of future results and the performance of a specific individual client account may vary substantially from the model results above in part because client accounts may be allocated among several portfolios or have substantial cash flow in or out of the account. Different types of investments involve varying degrees of risk, and there can be no assurance that any specific investment will be profitable.
This newsletter contains general information that is not suitable for everyone. The information contained herein should not be construed as personalized investment advice. There is no guarantee that the views and opinions expressed in this newsletter will come to pass. Investing in the stock market involves gains and losses and may not be suitable for all investors. Information presented herein is subject to change without notice and should not be considered as a solicitation to buy or sell any security.
A list of all recommendations made by TABR within the immediately preceding one year is available upon request at no charge.