What Higher Inflation Means For Stocks, And Other Assets
After being an afterthought for the last 20 years at mostly under 2.5% annualized, inflation is dominating our lives in many areas, from gas prices to food to homeowners insurance (basic materials) and beyond, including wages. In simple terms, inflation is too much money chasing too few goods. It’s certainly more complicated than that.
However, we all need to recognize there’s another phenomenon going on, but it’s not recent. No, it’s been going on since 2009, some 12 years and running now. It’s called Asset Inflation, with stock prices and home prices at all-time highs.
Now that inflation is running the hottest in 30 years, it seems a good time to examine what happens to asset classes when inflation is running higher than normal.
We’ll also have some comments on stock market valuations, small cap stocks, and stock market breadth. Our trend work is still fully invested, but there are definitely some dents in the armor. Read on.
What Does Higher Inflation Mean For Stocks?
Since the Covid-related lows of late March 2020, stocks have been on a tear, with the S&P 500 Index gaining over 100% from the low, and other indexes and stocks gaining even more. There’s been very little downside in stocks for over 19 months. But, with unprecedented government stimulus, and some amazing vaccines, most of the economy has recovered quite strongly, and with it, has created the highest inflation rate since 1990, with the CPI (Consumer Price Index) running at over 5% for multiple months now. So far, stocks and home prices have shrugged this news off, with both reaching all-time highs in recent weeks.
The traditional thinking goes that if inflation is heating up, interest rates must be rising. Gold must be soaring. There’s little, however, that is conventional about today. Interest rates, have in fact, risen, but given their paltry starting levels late last year, it seems hardly noticeable. The yield on the 10-year Treasury Note began the year at 0.92%, and today sits at 1.66%. That’s caused short to intermediate term bond funds to lose a bit this year, depending on their duration. Meanwhile, much to the chagrin of all the precious metal cheerleaders, the price of physical gold has actually declined about -6% for the year, as measured by the GLD exchange-traded fund, dropping from 1783 to 1672.
As you’ll learn below, higher inflation has not been good for most types of bonds in the past (junk may be an exception). And wait until you see the numbers on gold. You may be surprised. But, what about stocks? Stocks are supposed to be the best inflation hedge, correct? Well, let’s take a look.
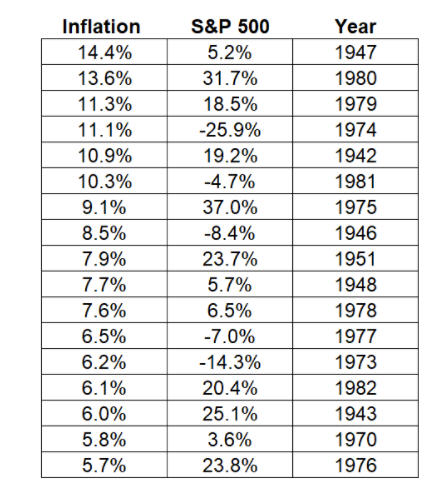
First, let’s establish what has happened to stocks during periods of higher inflation. Take a look at the column below, which ranks the highest calendar year rates of inflation with their corresponding stock market returns, using the S&P 500 as the index. This table is courtesy of Ben Carlson, and his excellent blog, A Wealth of Common Sense.
First, stocks lost money in 5 of the 17 years, or just under 30% of the time. That is only slightly higher than normal, as over time, stocks lose money on a calendar year basis about 1 in 4 years. There were certainly a few clunkers, especially the back-to-back declines in 1973 and 1974. All in all, though, the average return during these years was 9.4%, which was higher than the average inflation rate of those years, which was 8.74%. As a result, stocks showed nominal “real” returns (after inflation), even during the highest inflation periods in history. This is borne out in a couple of other studies shown below.
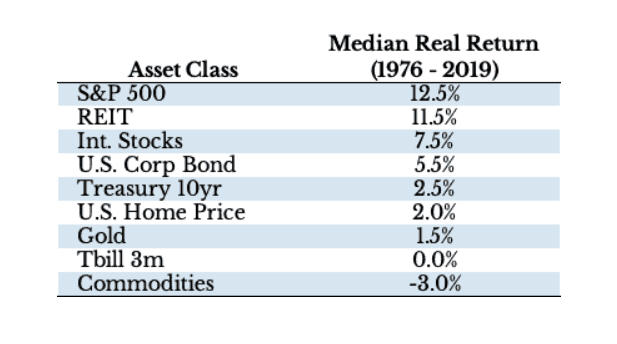
The first summary shows the median “real” return of 9 asset classes from 1976 to 2019. The tables and data are courtesy of Nick Maggiulli, and his terrific blog, Of Dollars And Data.
This period encompasses 44 years, and stocks are the clear winner, though REITs (real estate investment trusts) weren’t far behind. I should note a few things. There is a big difference between REITs and home prices. They are not the same. In fact, they aren’t even close. I know some investors and clients favor rental properties. Hey, to each his own, but I often wonder why, especially when you look at the data. I’ve often heard tales of successful real estate investors. The axiom often goes, “what is your secret for being successful in real estate?” Answer: “I never sell.” Well, if that’s the case, why are you investing your hard-earned dollars in an asset that has a real return over time of 2%, is illiquid and a pain in the ass, while stocks have returned 12% plus over inflation? For all the gold bugs, gold has been even worse than U.S. home prices. Commodities? No thanks. Just say no to managed futures funds.
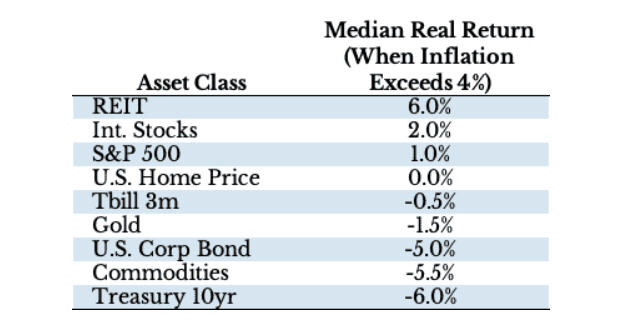
What really became more helpful was that Maggiulli sliced the data a bit more, and broke down the performance of the asset classes during periods of high inflation, which he defined as when inflation exceeded 4%, as it is running now and in the past several months. See below.
Stocks and REITS held their own, but the excess gains compared to inflation weren’t nearly as strong as when inflation is lower, and that’s certainly to be expected. The clear losers were gold, commodities and corporate and government bonds. Which brings us to one of the biggest questions of the day. What’s the argument for owning bonds? If inflation is running at 5%, and the starting yield on the 10-year Treasury Note is even 1.70%, my “real” return (not counting appreciation or depreciation) is -3.30%, just starting at the gate. We’re going to do our best at tackling this subject in an upcoming monthly update, as there are many facets to the answers. Bonds are meant to keep up with stocks. They have different levels of volatility. In our case, we don’t use traditional bonds/bond funds for most of our fixed income, rather favoring high yield bonds, which are more equity-like. In any case, we’ll not dive into that now.
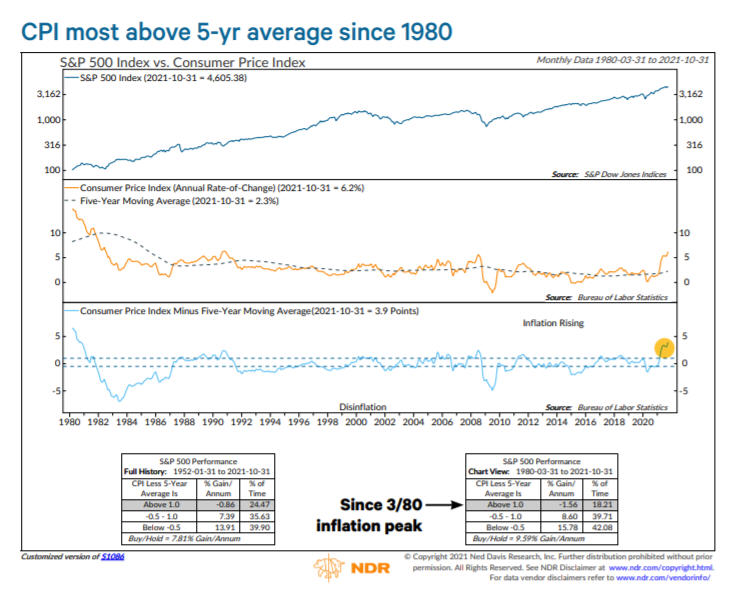
If inflation is here to stay, and is not transitory (as the Fed hopes), the past evidence suggests that stocks can still do reasonably well, but it’s not likely they will be able to continue at the pace of gains of the past 13 years, especially given historical valuations. One other way to look at stocks and inflation is shown below, in the chart and analysis from Ned Davis Research.
Rather than just focus on year-over-year inflation, NDR analyst Ed Clissold looked at the spread between the one-year average of inflation compared to its five-year average. At present, the five-year average of inflation is 2.3%, but the one-year rate of change is 6.2%, so the spread is a hefty 3.9%. As shown in the chart above in the mode box (bottom right), when the CPI less its 5-year average has been greater than 1% since 1980, the S&P 500 Index has actually fallen at a compound rate of -1.56%, and stocks have been in that mode nearly 20% of the time. The message from this data is that stocks should begin to struggle in coming months from current levels.
Stock Market Valuations
We’ve often said that fundamental valuation indicators are terrible for timing the stock market. And they are. We have learned, painfully, to avoid them. We feel it is more important to worry about what the market IS doing, than worrying about what it SHOULD be doing. That is why technical analysis, or perhaps more appropriately, quantitative analysis, is at the heart of our process.
Fundamentals, however, can be helpful with individual stock selection, and importantly, to try and assess where you are in the investment cycle. But, even there, one had better have a long-term horizon.
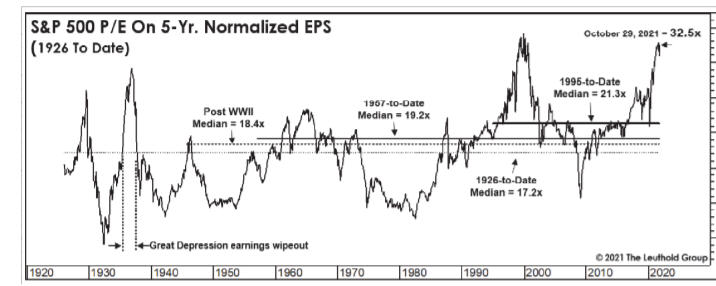
Take a look at the chart below, courtesy of our friends at The Leuthold Group. It represents the S&P 500 P/E (Price to Earnings) Ratio using 5-year Normalized EPS (earnings per share). The intent is to smooth earnings out over a longer period, and involves, using the 18 quarters of trailing results, plus two quarters of forecasts.
This data goes back to 1926, and the recent closing ratio of 32.5 has been exceeded only five other times, from April 1999 to August 2000, other than the 32.8 reading from August 2021. In other words, only one time in history have stocks been more expensive using this method than currently. If you don’t remember what happened after March 2000, well, the S&P 500 declined by nearly -50% the next three years, and the NASDAQ dropped by -83%.
Some pundits will rightfully argue that markets and the economy have changed since the early 1990s. I think that’s a fair argument. No doubt that valuations have skewed upward since then. Above, you can see that since 1995, the median ratio has been 21.3. Therefore, the current ratio is 52% above that median. The ratio would have to decline 34% just to get back to the median from 1995.
Unless stocks have reverted to “permanently” high valuations, I’d say -34% is the minimum downside risk in stocks from current levels. Bottom line, the risk/reward based on this analysis isn’t so hot, but there’s no technical evidence at this juncture to support taking defensive action. Stocks have been “overvalued” for several years, but they keep going up. It’s like life. Enjoy the good times, because you know, at some point, there will be challenges and adversity.
Small Caps Poised To Lead?
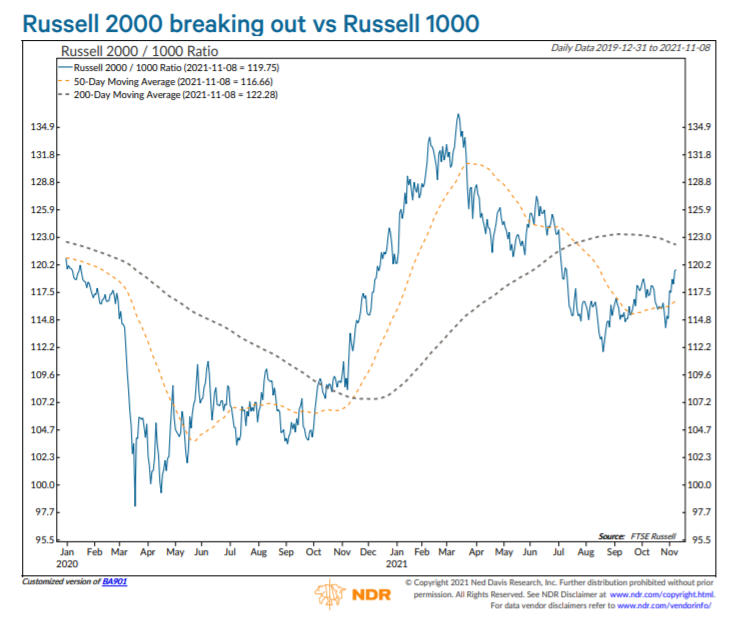
In our current allocations to stocks, 2/3 of our equity capital is sitting in small cap value and mid cap value, with the other 1/3 in large cap growth. Those allocations are driven purely by relative strength. As the chart below shows, courtesy of Ned Davis Research, the Russell 2000 Index (small caps) started to significantly outperform the Russell 1000 (large caps) in October/November of last year. This was associated with the introduction of the vaccines, and the re-opening of the economy. There was a tremendous surge into February of this year. Then, it was overdone, and there was a pretty big retreat into mid-August. Since then, small caps have again started to beat large caps.
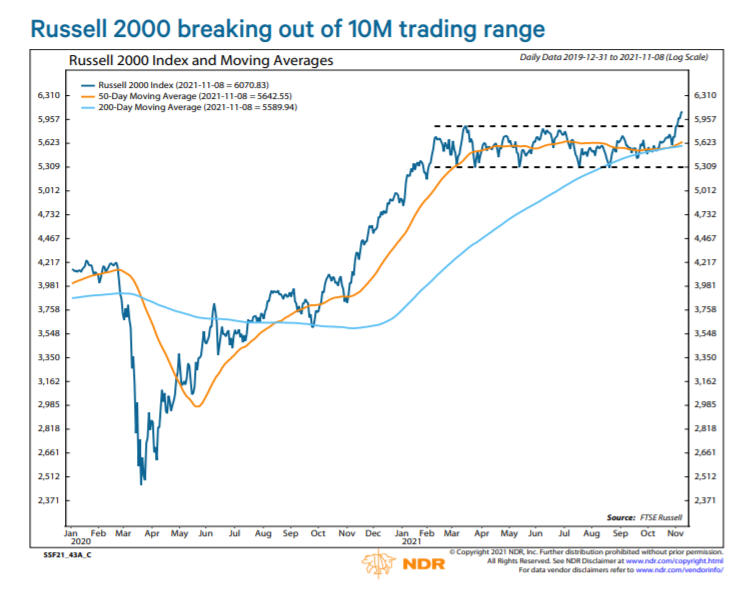
Coupled with the relative strength improvement noted above, the Russell 2000 also recently broke above a 10-month trading range (see below).
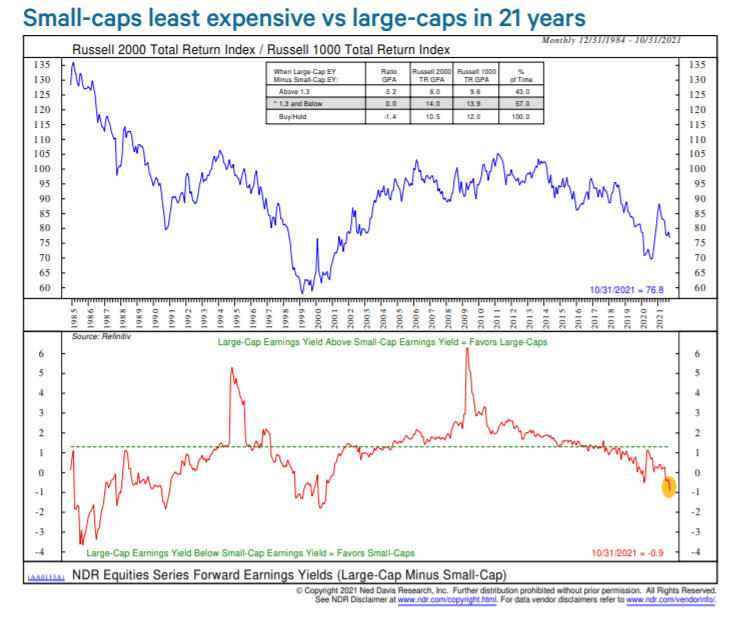
This normally might have bullish implications, but is contingent on the index not falling back into the range. That’s not a given, as the index has retreated -4.5% since November 8, when this chart was created. We are, however, in a very bullish seasonal period for small cap stocks, which extends from November into February, so perhaps some historical tailwinds will kick in after this consolidation. On the fundamental side, based on the forward P/E ratio versus large cap stocks, small cap stocks are now the cheapest in comparison to large caps in 21 years (see below). Allocating strictly to large companies has worked wonders for about the last 12 years, but all good things come to an end, so investors may want to consider a tilt in the small/mid-cap direction going forward. If the pundits are correct about low future returns, every edge will be helpful.
Stock Market Breadth
With recent all-time highs on a number of indexes November 8, several long-standing divergences were wiped out, or re-set. Small caps and Transportation stocks joined their large cap counterparts by breaking out to new highs. This is normally a bullish indication. However, there are several measures of market breadth, so it’s important to be balanced in looking at the landscape. Here, we’ll examine the number of stocks making new highs as the indexes make new highs, as well as the daily advance/decline line.
| Date & Index | Index Price | # of New Highs |
| May 10 NY Composite | 16,516 | 713 |
| Nov 8 NY Composite | 17,310 | 265 |
| May 10 Nasdaq Composite | 13,401 | 332 |
| Nov 7 Nasdaq Composite | 15,940 | 445 |
| Nov 18 Nasdaq Composite | 15,993 | 158 |
First, there is definitely a loss of momentum on the NY, with new highs shrinking from 713 to 265. That divergence is now 6 months old, and growing. This is normal as a bull market ages. There’s no hard and fast rule for how long the divergence has to be. Usually, the longer it goes on, the more negative. Divergences in new highs have lasted as much as one year, so one never knows. Maybe the peak was two weeks ago. This contrasts, though, with the Nasdaq Composite, which also made a new high recently, but new highs expanded beyond the level from May, growing from 332 to 445. This increase may be associated with the breakout in small cap stocks which was noted above.
Two things to note, though. On November 18, the Nasdaq made a higher high, but new lows dropped significantly to 158, and perhaps more importantly, new lows on that day expanded to 409. Less than two weeks off an all-time high, and new lows are greater than new highs. This is also happening on the NY, and is a warning. This is bad breadth, and has typically preceded significant declines.
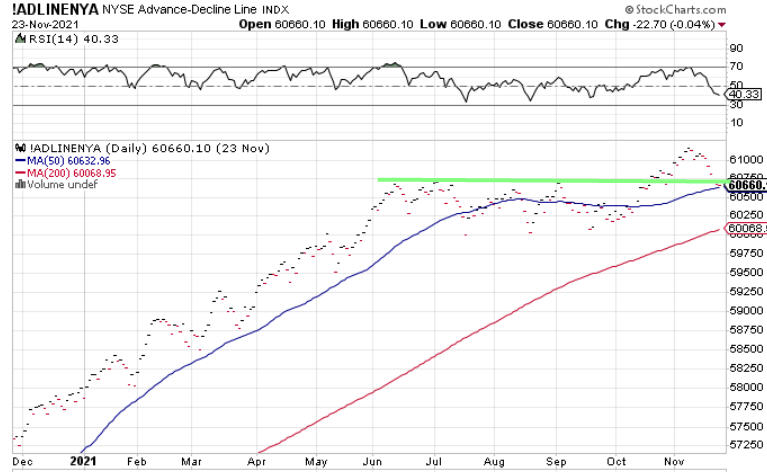
On the bright side, the NY advance/decline line made a new high in early November. See the chart below, courtesy of www.stockcharts.com.
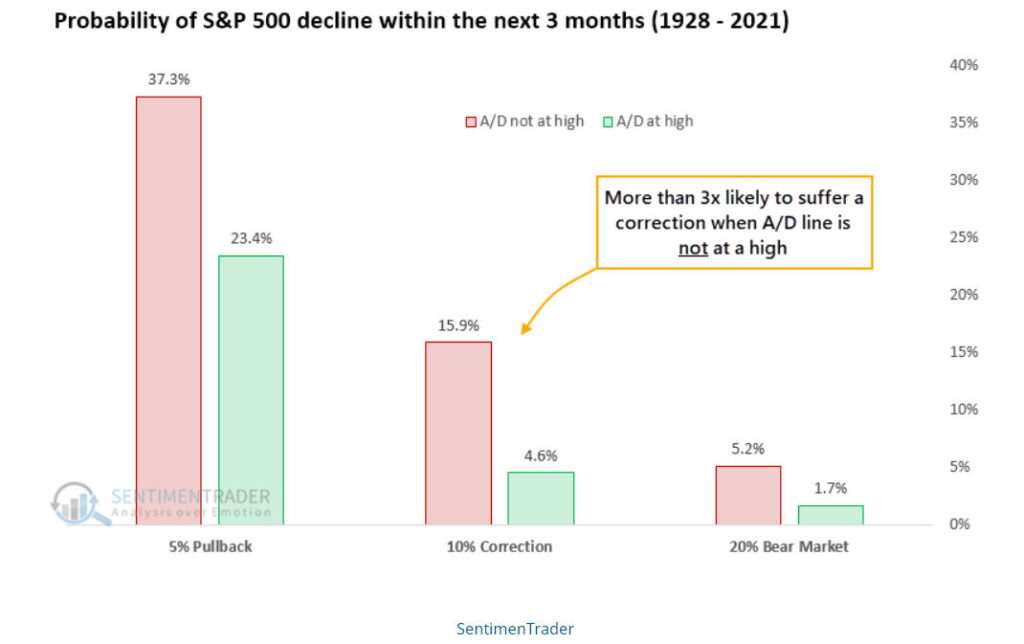
This has positive implications for the next three months, given historical data provided by SentimenTrader (see below).
Based on data going back to 1928, when the advance/decline line is at a new high, there has been less than a 5% chance of stocks losing -10% or more during the next three months. Coupled with the norm of bullish seasonality from November to at least February, further gains remain likely. I’ll add one thing, though. If the yield on the 10-year Treasury Note breaks out above 1.75% in coming weeks, all bullish bets are off. The stock market has been addicted to low interest rates. Take away the Christmas candy, and there is likely going to be some unhappy outcomes.
Current Portfolio Allocations
On October 18 and 26, two of our stock market risk models flipped back to positive, moving our equity allocations back to a fully invested position. That may or may not change in coming weeks. I can add that our gold trend-following model is very close to another BUY signal, which could happen any day. If so, part of our equity allocations will be shifted to a small position in physical gold, via an ETF, typically in the 3% to 5% range. We don’t have strong opinions on gold—we’ve had two small losses in the past year, money that would have been better off in stocks. We’ll see. It’s important to remain dispassionate about this area. As noted above, gold can have its moments, but it really doesn’t add much over time.
Of a more immediate note is paying attention to high yield corporate bond funds, and our risk model in that area. Our model has been on a BUY signal since November 9 of 2020, more than one year ago. However, prices in this sector of the bond market have been falling for the past three weeks, with the HYG exchange traded fund losing nearly -2% since November 5. Our own risk models do not rely upon HYG or JNK, but rather a variety of high yield bond mutual funds. Should our model turn negative in the next few weeks, it will be a warning sign of potential trouble for stocks.
Titan Baseball Scholarship Awards
Unlike last fall, when athletic teams were forced to socially distance, and in some cases, even wear masks while practicing, I’ve been thrilled to see a sense of normalcy return in this arena. As many of you may know, I’m heavily involved with my school, Cal State Fullerton, in several areas, including our baseball team, the Titan Capital Management class for Finance students, and also serving as a committee member with the Finance & Investments committee which oversees the University endowment.
Last week, I was able to resume a treasured ritual of working out with our entire team and coaching staff during a full practice, and combining that with the presentation of our annual scholarship awards to two players.
This year’s awardees are Wyatt Johnson on the left, and James Wambold on the right. Both are sophomores, Wyatt out of John F. Kennedy High School in Buena Park, and James out of Temecula Valley High School in Temecula. Ironically, both are pre-business majors, and are taking a demanding course load in the fall, and excelling. I love to see their excellence, on and off the field.
Below is a shot with the whole team. We are looking forward to January, and the opening of our brand new locker room, with some great additions to facilities for our softball girls as well.
Oh My, Mary!
We’ll have more on this next month, but just a heads up that our long-time Office Manager, Mary Hernandez, will be leaving TABR in mid-January for a well-deserved retirement. Mary has been working with me for 21 years, and is a huge part of our success, and our team. We think we have a great hire coming in, starting in mid-December and we’ll have more on that next month, but as you could imagine, I’m both sad and excited.
Run, Girl, Run!
A quick family update, which we’ll expand upon next month to include son Adam, as well as Steve’s tribe of Audrey and Conrad.
Daughter Caroline is now a junior at Orange Lutheran High School, in her third season on the Cross Country and Track teams. They just ran in the CIF Finals last Saturday at Mt. Sac Junior College, and unfortunately, missed the cutoff to advance to State Finals this week in Clovis, CA. She has made significant strides since her freshman year, and is interested in running in college, so we’ll see. The discipline she has displayed in training, and running 6 of every 7 days for basically the last 18 months amazes me. Simply put, a proud Dad (and Mom). That’s Caroline below, in the white top on the right.
Material Of A Less Serious Nature
In 1986, Peter Davies was on holiday in Kenya after graduating from Northwestern University.
On a hike through the bush, he came across a young bull elephant standing with one leg raised in the air. The elephant seemed distressed, so Peter approached it very carefully. He got down on one knee, inspected the elephant’s foot, and found a large piece of wood deeply embedded in it. As carefully and as gently as he could, Peter worked the wood out with his knife, after which the elephant gingerly put down its foot.
The elephant turned to face the man, and with a rather curious look on its face, stared at him for several tense moments. Peter stood frozen, thinking of nothing else but being trampled. Eventually the elephant trumpeted loudly, turned, and walked away. Peter never forgot that elephant or the events of that day.
Twenty years later, Peter was walking through the Chicago Zoo with his teenaged son. As they approached the elephant enclosure, one of the creatures turned and walked over to near where Peter and his son Cameron were standing. The large bull elephant stared at Peter, lifted its front foot off the ground, then put it down. The elephant did that several times then trumpeted loudly, all the while staring at the man.
Remembering the encounter in 1986, Peter could not help wondering if this was the same elephant. Peter summoned up his courage, climbed over the railing, and made his way into the enclosure. He walked right up to the elephant and stared back in wonder. The elephant trumpeted again, wrapped its trunk around one of Peter’s legs and slammed him against the railing, killing him instantly.
Probably wasn’t the same elephant.
This is for everyone who sends me those heart-warming bullshit stories.
May you be blessed during this Thanksgiving season. As St. Augustine remarked in a famous 4th-century sermon, “In this world, two things are essential: life and friendship. Both should be highly prized, and we must not undervalue them.” They are “nature’s gifts.” All of us at TABR absolutely value our friendship and relationship with you. Thank you.
Sincerely,
Bob Kargenian, CMT
President
TABR Capital Management, LLC (“TABR”) is an SEC registered investment advisor with its principal place of business in the state of California. TABR and its representatives are in compliance with the current notice filing and registration requirements imposed upon registered investment advisors by those states in which TABR maintains clients. TABR may only transact business in those states in which it is notice filed, or qualifies for an exemption or exclusion from notice filing requirements.
This newsletter is limited to the dissemination of general information pertaining to our investment advisory/management services. Any subsequent, direct communication by TABR with a prospective client shall be conducted by a representative that is either registered or qualifies for an exemption or exclusion from registration in the state where the prospective client resides. For information pertaining to the registration status of TABR, please contact TABR or refer to the Investment Advisor Disclosure web site (www.adviserinfo.sec.gov).
The TABR Model Portfolios are allocated in a range of investments according to TABR’s proprietary investment strategies. TABR’s proprietary investment strategies are allocated amongst individual stocks, bonds, mutual funds, ETFs and other instruments with a view towards income and/or capital appreciation depending on the specific allocation employed by each Model Portfolio. TABR tracks the performance of each Model Portfolio in an actual account that is charged TABR’s investment management fees in the exact manner as would an actual client account. Therefore the performance shown is net of TABR’s investment management fees, and also reflect the deduction of transaction and custodial charges, if any.
Comparison of the TABR Model Portfolios to the Vanguard Total Stock Index Fund, the Vanguard Total International Stock Fund and the Vanguard Total Bond Index Fund is for illustrative purposes only and the volatility of the indices used for comparison may be materially different from the volatility of the TABR Model Portfolios due to varying degrees of diversification and/or other factors.
Past performance of the TABR Model Portfolios may not be indicative of future results and the performance of a specific individual client account may vary substantially from the composite results above in part because client accounts may be allocated among several portfolios. Different types of investments involve varying degrees of risk, and there can be no assurance that any specific investment will be profitable.
The TABR Dividend Strategy presented herein represents back-tested performance results. TABR did not offer the Dividend Strategy as an investment strategy for actual client accounts until September/October 2014. Back-tested performance results are provided solely for informational purposes and are not to be considered investment advice. These figures are hypothetical, prepared with the benefit of hindsight, and have inherent limitations as to their use and relevance. For example, they ignore certain factors such as trade timing, security liquidity, and the fact that economic and market conditions in the future may differ significantly from those in the past. Back-tested performance results reflect prices that are fully adjusted for dividends and other such distributions. The strategy may involve above average portfolio turnover which could negatively impact upon the net after-tax gain experienced by an individual client. Past performance is no indication or guarantee of future results and there can be no assurance the strategy will achieve results similar to those depicted herein.
Inverse ETFs
An investment in an Inverse ETF involves risk, including loss of investment. Inverse ETFs or “short funds” track an index or benchmark and seek to deliver returns that are the opposite of the returns of the index or benchmark. If an index goes up, then the inverse ETF goes down, and vice versa. Inverse ETFs are a means to profit from and hedge exposure to a downward moving market.
Inverse ETF shareholders are subject to the risks stemming from an upward market, as inverse ETFs are designed to benefit from a downward market. Most inverse ETFs reset daily and are designed to achieve their stated objectives on a daily basis. The performance over longer periods of time, including weeks or months, can differ significantly from the underlying benchmark or index. Therefore, inverse ETFs may pose a risk of loss for buy-and-hold investors with intermediate or long-term horizons and significant losses are possible even if the long-term performance of an index or benchmark shows a loss or gain. Inverse ETFs may be less tax-efficient than traditional ETFs because daily resets can cause the inverse ETF to realize significant short-term capital gains that may not be offset by a loss.
For additional information about TABR, including fees and services, send for our disclosure statement as set forth on Form ADV from us using the contact information herein. Please read the disclosure statement carefully before you invest or send money.
A list of all recommendations made by TABR within the immediately preceding one year is available upon request at no charge. The sample client experiences described herein are included for illustrative purposes and there can be no assurance that TABR will be able to achieve similar results in comparable situations. No portion of this writing is to be interpreted as a testimonial or endorsement of TABR’s investment advisory services and it is not known whether the clients referenced approve of TABR or its services.

