Seasonal Weakness Dead Ahead. Sentiment Is Giddy. Be Aware Of History
If investors have not yet learned to ignore Wall Street’s forecasts, the first 7 months of 2023 are a good lesson to heed. Almost universally bearish and expecting a recession that currently is nowhere in sight, the S&P 500 has gained over 18% year-to-date, while the tech-heavy Nasdaq 100, also known as the QQQ, has gained 42%.
But not all is as it seems. Now, sentiment indicators are at their most bearish levels(meaning too many people believe the bull case) since the December 2021 peak. Is that enough to overcome a mostly positive tape? We’ll see.
Plus, we’ll have some comments on the market’s concentration in 10 leading companies, the mathematics of loss, and an update on short term yields coupled with the ins and outs of purchasing Treasury Bills and Notes.
July To September Hot In Temperature Only
With record temperatures being recorded in many parts of the nation as summer gets into full swing, it’s fair to ask—is the stock market going to remain “hot?” Probabilities suggest a more challenging three months ahead.
Below is the S&P 500 cycle composite for 2023, as compiled by the team at Ned Davis Research (www.ndr.com).
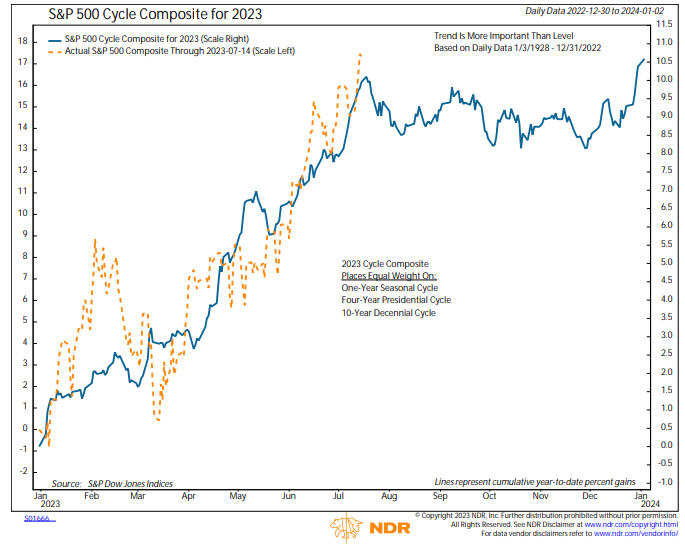
Cycles are never perfect, but stocks have been following the composite pretty well this year, especially the rally since early March. The chart is composed of the 10-year decennial cycle, the 4-year Presidential cycle and the 1-year seasonal cycle. If the correlation holds up here, stocks should be peaking right about now. This is corroborated by some seasonal data from Earnings Beats analyst Tom Bowley (www.stockcharts.com), who recently posted that the worst seasonal period of the entire year going back to 1950 starts July 17 and goes through September 27.
When this is combined with current sentiment data, as shown below, it suggests stocks are ahead of themselves and the period during the next 3 months or so should be problematic.
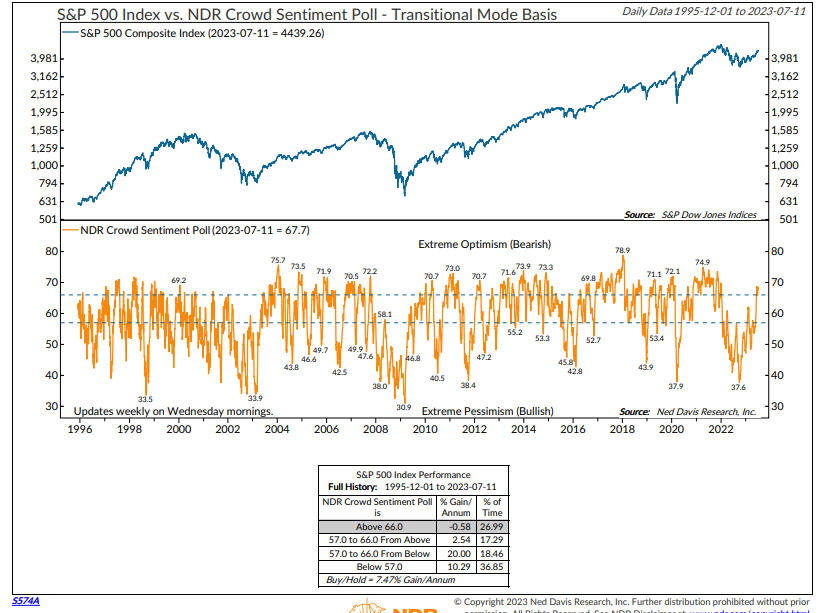
The chart above is also courtesy of our friends at NDR (www.ndr.com). This is their intermediate crowd sentiment poll, which has just reached its extreme optimism zone. A couple of comments. In this mode since 1995, stocks have generated very small losses, on average. I should also add that stocks rarely peak out on initially high sentiment readings. Usually, the bullishness has to persist for several months before stocks decline in a meaningful way. Nevertheless, combined with the seasonal data, this might be a time where sitting on the beach is more productive than being in stocks.
Trees Don’t Grow To The Sky
Much has been written about the concentration of the S&P 500 Index into just a handful of companies accounting for a significant portion of the performance of the index (good and bad), based on the capitalization-weighted methodology of how the index is computed. Below, through June 30, is the performance of 8 of the largest stocks in the index, seven of which are in the top 10.
Nvidia NVDA +190%
Facebook META +138%
Tesla TSLA +113%
Amazon AMZN +55%
Apple AAPL +50%
Netflix NFLX +49%
Microsoft MSFT +43%
Alphabet GOOGL +36%
Now, look at the chart below, which shows the top 10 stocks % of the S&P 500 Market Cap going back to 1972 (again, courtesy of Ned Davis Research).
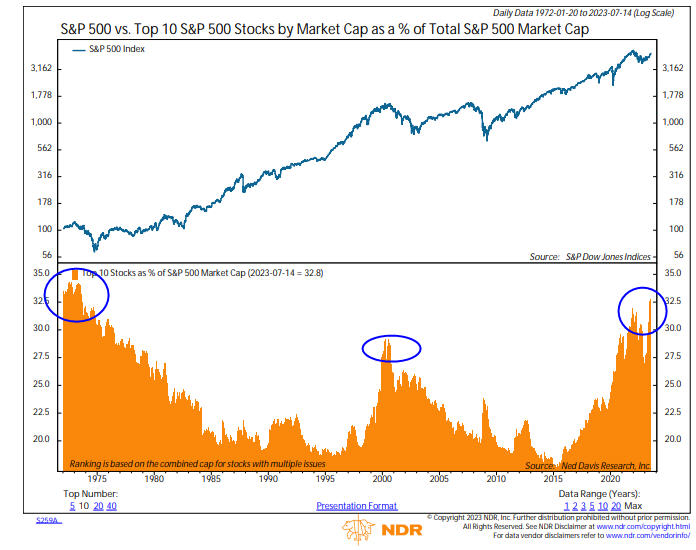
At present, the top 10 stocks in the S&P 500 comprise nearly 33% of the index. As denoted by the blue circles, the other times in history dating back to 1972 that this percentage was in similar territory was in 1999-2000, along with 1972-73 (not to mention 2021). The aftermath of those time periods was not good, with stocks plunging nearly -45% into December 1974, and nearly -46% during the three-year period that concluded in early 2003.
Will this time be any different? The legions of believers in Apple, Nvidia, Tesla and others would tell you YES. The law of gravity would tell you NO. Take Apple, for example. A great company, with great products. From 2013 through 2022, revenue at Apple grew by 130%. Net income grew by 169%. Yet, the stock price, on a split-adjusted basis, went from 18 to 183, a multiple of 10. Apple now trades at nearly 8 times sales. The growth in the stock price has come from investors paying greater and greater multiples of earnings and sales, which is unlikely to continue, simply because the company is much bigger than it was 10 years ago, and it will be that much more difficult to grow earnings and revenues from current levels.
Will Apple be the exception? Anything is possible. Markets and stocks do what we least expect them to. It’s their nature. But, it’s very unlikely all 8 of the above stocks will continue to dominate in the coming five to ten years. Now, let’s take a look at a couple of the leading stocks, and how the mathematics of loss comes into play.
The Mathematics Of Loss
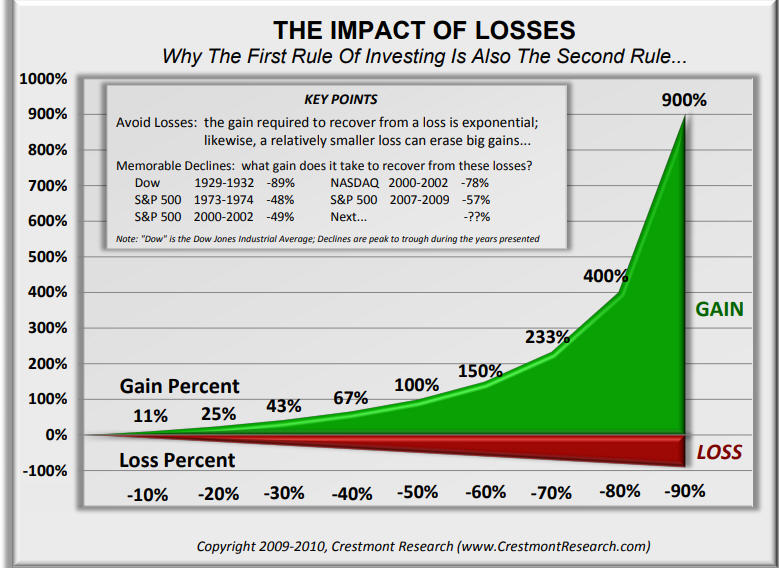
You don’t have to be a calculus whiz to understand compounding. How much do you need to earn if you lose 50% of your money? Hint. It’s not 50%. It’s actually 100%. Follow the math. You have $100,000 in Tesla. It goes down $50,000, or -50%. You now have $50,000 worth. What must happen in order for Tesla to get back to its value of $100,000? It needs to double. A really helpful chart from Crestmont Research illustrates this concept below (www.CrestmontResearch.com).
Let’s take a look at Tesla and Amazon, for example, to see how this is playing out in real time. Below is the Tesla chart going back to the end of 2021. Charts are courtesy of www.stockcharts.com.
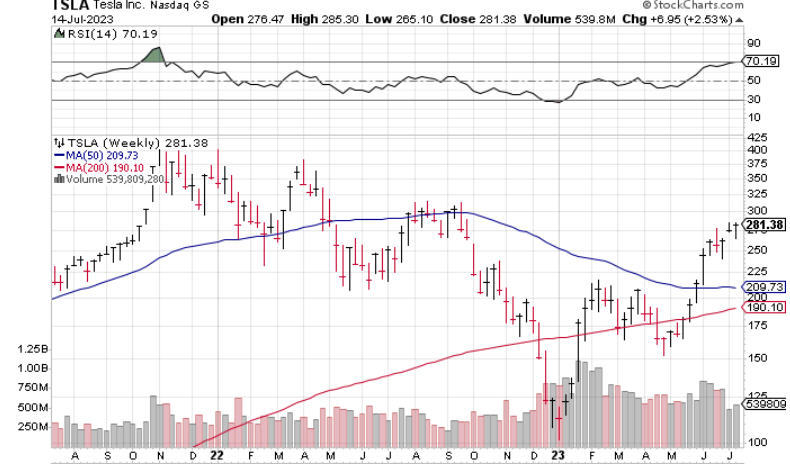
From its peak in November 2021 at 409, the stock fell -73% to 108 on January 3, 2023. Despite its 160% rally from that low, the stock is still -31% below its high. Amazon has a similar tale.
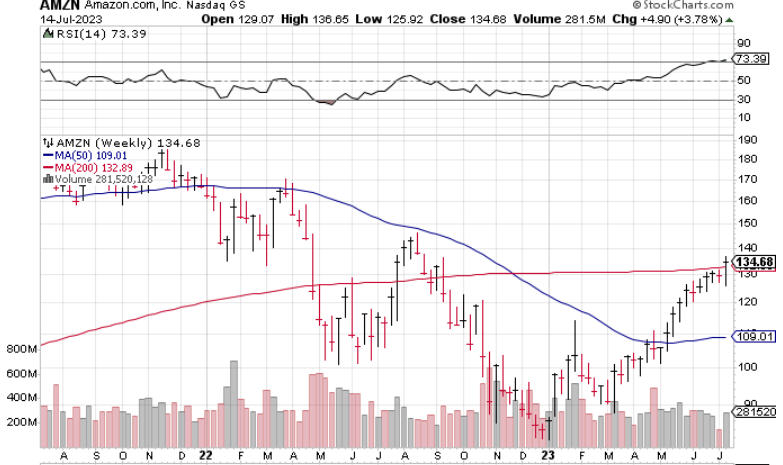
From its November 2021 peak at 184, Amazon fell -55% to its low at 82, and has since rebounded 64%. Yet, its still some -27% off its high.
A Warning On Technology Stocks
From about 2009 to the end of 2021, growth stocks, led by technology, have dominated the stock market. Below is the chart of the XLK Technology Select Sector ETF, back to 2013. The relentless uptrend was finally interrupted in 2022, but the index has rebounded to make an all-time high. Point of reference—Apple and Microsoft make up 45% of this fund.
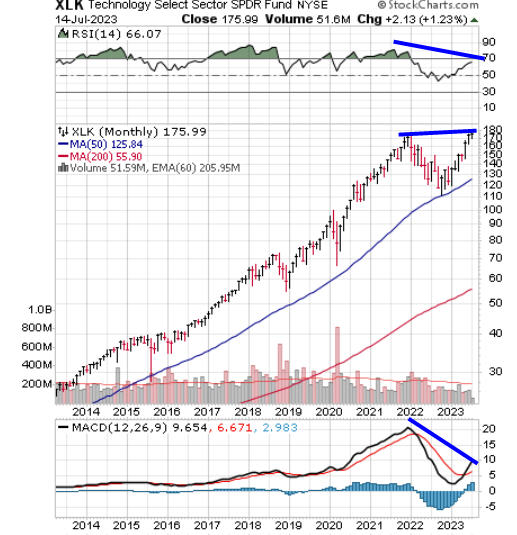
In any case, a technician would tell you there are negative divergences brewing on the monthly chart, with the RSI (Relative Strength Index) on the top clip failing to eclipse the 70 level, and the MACD (Moving Average Convergence Divergence) on the bottom clip way below the 2022 peak. Leading sectors rarely maintain their leadership in back-to-back market cycles. Growth stocks, in some ways synonymous with technology, led the market from 2009 to 2021, trailed Value by a long shot in 2022, and are now leading again. How long can this go on? I guess we’ll find out in coming months and years, but I wouldn’t bet on growth if you made me choose.
An Update On Short Term Yields And How Purchasing/Selling Treasury Bills & Treasury Notes Works
Until April of 2022, the term “Cash is Trash” had been used for many years, suggesting that the yield on short term bonds of all sorts from treasuries to corporates to municipals was very little, which it was. In the last 15 months, though, thanks to the Federal Reserve raising rates 10 times, there’s now actually income to go with the term “Fixed Income.” The chart below, courtesy of YCharts and @CharlieBilello, illustrates this quite well.
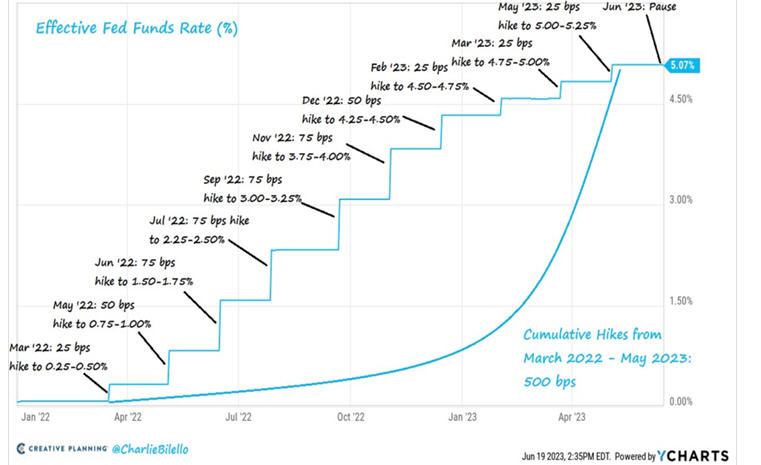
At present, the overnight Fed Funds rate is 5-5.25%. Below are current yields as of Friday’s close (July 14).
Fidelity Cash Reserves 4.78% (liquid money market)
3 month Treasury 5.49%
6 month Treasury 5.52%
1 year Treasury 5.34%
2 year Treasury 4.74%
Rates have moved sharply higher in recent weeks, with the yield on the 2-year Treasury Note gaining nearly 1% from early May. It even breached the 5% level earlier last week for just a day, and then dropped back. The Fed is expected to raise rates once again at their next meeting in late July, to the 5.25% level. By late August, one should expect to see money market yields at 5% plus, but there’s no way to know what impact will take place with longer term maturities. One thing seems fairly probable though—I don’t see the Fed cutting rates until sometime in 2024, and that should only happen if the economy finally does start contracting, which is no sure bet.
Bank deposit rates, such as those from J.P. Morgan Chase, Wells Fargo, Bank of America, Schwab Bank and many others, including credit unions, have not kept pace with the yield increases. I’m not talking about your checking account, where the only place you can expect to earn yield is if you use a brokerage account checking account, such as offered by Fidelity. I’m talking savings rates.
They continue to be virtually nothing, with 0.04% at Bank of America, and J.P. Morgan Chase at 0.01%. Wells Fargo is similar. It’s as if they are daring their depositors to leave with all their savings. In this realm, there’s certainly a lot of inertia in many cases. And, candidly, it’s not necessarily worth the hassle if you’re talking about $10,000 or $20,000. It just depends on one’s personal point of view. To person A, earning 5% on $20,000 versus earning nothing might not move the needle, where it certainly would for person B.
Last summer though, just through the natural evolution of our lives, a number of clients sold their homes and moved, and all of a sudden, we were dealing not with $20,000 in savings, but rather $700,000 or $1.5 million or even more. I don’t have to tell you that earning an extra 3% or 4% risk-free on $700,000 or more is not trivial.
So, we started to educate and purchase Treasury paper for various clients, of different maturities, all tied to their short term goals, sometimes even to coincide with a certain amount of capital maturing to pay taxes on capital gains from the sale of real estate. It’s dawned on us that many clients have never done this before, being accustomed to purchasing CDs from a bank. I thought it might be helpful to walk you through the basics.
Did you know that Treasury Bills for 13-weeks and 26-weeks are auctioned every week, while Treasury Bills for 52 weeks are auctioned every 4 weeks? Treasury Notes have mid-range maturities, while Treasury Bonds have long-range maturities. In general, Treasury Notes are considered to be from 2 years to 10 years, while Treasury Bonds are longer than 10 years. Interest is paid on maturity for Treasury Bills, while Treasury Notes and Bonds pay interest every 6 months. Another little known fact for investors, which is quite helpful in high tax states—the interest from Treasury Bills, Notes and Bonds is not taxed at the state level.
We typically have not been purchasing Treasury paper on auctions, but rather just go into the secondary market for Treasuries, which is the largest and most liquid of any bond instrument. On any given morning, we simply pull up the inventory from Fidelity’s bond desk on our system, and we can look at maturities ranging from one month to 30 years out. Here’s an example of a trade we made last Thursday, July 13, for a client.
We purchased $110,000 face amount of a Treasury Note maturing June 30, 2024 with a fixed coupon of 2%. We paid 96.9959 for each bond (face amount is $1000 each), with a yield to maturity of 5.24%. The total cost of the purchase was $106,779. How’s that? First, you take $110,000 and multiply it by 0.969959, which is $106,695.49. You then have to pay accrued interest of $83.70. That interest goes to the seller, because they held the Note for 13 days since the coupon date, which is June 30.
If the client holds this Note until maturity, the $106,779 they put up will be worth $110,000, and in addition, on December 30, 2023, they will receive an interest payment of $2200 ($110,000 times 2%).
An obvious question that comes about is—what happens if you want to sell early? Can you? What’s the consequence? With a CD from a bank or credit union, they will normally have a policy that if you cash out of your CD before maturity, you’ll pay a penalty of X number of months of interest. No such penalty takes place when you own individual Treasury paper, or for that matter, individual bonds of any type. Rather, you just sell at the market price that is prevailing in the open market.
That price is determined by what has happened to the course of interest rates since you purchased the bond. Example. Let’s say one purchased $300,000 of a one-year Treasury Bill at 97. Let’s also stipulate that the yield you received was 3%. Six months later, you find out that you need $100,000 of the $300,000. We would simply go in and sell 100 of the 300 bills you own at the market. What would the price be? That depends on what has happened to the bond market in those six months. If one-year yields are still 3%, you will have accrued about six months of interest and in this example, the Note would be trading around 98.5. Remember, at maturity it would be worth 100.
Instead, let’s say in the six-month period, now 1-year paper is going for 5%. Also, that six-month paper is at 4.50%. Aha–now, you have six months remaining on your paper, but you own a Note that was yielding 3%, and now rates are 4.5%. Your Note is not as valuable. So, instead of getting 98.5, you might only get 97 or 96. It works the other way as well. In this example, let’s assume that with six months to go, now 6-month Treasury paper is trading at a yield of only 2%. Here, you own one that pays 3%. That’s more valuable, and will be reflected in the pricing in the secondary market.
The other factor to be aware of is that in the bond market, size matters. Whether you are buying or selling, you will normally get better pricing if you are dealing with $500,000 as opposed to $25,000. I can’t tell you how long the Treasury market and money market funds will have the significant edge over bank deposits that they do now, but one thing is true. Millions of investors are leaving a lot of money on the table by doing nothing.
Update On Homeowner’s Insurance
I thought I would share the resolution of my pending dilemma of having our homeowner’s policy cancelled by our insurance company, AmGuard by Berkshire Hathaway, due to fire zone risk. Our insurance agent in Yorba Linda, Chuck Hyneman, encouraged us to file the request to appeal the decision. There was no downside to that. We completed a two-page questionnaire with 12 questions, and emailed it to the company. Within a week, Chuck called and told me the company had rescinded the cancellation and would be offering us a renewal. We just paid it, and the rate had barely even budged upward, which I thought was remarkable. This was quite fortunate, because also in the interim, Farmers Insurance indicated they also had stopped offering new policies in California. Do whatever it takes to avoid getting stuck with California Fair Plan. What an oxymoron that is.
Why Home Prices Have Barely Declined From Their Peak
Did you know that according to published reports, 62% of mortgage holders have a rate below 4%, and 92% of them have a rate below 6%? Mortgage rates are near 7%, which is why almost nobody is moving, creating a housing shortage, and very little supply, so prices have barely budged. I also thought this was fascinating. The U.S. economy has 1.5 million realtors, even after 60,000 of them left the profession in the last six months. The number of realtors exceeds the number of homes for sale.
If the Fed maintains higher rates for longer, perhaps a recession WILL be inevitable, as I suspect there will be about 800,000 realtors without a job, because there is no business to be done.
Portfolio Allocations
Our models run independently of any subjective short term concerns we may have about markets, so despite the odds of weakness dead ahead, at present, four of our five stock market risk models remain positive, so tactical equity exposure remains steady at 80%, and fixed income exposure remains fully invested in high yield bond funds and PIMCO Income, both of which made considerable progress this past week.
Material Of A Less Serious Nature
A Sunday school teacher of first graders was concerned that his students might be a little confused about Jesus Christ since the Christmas season only emphasizes his birth. The teacher wanted to make sure his class understood that the birth of Jesus occurred a long time ago, then he grew up, and performed his many works. So he asked his class, “Where is Jesus today?”
Steven raised his hand and said, “He’s in heaven!”
Mary was called on and answered, “He’s in my heart!”
Little Jeffrey, waving his hand furiously, blurted out, “I know! I know! He’s in our bathroom!!!”
The whole class got very quiet, looked at the teacher, and waited for a response. The teacher was completely at a loss for words. He finally gathered his wits and asked Jeffrey how he knew this. Little Jeffrey replied, “Well, every morning my father gets up, bangs on the bathroom door and yells ‘Jesus Christ, are you still in there?!'”
Summer officially begins this week based on the calendar, but it’s already Hot N Herre (look up the song by Nelly if you’ve not heard of that). What else is new? Well, the Angels aren’t making the playoffs (again), but maybe my Giants will. And the 49ers open camp next week. Sweet. Super Bowl, here we come. I hope. Thanks for your continued support and trust in all of us at TABR.
Sincerely,
Bob Kargenian, CMT
President
TABR Capital Management
TABR Capital Management, LLC (“TABR”) is an SEC registered investment advisor with its principal place of business in the state of California. TABR and its representatives are in compliance with the current notice filing and registration requirements imposed upon registered investment advisors by those states in which TABR maintains clients. TABR may only transact business in those states in which it is notice filed, or qualifies for an exemption or exclusion from notice filing requirements.
This newsletter is limited to the dissemination of general information pertaining to our investment advisory/management services. Any subsequent, direct communication by TABR with a prospective client shall be conducted by a representative that is either registered or qualifies for an exemption or exclusion from registration in the state where the prospective client resides. For information pertaining to the registration status of TABR, please contact TABR or refer to the Investment Advisor Disclosure web site (www.adviserinfo.sec.gov).
The TABR Model Portfolios are allocated in a range of investments according to TABR’s proprietary investment strategies. TABR’s proprietary investment strategies are allocated amongst individual stocks, bonds, mutual funds, ETFs and other instruments with a view towards income and/or capital appreciation depending on the specific allocation employed by each Model Portfolio. TABR tracks the performance of each Model Portfolio in an actual account that is charged TABR’s investment management fees in the exact manner as would an actual client account. Therefore the performance shown is net of TABR’s investment management fees, and also reflect the deduction of transaction and custodial charges, if any.
Comparison of the TABR Model Portfolios to the Vanguard Total Stock Index Fund, the Vanguard Total International Stock Fund, the Vanguard Total Bond Index Fund and the S&P 500 Index is for illustrative purposes only and the volatility of the indices used for comparison may be materially different from the volatility of the TABR Model Portfolios due to varying degrees of diversification and/or other factors.
Past performance of the TABR Model Portfolios may not be indicative of future results and the performance of a specific individual client account may vary substantially from the composite results above in part because client accounts may be allocated among several portfolios. Different types of investments involve varying degrees of risk, and there can be no assurance that any specific investment will be profitable
For additional information about TABR, including fees and services, send for our disclosure statement as set forth on Form ADV from us using the contact information herein. Please read the disclosure statement carefully before you invest or send money.
A list of all recommendations made by TABR within the immediately preceding one year is available upon request at no charge. The sample client experiences described herein are included for illustrative purposes and there can be no assurance that TABR will be able to achieve similar results in comparable situations. No portion of this writing is to be interpreted as a testimonial or endorsement of TABR’s investment advisory services and it is not known whether the clients referenced approve of TABR or its services.

