Cycles Suggest A Pause In Stocks. Higher Highs Are Probable. Inflation Isn’t Going Away
The stock market, as measured by the S&P 500 Index, had risen over 27% since its late October lows, with nary a -3% decline, the longest such streak in over 6 years. That uptrend is over, and cycles now suggest a consolidation into at least late May, if not longer.
The momentum of the advance, however, favors higher highs before the next bear market. More is inside, including a note on inflation, the shakeup in real estate commissions, credit card delinquencies, and a story about a kid named Laroi.
Stock Market Cycles Suggest A Pause In The Uptrend
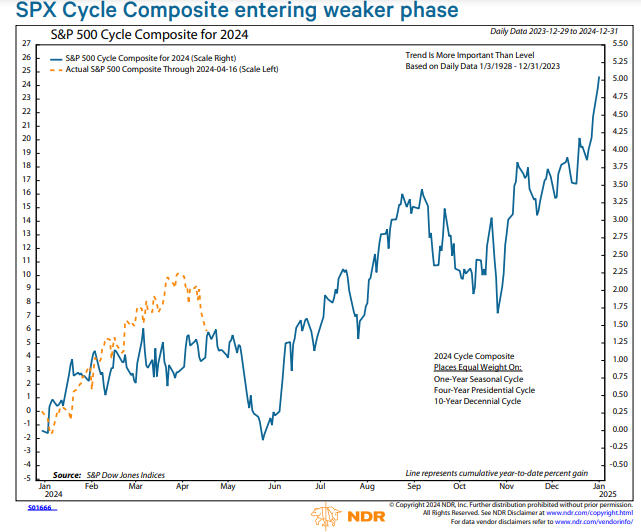
We’ve featured the S&P 500 Cycle Composite for 2024 a few months ago, courtesy of our friends at Ned Davis Research (www.ndr.com). It’s worth another look, and is shown below. This is a blend of the one-year seasonal cycle, the four-year Presidential cycle and the 10-year Decennial cycle.
Cycles are never exact, and these depict the trend, not the magnitude of market moves. History often does repeat itself, but not all market movements align with prior cycles.

One can see the cycles suggested a top in early May, and thus far, that top appears to have taken place in early April, with a drop likely into late May at a minimum. At present, new lows are expanding with the decline, and stocks are the most oversold in nearly six months. I would not expect five months of rising prices to be corrected in just a couple of weeks, so further price declines are likely in coming weeks. Most Presidential Election years presage modest gains, and that’s what is still expected. However, a sustained rise in bond yields could make all the history look silly.
Momentum Suggests Higher Highs Are Ahead Of Us
The best thing the stock market can do is go up. This sounds simple, but it’s true. A number of breadth surges have taken place since November, and just as recently, through February. As Ned Davis Research cited in a memo earlier this week, “momentum surges rarely come near the end of bull markets.”
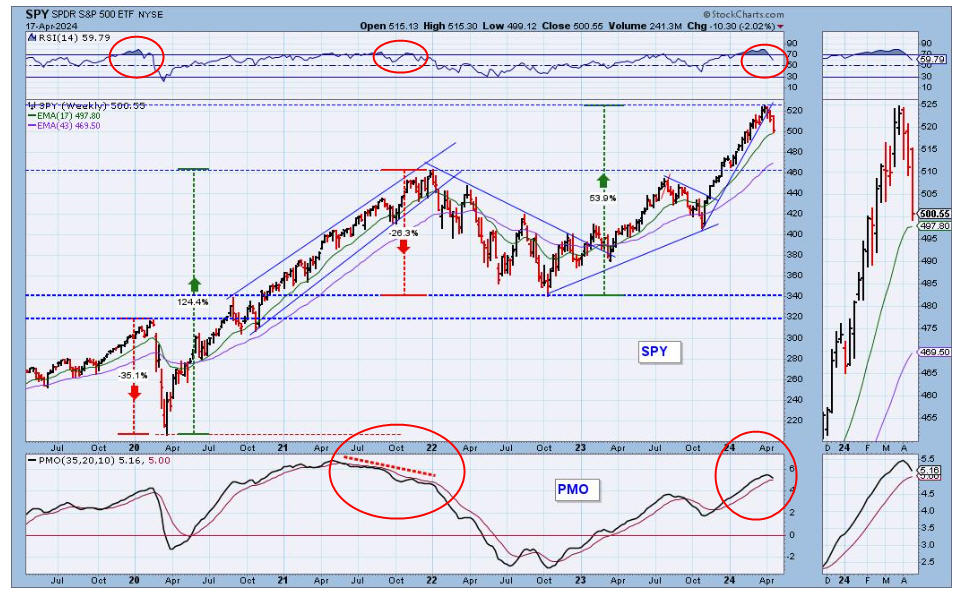
One example is below, which is the weekly chart of the S&P 500.

The chart is courtesy of www.decisionpoint.com. I’ve circled both the 14-week RSI indicator in the top clip (Relative Strength Indicator) and the PMO in the bottom clip (Price Momentum Oscillator). It is a sign of strong bull market behavior when the RSI is able to reach and exceed the 70 level. That level was reached in early 2024 and only recently has the indicator turned down.
If you’ll notice the two prior instances on the chart when reaching the 70 level, there was a negative divergence that took place before prices declined significantly. Meaning, prices backed off, then went to higher price highs, and then the RSI failed to confirm with a higher high. You see similar action in the PMO in the bottom clip.
According to friend Doug Ramsey at The Leuthold Group, there’s only been one case out of 16 when an S&P 500 bull market peak coincided with its momentum high. That was in November 1980. Nothing works all the time (well, wait and read the next section!), but the odds are high that after a spring/summer decline, stocks will make new highs in the fall. At that point, it is more probable that a negative divergence will take place with momentum, and then stocks will be in a precarious position for the next bear market. We’ll see if it plays out this way.
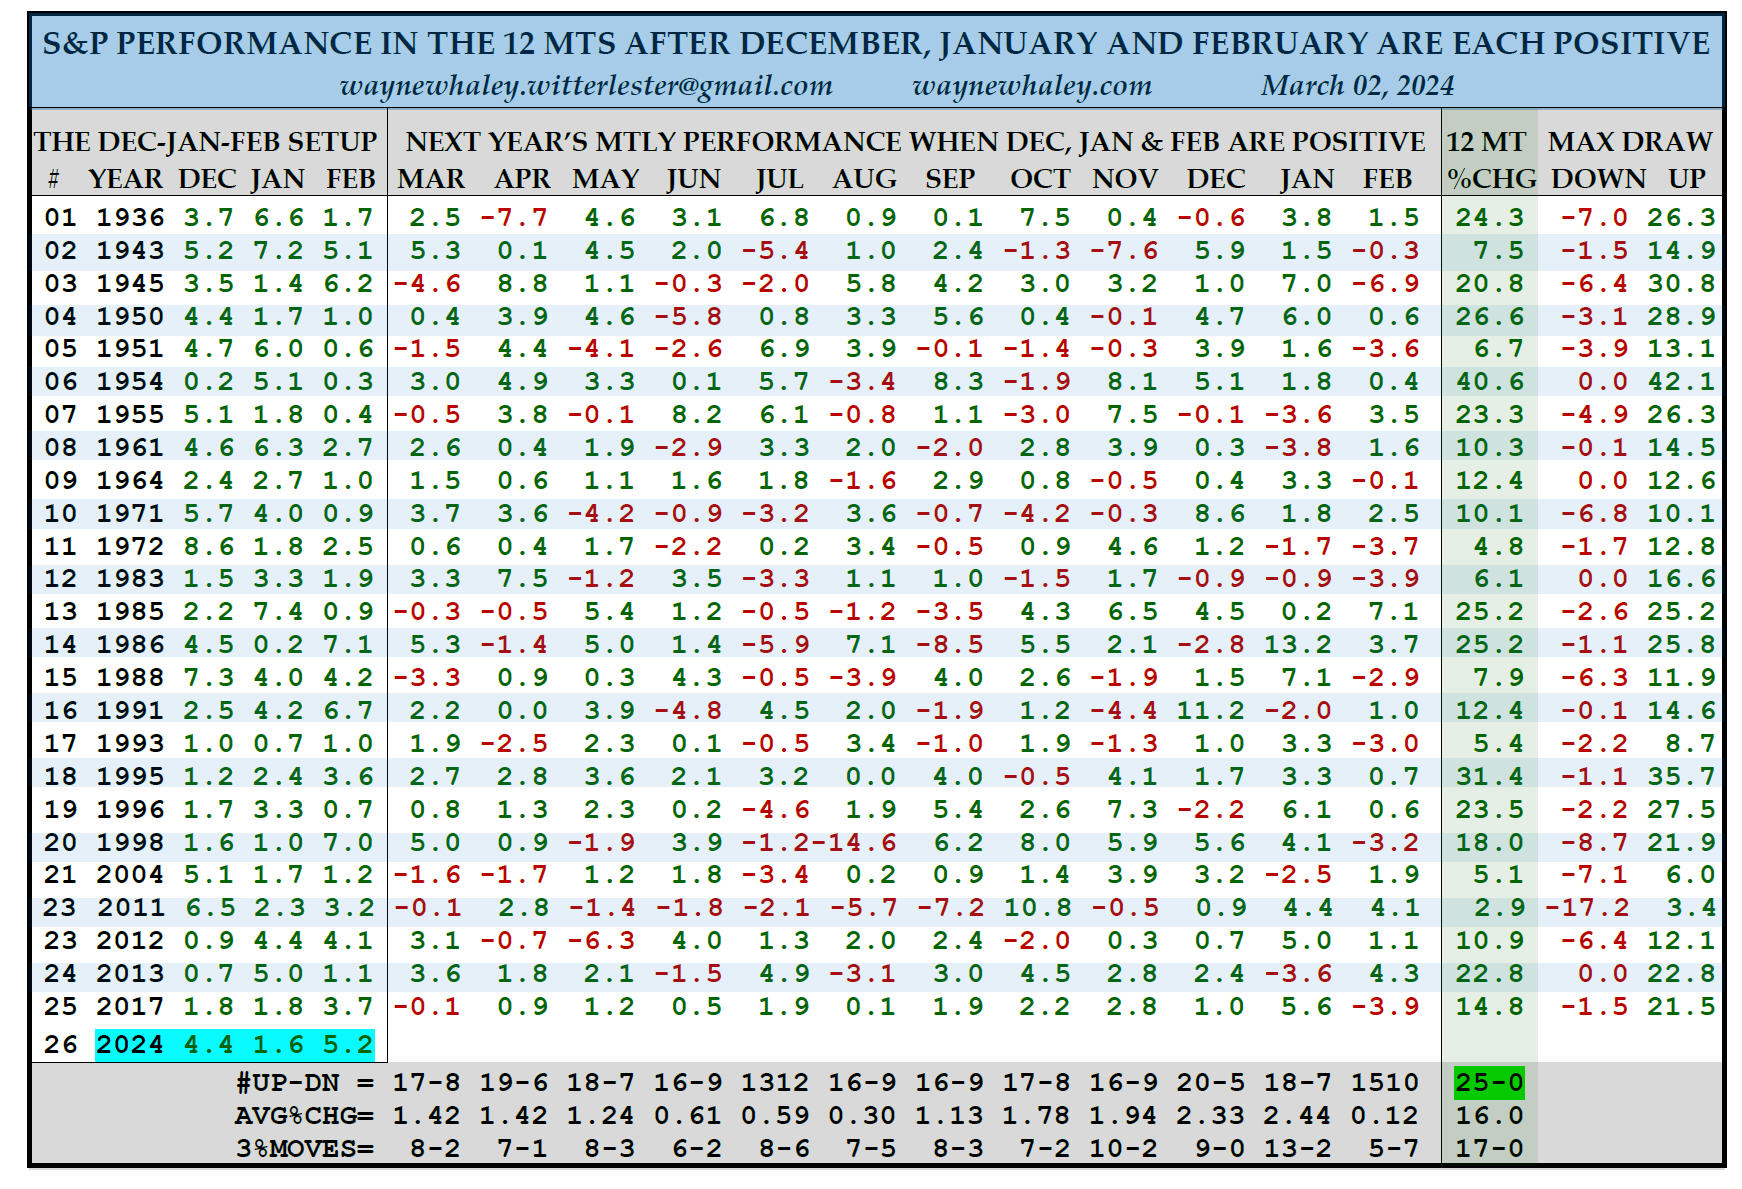
At the risk of jinxing a study that has so far had a perfect record, well, here goes. Analyst Wayne Whaley discovered this phenomenon in one of the thousands of scans he has done in his career (waynewhaley.com). The table below is courtesy of Mr. Whaley.

This past year (2023-24), the S&P 500 Index gained 4.4% in December, 1.6% in January and 5.2% in February. Since 1930, there have been 25 prior occasions in which the three months were each positive (strong momentum). Whaley found that in all 25 cases, stocks were positive in the following year (March-February) with average annual gains of 16%. The worst outcome was a 2.9% gain in 2011, which ironically also had the biggest drawdown of -17%.
Remember to start with the base case in examining data. The average annual gain for all 12 month periods is about 10% per annum. This is a pretty strong indicator, with average gains some 60% greater than the norm, and with 25 prior cases, it is almost statistically significant. Despite the near term warning signs, it wouldn’t be wise to bet against this tendency.
Inflation Isn’t Going Away
Before backing off the past two weeks, the price of crude oil had advanced nearly 25% since early December, reaching $88 per barrel, and one of the big reasons when I filled up my car last week with 17 gallons of premium, the bill was once again $102. So much for $4.70 per gallon. Now, it’s closer to $6.00.
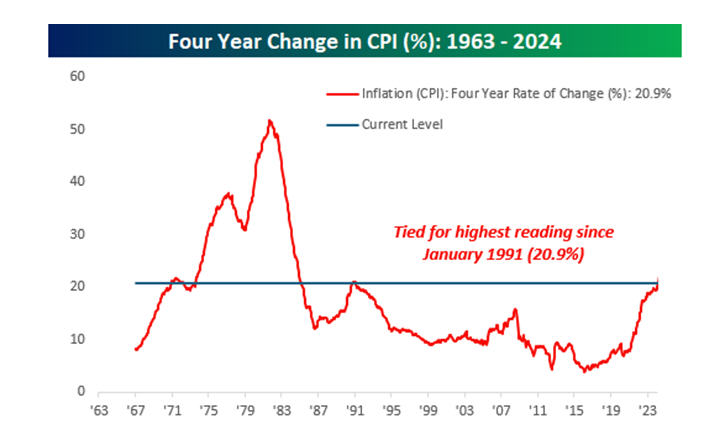
Along with yields in the bond market rising substantially in the first four months of the yea, this is making the Federal Reserve’s goal of 2% inflation look not only silly, but unrealistic. Below is a chart showing the four year change in the CPI (Consumer Price Index), which is the preferred gauge to measure inflation. The charts below are courtesy of www.bespokepremium.com.

This is the first time in 33 years that the 4-year rate of change has exceeded 20%. Currently, the year-to-year change (not shown) is running at 2.9%, but the 3-month annualized change has up ticked to 3.5%, now exceeding the six-month annualized change at 2.9%. There’s no accurate way to forecast future inflation, but if the year-over-year changes continue to increase at the same rate as the first 3 months of 2024, by year-end, the annualized rate of inflation would be approaching 6% or more. This may be why bond yields are rising, and it is causing the Federal Reserve to pause on any thinking of lowering rates.
Since the beginning of the year, the yield on the 10-year Treasury Note has increased 78 basis points, from 3.86% to 4.64%. Similar bumps have taken place in the 2-year Treasury Note, from 4.30% to 5.00%, while the 1-year Treasury Bill has advanced from 4.80% to 5.18%. This has certainly hurt fixed income performance during the first few months of the year. But, in taking a bit of a longer term view, the yield to maturity now on the 2026 and 2027 Defined Maturity Bond Funds we own in portfolios (IBDR and IBDS) is now in the 5.40% to 5.50% range on a gross basis. Given the valuation levels of the stock market, we find that quite compelling, and 50% of our fixed income exposure is in this area.
Below is another, quite simplistic view of inflation over time, and something we can all relate to. That is, the cost of a postage stamp. Look at the chart below, also from Bespoke Premium.

Back in 1967, the cost of a first-class stamp was all of a nickel, as in $0.05. Today, it is $0.68 and the U.S. Postal Service has requested an increase to $0.73. Doing the compound math, which today is quite easy with a rate of return calculator, the rate of inflation of a stamp from 1967 to 2024 is 4.9%. I’ve not researched recent data on auto insurance and homeowner’s insurance, but from anecdotal conversations with clients, watch out. Which makes me wonder, what is the Fed smoking? Their target is to get inflation down to 2%. This is despite the fact that from 2000 to 2019, inflation averaged about 2.50%. Why would you set a target which is 25% below a level that the economy hasn’t been able to attain in 25 years? And, why hasn’t the financial press asked this of Chairman Powell? From a broad perspective, there currently are no signs at all of a probable recession, with the exception of the note below on credit cards. The Fed has no basis to cut interest rates at present, and it seems likely that this will be the case for many months. I expect short term yields of 5% plus for many more months. We’ll see.
Credit Card Delinquencies
If the economy is so strong, why are so many people in debt? According to new data published by the Federal Reserve Bank of Philadelphia, all stages of credit card delinquency—defined as 30, 60 and 90 days past due, increased during the fourth quarter of 2023 to the highest level on record, with the data going back to 2012, when the Fed began to track the data. This is alarming, given that the average credit card annual percentage rate, known as the APR, is at a record of 20.75%.
Please know I’ve not studied this, but am inferring what I think to be obvious. In general, the consumers with the most debt are the ones with the least amount of income, and poor spending disciplines. That would tend to cluster in the bottom 50-60% of the populace. If there’s one thing to teach your children (and yourself!), it’s the power of compound interest, both for you, and against you. Paying off a credit card every month is one of the best disciplines anyone can learn. Where this goes, I’ve no idea. I’ll leave that to the economists.
The Shakeup In Real Estate Commissions
When I started in the stock brokerage world with E.F. Hutton in 1982, the commission to purchase a $25,000 investment in a mutual fund was typically 8.50%. Today, and for many, many years now, that commission is gone, and investors can purchase funds and trade stocks for pretty much nothing. Candidly, if you’re an investor and still paying commissions to some broker, you’re either comatose or clueless. Real estate, though, and the purchase and sale of homes, has been a different story. I purchased my first home in 1987 in Placentia for $167,000. The seller paid a 6% commission to the selling broker and our broker (3% each). That practice continues today, all over the United States, though in expensive markets such as Southern California and other locales, when the selling price gets into the $millions, it’s been typical that the brokers would take a lower bite (say 5% split, or even 4% perhaps on properties of $5 million and up).
According to published reports, this archaic process is unique to the United States, which reportedly has by far the highest commissions of any country in the world. Well, that is likely to be a thing of the past. A number of home buyers sued the National Association of Realtors for price fixing, and a multi-$billion dollar settlement has taken place. How this sorts out, I have no idea. Technology has changed many industries, including finance, and mostly for the better. Imagine 20 years ago. Your husband got promoted to his firm’s home office in Dallas, Texas, and you’ve got to move the family half way across the country and find a new home.
Then, you’d have to hop on a plane, find a real estate agent, and go driving around all over the Dallas/Fort Worth areas, looking at various listings your agent found for you, based on your criteria. Now, on various real estate web sites, you can do that from your own home, fly to Dallas and go look at the properties yourself and be done. We’ve even known of stories where clients have purchased homes this way sight unseen. Let’s say the home sells for $1.5 million. You’re going to pay the brokers 5% of that, which is $75,000. For what? Today, many buyers and sellers are doing more of the work than the brokers and finally, a number of them got fed up, and said, this has to stop. I can tell you in our personal experience of the few homes we have purchased and sold since 1987, our real estate agents have been worth their weight in gold.
But the commoditization of information has changed the home buying industry, and like other areas, including finance, you either adapt or you die. For a brief summary of what’s happened, below is a piece from our friend Bob Veres, who writes a great financial planning monthly letter called Inside Information. Thank you, Bob.
What Does the Realtor Settlement Mean for Us?
You might have read about what the press is calling a seismic shift in real estate commissions, and how people are going to be paying their realtors a lot less to sell their homes going forward.
The changes are the result of a $1.8 billion lawsuit filed in Missouri by a group of home buyers, who claimed that the National Association of Realtors (NAR) and two large realtor organizations were conspiring to keep broker commissions at the industry standard 6%, when a truly competitive marketplace would have produced commissions in the 3-4% range. The settlement impacts more than a million realtors, and paves the way for home sellers to shop the prices (commissions) that they would pay to a listing agent and the ultimate sales agent.
As a result, real estate commissions are expected to fall 25% to 50%, on average for the 1.6 million real estate agents across the U.S. marketplace. In dollar terms, the average-priced American home for sale ($417,000) would have paid $25,000 in brokerage fees before the settlement. That would fall by between $6,000 and $12,000.
The NAR agreed to pay $418 million over four years to resolve the price-fixing allegations. But perhaps more painfully for the organization, the settlement will also provide more market share to flat fee and discount brokerage operations, which had been forced to do business outside of its Multiple Listing Service. Independent (Non-NAR) members will now, through the settlement, be allowed to list properties on the MLS, and they might (still up in the air) be able to advertise a lower commission.
Analysts are still sorting through the real-world impact. But the ruling opens the door to buyers paying some or all of the (negotiated) brokerage fees for the service of finding the property, rather than the seller being on the hook for the entire brokerage fee. Nobody seems to expect the ruling to produce a rush to sell homes and properties; in fact, paradoxically, it could reduce sales activity. Why? Buyers may not always have the funds to pay a broker out-of-pocket; they typically rely on the mortgage loan for the purchase funds. Current lending practices don’t allow brokerage fees to be added to the cost of the home, so the brokerage fees would have to be somehow added to the price of the house to be covered by the loan.
Sources:
https://www.cnn.com/2024/03/15/economy/nar-realtor-commissions-settlement/index.html
https://www.cbsnews.com/news/realtor-commission-settlement-nar-national-association-realtors/
https://www.advisorperspectives.com/articles/2024/04/09/how-nar-settlement-change-way-buy-home
Current Portfolio Allocations
Our stock market risk models have deteriorated in the past couple of weeks, with two sell signals, and as a result, our tactical equity exposure has been reduced from 83% to 60%. One of the SELLS is intermediate in nature, so it will be instructive as to what the market does in coming weeks. Should the market continue to deteriorate, we would expect other models to join in. On the fixed income front, our high yield bond risk model has been on a BUY signal since early November. That streak is in jeopardy, and our model could turn negative this weekend. If so, those funds will temporarily be moved to ultra short bond funds. I should also note one thing. Though we’ve not used it as such, I’ve found that our high yield bond model has been especially effective at calling the turns in the S&P 500, so a SELL signal will remove a bullish prop from the case for being in stocks shorter term.
A Story About A Kid Name Laroi
For those of you familiar with our son, Adam, he graduated from New York University in 2017 with his degree in photography, with his goal set to work in the music business. After freelancing in NYC, he moved back to Los Angeles in December of 2019, only to see the entire music and film industry shut down by Covid until at least late 2020. In the spring of 2021, though, a mentor in the industry recommended him to an up and coming rapper/pop singer named The Kid Laroi, who’s media team wanted to do a documentary on Laroi, but needed the right fit. The team and Laroi met Adam, liked him, and hired him to be his chief photographer/videographer. Three years later, all the planning and work became a reality in February, when the documentary premiered on Amazon Prime. Roughly 90% of the footage in the documentary is Adam’s, including the poster below.

Here’s a link to the trailer for the documentary.
https://www.imdb.com/title/tt31415596/
And here’s an article from Forbes magazine, where Director Michael Ratner was interviewed about the project, and had some awesome things to say about Adam. Adam was an Associate Producer on the project.
Finally, our family was invited to the premiere in Los Angeles which was in mid-February, and even sister Caroline ditched school from Cal Poly SLO for a day to honor her brother. Definitely a proud moment for our son. As I write this, Adam and Team Laroi are in Europe on a month-long tour, headed to Berlin as we speak, then Duseldorf, Paris and Milan next week, back home for a few weeks and then embark on the North American tour in mid-May.

Material Of A Less Serious Nature
We grew up with Steve Jobs, Johnny Cash and Bob Hope. Now, there’s no jobs, no cash and no hope. Please God, don’t let anything happen to Kevin Bacon. 🙂
A father passing by his son’s bedroom was astonished to see that his bed was nicely made and everything was picked up. Then he saw an Envelope, propped up prominently on the pillow that was addressed to ‘Dad.’
With the worst premonition he opened the envelope with trembling hands and read the letter.
Dear Dad: It is with great regret and sorrow that I’m writing you. I had to elope with my new girlfriend because I wanted to avoid a scene with Mom and you.
I have been finding real passion with Stacy and she is so nice.
But I knew you would not approve of her because of all her piercings, tattoos, tight motorcycle clothes and the fact that she is much older than I am. But it’s not only the passion…Dad she’s pregnant. Stacy said that we will be very happy.
She owns a trailer in the woods and has a stack of firewood for the whole winter. We share a dream of having many more children.
Stacy has opened my eyes to the fact that marijuana doesn’t really hurt anyone.
We’ll be growing it for ourselves and trading it with the other people that live nearby for cocaine and ecstasy.
In the meantime we will pray that science will find a cure for AIDS so Stacy can get better. She deserves it.
Don’t worry Dad. I’m 17 and I know how to take care of myself.
Someday I’m sure that we will be back to visit so that you can get to know your grandchildren. Love, Your Son John
PS. Dad, none of the above is true. I’m over at Tommy’s house.
I just wanted to remind you that there are worse things in life than a report card that’s in my center desk drawer.
I love you. Call me when it’s safe to come home
It’s spring, and major league baseball is in full force. At this point, unless you’re a White Sox, Marlins or Rockies fan, you still have hope. Even the Angels are 9-10, and only 1.5 games out of first. But, I digress. This weekend begins the most exciting tournament in all of pro sports, the Stanley Cup Playoffs. My Dallas Stars are the # 1 seed in the Western Conference, and many pick them to win the Cup. The Stars’ only Cup victory was in 1999-2000, so it’s 24 years and counting. It’s time. Let’s Go Stars.
Don’t worry. We won’t lose focus on the markets or planning issues, and there are many, including much to write about next month. Thanks to all of you for your continued trust and confidence in all of us at TABR.
Sincerely,
Bob Kargenian, CMT
President
TABR Capital Management, LLC (“TABR”) is an SEC registered investment advisor with its principal place of business in the state of California. TABR and its representatives are in compliance with the current notice filing and registration requirements imposed upon registered investment advisors by those states in which TABR maintains clients. TABR may only transact business in those states in which it is notice filed, or qualifies for an exemption or exclusion from notice filing requirements.
This newsletter is limited to the dissemination of general information pertaining to our investment advisory/management services. Any subsequent, direct communication by TABR with a prospective client shall be conducted by a representative that is either registered or qualifies for an exemption or exclusion from registration in the state where the prospective client resides. For information pertaining to the registration status of TABR, please contact TABR or refer to the Investment Advisor Disclosure web site (www.adviserinfo.sec.gov).
The TABR Model Portfolios are allocated in a range of investments according to TABR’s proprietary investment strategies. TABR’s proprietary investment strategies are allocated amongst individual stocks, bonds, mutual funds, ETFs and other instruments with a view towards income and/or capital appreciation depending on the specific allocation employed by each Model Portfolio. TABR tracks the performance of each Model Portfolio in an actual account that is charged TABR’s investment management fees in the exact manner as would an actual client account. Therefore the performance shown is net of TABR’s investment management fees, and also reflect the deduction of transaction and custodial charges, if any.
Comparison of the TABR Model Portfolios to the Vanguard Total Stock Index Fund, the Vanguard Total International Stock Fund, the Vanguard Total Bond Index Fund and the S&P 500 Index is for illustrative purposes only and the volatility of the indices used for comparison may be materially different from the volatility of the TABR Model Portfolios due to varying degrees of diversification and/or other factors.
Past performance of the TABR Model Portfolios may not be indicative of future results and the performance of a specific individual client account may vary substantially from the composite results above in part because client accounts may be allocated among several portfolios. Different types of investments involve varying degrees of risk, and there can be no assurance that any specific investment will be profitable
For additional information about TABR, including fees and services, send for our disclosure statement as set forth on Form ADV from us using the contact information herein. Please read the disclosure statement carefully before you invest or send money.
A list of all recommendations made by TABR within the immediately preceding one year is available upon request at no charge. The sample client experiences described herein are included for illustrative purposes and there can be no assurance that TABR will be able to achieve similar results in comparable situations. No portion of this writing is to be interpreted as a testimonial or endorsement of TABR’s investment advisory services and it is not known whether the clients referenced approve of TABR or its services.

