It’s Just A Hunk Of Metal. That Four-Letter Word. GOLD
Few assets evoke similar amounts of passion and disdain as the precious metal, gold. This month we’ll look at its role in a diversified portfolio, if any, and what the data says. Trust me, the believers won’t be swayed.
We’ll also touch on 529 expenses (what is and isn’t), the on-going upheaval in auto and homeowners insurance, and why Warren Buffett is just average.
Put It On Your Fingers. Stick It In Your Ears. But, Invest In It? Maybe.
Several years ago, I was having a conversation with a long-time client, and near the end of the call, he remarked he was looking for a new truck and was going to go down to the dealership where he knew someone and “see what Joe wants for that hunk of metal.” I’ve always remembered that. I’m not a “car guy,” and don’t obsess over them, yet many do. To each his own passion. Ultimately, though, cars are just a hunk of metal (or whatever they’re made of today—see below on insurance—they cost a lot!). Which got me to thinking—is gold anything more than just a hunk of metal?
Let’s look at the data, and some of the arguments. Below is a comparative return chart going back to August of 1971, courtesy of Ned Davis Research (www.ndr.com), showing the total return of the stock market as measured by the S&P 500 Index, versus gold, Treasury Bonds, Treasury Bills and median home prices.
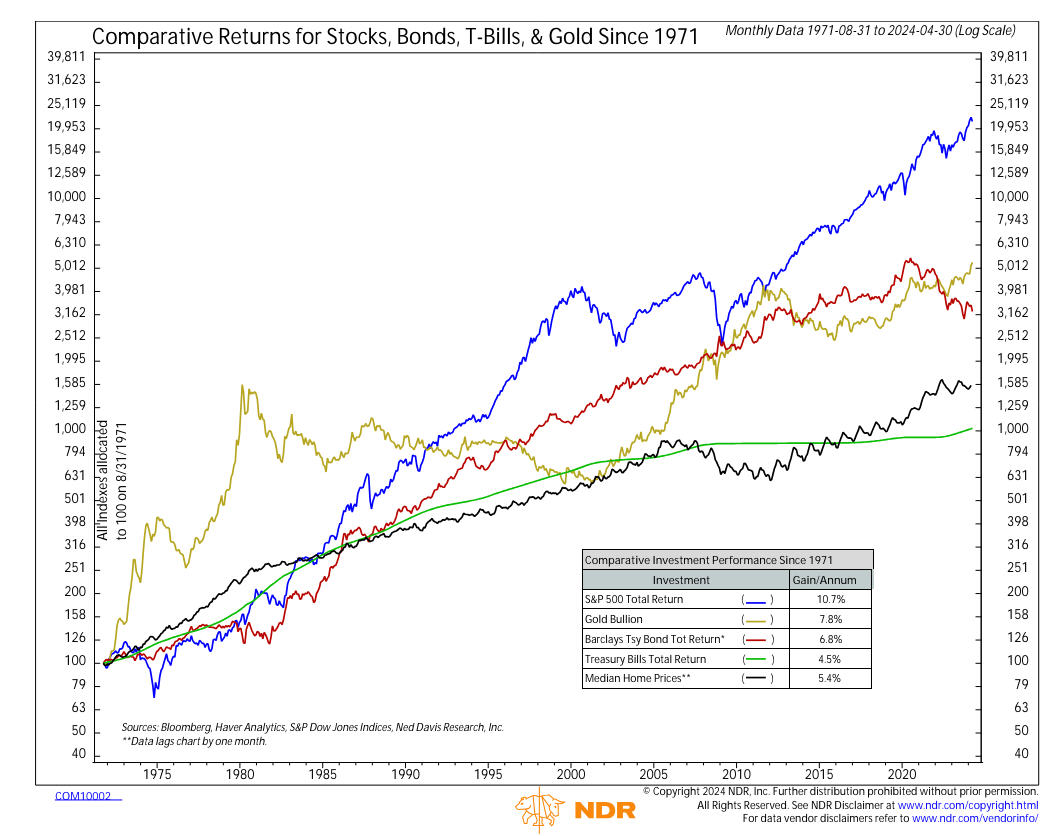
Though not shown on the chart, inflation as measured by the Consumer Price Index (CPI) was approximately 3.5% per annum during this time period. Many gold supporters argue that gold is a great inflation hedge. In the long run, it has outpaced inflation, but not necessarily when you think it should have. After its 1980 peak, it didn’t make a new high for over 25 years. And though the 7.8% compound return since 1971 is second best in this comparison, I’m a bit skeptical of the number because gold was not freely traded until 1975. Even then, it was very hard to buy and sell, even through stock brokerage firms. For the four years from 1972 to 1975, it compounded at 34% per annum. Should you really be counting returns of an asset that nobody could buy? Take those four years away, and the returns aren’t even sniffing stocks. Gold, by the way, does this with more volatility than the stock market. See the chart below, taken from an article on www.morningstar.com.
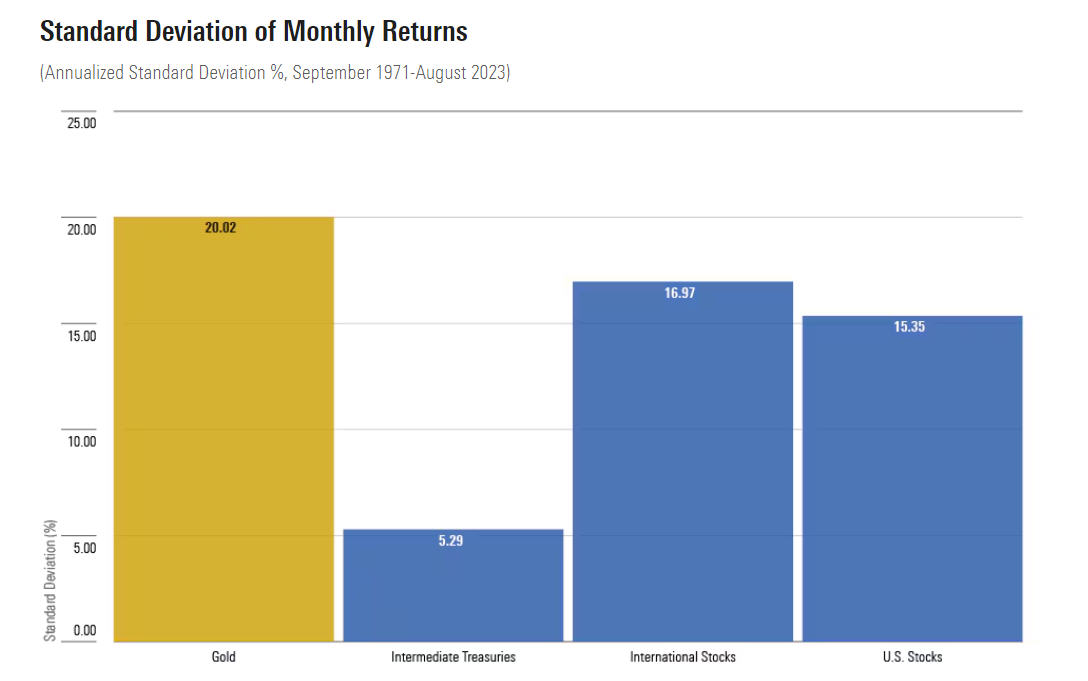
The standard deviation of gold prices, historically, is 30% more volatile than U.S. stocks, with less return. Not a good combination. If the data doesn’t support owning gold, what is it that makes investing in it so compelling to many? In the several articles I’ve saved over time and researched for this piece, I think I’ve found the main reason that many have this conviction on gold. In an August 2023 article in the Wall Street Journal, “When Markets Get Scary, Mom and Pop Buy Gold,” a 44-year-old engineer was quoted as follows: “Precious metals are kind of what just makes it so I can sleep at night, where I hold it and nobody can hurt me. It’s impossible that I’m going to end up in a bread line somewhere, waiting for someone to drop something into my hand, so I can eat.”
In other words, gold is a way of making one feel safer. To this end, Warren Buffett (who we’ll write about below on a different topic) had this to say about gold back in 2011 on an appearance with CNBC’s Squawk Box. “With an asset like gold, for example, you know, basically gold is a way of going long on fear, and it’s been a pretty good way of going long on fear from time to time. But you really have to hope people become more afraid in the year or two years than they are now. And if they become more afraid you make money, if they become less afraid you lose money. But the gold itself doesn’t produce anything.”
I may be simplifying the matter, but maybe it is this simple. Gold bugs tend to be pessimistic. You know the type. You might even be one of them. “The country’s going to hell. Inflation’s out of control. The government just keeps printing money. There’s going to be a day of reckoning.” And on and on. It’s amazing some of the stuff that ends up in print. In the same article noted above, a different person was quoted as follows: “When you’re buying metals and holding them, it doesn’t matter whether the price goes up or down, you still feel pretty good about it. A downtick in the price of a precious metal means you have an opportunity to buy more, and uptick means your net worth goes up, so it’s a win-win.”
And you thought your political friends on the left and right were insane? That’s like saying to your wife when you got home, “Hey, honey, I got fired today, but don’t worry, now I can stay home with the kids, we just can’t afford to live here anymore or go out to eat.” We try to be quite a bit more objective when analyzing things. Below is a relative strength chart which compares gold to the S&P 500, going back nearly 25 years. The chart is courtesy of www.stockcharts.com. When the line is rising, gold is outperforming the S&P 500, and when it is falling, it’s the opposite.
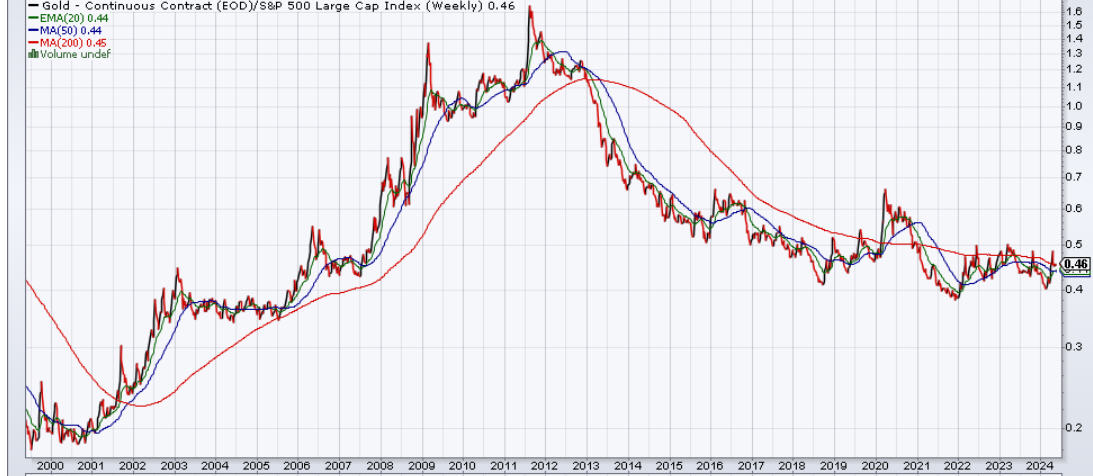
As noted in the top comparative return chart, gold went nowhere for nearly 25 years from 1980 to 2005. It began to outperform the stock market in 2001, and that relative performance peaked in 2011, and it’s been a massive underperformer since then through 2019, and has pretty much matched stocks the past five years. To be a believer in gold, you’ve got to have a very long time frame. From a diversification standpoint, it used to be that gold was not very correlated with stocks, so that when one rose, the other would fall. Like yin and yang. The problem is two-fold, though. Stocks, based on annual returns, rise nearly 75% of the time, so you’re buying insurance for the lower probability event (unless you can predict the next 2000 to 2009, when stocks lost money and gold soared). Second, in the past five years, the correlation of gold to the stock market has been at 0.80, so its diversification benefits of the past may no longer be present.
Regarding the inclusion of gold in TABR’s portfolios, we’ve waxed and waned during the past 20 plus years. In the 1980s and 1990s until about 2000, we used a very short-term timing model to trade gold stock mutual funds with tremendous success. Then, two things happened. It stopped working and fund companies stopped allowing short-term trading. We switched to a gold risk model to manage the funds, which was based on the ratio of gold versus gold mining stocks, and we eventually abandoned that when I realized that using ratios with financial data is not foolproof. Just when you think the ratio can’t go higher or lower than prior history, it does. Several years ago, we finally felt comfortable enough with a price-based, trend-following model we devised with the help of Ned Davis Research, and we re-introduced an approximate 5% allocation to gold (not gold stocks) in most portfolios.
Perhaps I ran out of patience, as gold went sideways until last fall, and I decided to go with the long haul data and just put the funds back into our stock allocations. We may or may not be going into a higher inflationary environment, in which case commodities in general may be an area to exploit with limited exposure. I’m in the process of testing a model in that area, and then seeing if there’s a viable way to produce an edge. Unlike the 1970s and 1980s, it is much easier to get gold exposure in one’s portfolio. It’s as simple as buying one of the two ETFs which purchase gold, either GLD or IAU. I’m not a fan of physical gold, either bars or coins. I promise you—they’ll sit in your house for 40 years, you’ll die, and then your kids will go “WTF did my parents buy this for?” And, “how do we get rid of it?” Before you head to Costco and become part of the nearly $200 million that their shoppers are spending on gold bars monthly, read this story from the April Wall Street Journal (The Headache at the End of the Costco Gold Rush).
Unlike stocks and bonds, which produce growth and income, gold produces nothing, so it’s pretty much impossible to value. But, I found an objective way to look at the long-term trend, from a chart that Ned Davis Research produced below (www.ndr.com). The chart plots a ratio of gold versus the Dow Jones Industrials, and then runs a regression trendline through the data.
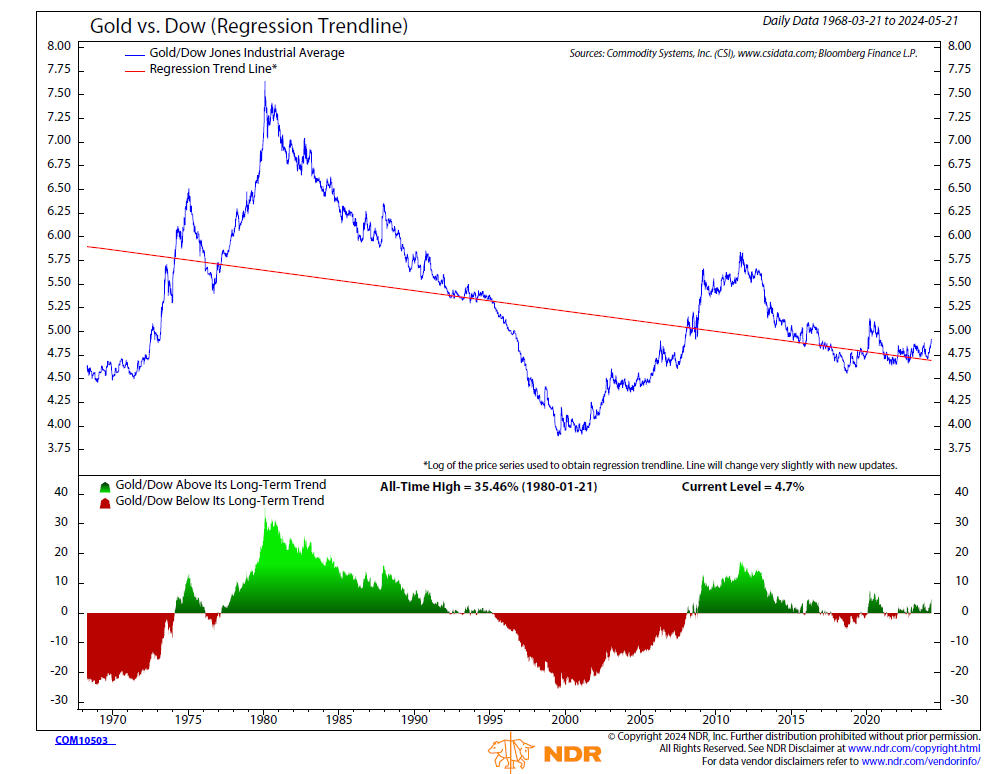
At present, the chart is just above the trendline, somewhat neutral, but not extended on a long-term basis. Much like stocks, gold is currently at all-time highs. I have no strong opinions on its future, other than we have no plans to re-allocate to this area in our portfolios. But if it will make you sleep at night, you’re more than welcome to call us and ask us to put an allocation in your account(s). Just remember—it’s a hunk of metal.
529 Account Expenses (What Is, And What Isn’t)
As many of you know, a 529 plan is a tax-advantaged account dedicated for future educational expenses, which allows contributions to grow tax-deferred, and withdrawals are tax-free if used for qualified education expenses. It’s easy to set up a plan and contribute, but it’s important to know the rules about taking money out. What’s considered a qualified expense?
First is tuition, at any eligible institution, which can include not only colleges, but private high schools and various trade schools (we even confirmed the San Francisco Ballet for a client). Then there are books and school supplies required for enrollment, along with computers, printers, software and even internet access. Finally, room and board qualifies, as long as the student is enrolled for at least half-time. And off-campus housing also qualifies, but you cannot claim more than what the cost would be for on-campus housing.
For instance, if you are paying $1500 per month for an off-campus apartment for your student, and on-campus housing only costs $1200, you have to go with the lower number. All in all, it’s important you don’t make withdrawals in a given academic year that exceed adjusted qualified higher education expenses (QHEE). The financial aid office from the college or university should be able to calculate this for you.
Importantly, below is a list of expenses that don’t qualify:
Transportation
Student Loans
Insurance and Medical Expenses
Fitness Club Memberships
School Sponsored Clubs
College Counseling Services
If you do pay for non-qualified expenses, you’ll be liable for tax on the earnings portion of the withdrawal, plus a 10% federal penalty, and it’s possible you might also owe on the earnings portion at the state level. Some states give tax deductions when you contribute, and it’s possible those deductions might have to be paid back as well.
Simple advice. Don’t take withdrawals for non-qualified expenses.
Auto And Homeowners Insurance Update
The Consumer Price Index may have risen 3.4% in the last 12 months, but that’s sure not reflecting what is happening with auto and homeowners insurance policies in California and other states. On the auto side, I’ve been with AAA of Southern California for 36 years. Our renewal just came in at +9.5%. State Farm received a statewide 21% increase effective February 2024.
Other companies, including Farmers, Geico, Allstate, Mercury, Progressive and USAA have had increases since 2023 ranging from 14% to 43%. Not only are cars getting more expensive (used and new), but FIXING cars is getting more expensive, and the insurers have no choice but to pass these costs along to consumers.
On the homeowners side, State Farm is non-renewing 30,000 homes beginning July 2024. This represents 1% of the total homes insured in California. For all renewals, their rate increase was 20% (in March 2024, the Department of Insurance approved a general rate increase of 20%). Many companies are pulling out of California entirely, including AmGuard, a division of Berkshire Hathaway, that is the carrier that insures our home in Yorba Linda.
If we’re unable to find a company willing to write a policy, we’ll have no choice but to resort to the insurer of last resort, California’s FAIR Plan (what an oxymoron!). Substantial increases in premiums from FAIR Plan are also expected, as the plan added 15,000 new policies in February, the most ever, and has doubled in size since September 2019, according to state officials.
Bottom line, there are substantial increases in the costs for labor, materials, lumber and overall repairs to homes, along with huge losses from fires and water damage. According to published reports, the insurance industry in the past two years has racked up losses that have exceeded the prior 10 years of profits. That of course, is unsustainable.
If you’ve not already received a renewal with a double-digit increase, or worse, a cancellation, be aware. It’s coming. The cost of enjoying California’s mostly beautiful climate is getting more expensive every day.
Warren Buffet Is Just Average
Just like the gold bugs above, some of whom will never reason with data, the same can be true about the aficionados of Berkshire Hathaway, and their co-founder Warren Buffet. Virtually every superstar manager in finance eventually gets to a size where they can no longer duplicate their success of the past. It’s happened to Bill Gross in bonds, and many others, and Buffet is no exception. From 1980 to 2003, the stock of Berkshire Hathaway compounded at nearly 28% per annum, over double that of the S&P 500 at 12.8%.
That edge has disappeared. For the 20 years ended December 31, 2023, it’s now 9.76% for Berkshire and 9.5% for the S&P 500. In the last 15 years, Berkshire has actually lagged the index at 13.79% annually versus 14.73% for the index. What happened? Just the passage of time and innovation. You simply can’t replicate the market environment he had in the 1970s and 1980s compared to today. He and his team are managing significantly more money, in $billions rather than $millions, and the bigger you get, the harder it is to grow and have an edge. Plus, today, everyone has similar information thanks to technology.
This doesn’t mean that Buffet is bad. That’s hardly the case. His success and philosophy has benefited thousands, if not millions of investors. Just don’t think it’s repeatable from current levels, especially since he won’t be around much longer. Today, owning Berkshire is essentially a bet on 6 companies, as Apple, Bank of America, American Express, Coca-Cola, Chevron and Occidental Petroleum make up 81% of the firm’s investment, with Apple a staggering 40%. Full disclosure. We actually own Berkshire in our relative strength stock strategy account, but it’s for purely technical reasons, not fundamental. The stock has been leading the market in recent months, and our process is we’ll own it until that stops. Good luck, Warren.
TABR Portfolio Update
At present, our tactical portfolios remain fully invested in equity allocations at 100% and in high yield bond funds. All risk models are bullish, with most breadth indicators confirming recent new highs. If conventional wisdom has its way, I’m not expecting problems in the stock market until later in the year.
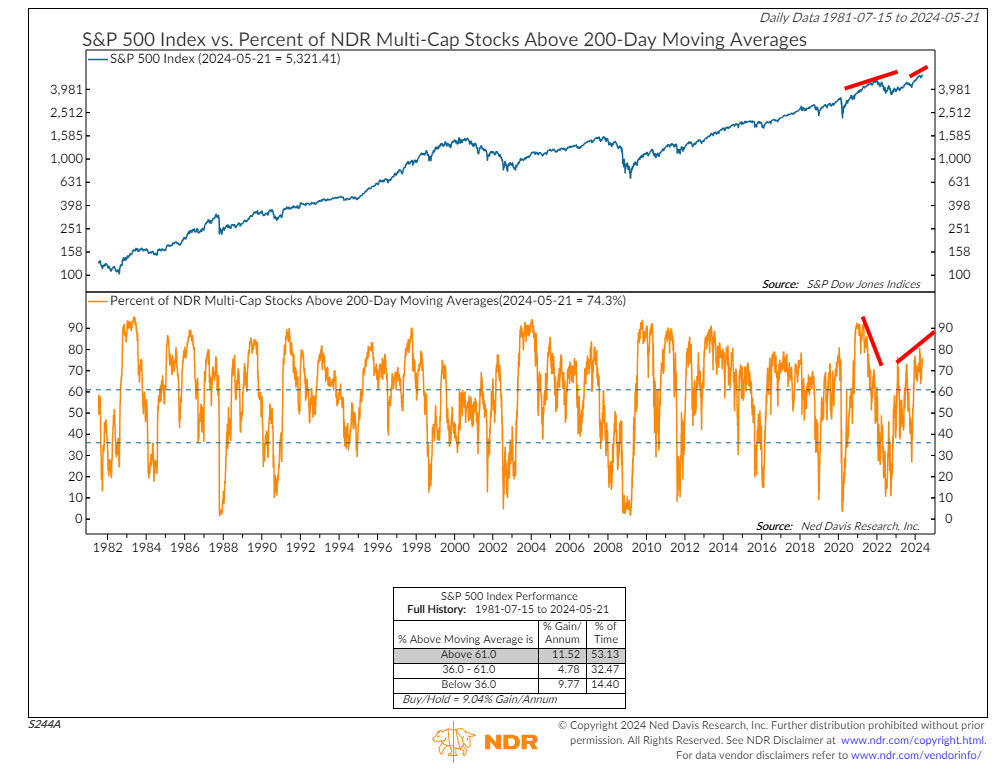
As shown above in the chart courtesy of Ned Davis Research, the percentage of stocks above their 200-day moving average remains robust at over 74%. At the last major top in late 2021, this percentage was negatively diverging in a significant manner. The stock market continues to be led by technology and the Magnificent 7 stocks, which comprise nearly 30% of the S&P 500. When these stocks falter, so will the major indexes.
A Grand Champion
In late April, our daughter Caroline along with the rest of her Dressage Team from Cal Poly San Luis Obispo competed in the National Finals held at Tryon, North Carolina. For those of you unfamiliar with what Dressage is (as I was until she got involved), according to Wikipedia, “As an equestrian sport defined by the International Equestrian Federation, dressage is described as “the highest expression of horse training” where “horse and rider are expected to perform from memory a series of predetermined movements.”
Caroline competed in the Novice division, since she is new to the sport, as well performing for the team. Their team finished in 10th place out of 12 schools, but Caroline as an individual originally finished in 2nd place out of 12 girls, which was just outstanding. The next day, she found out that the first place girl had been disqualified for a violation of certain rules, so presto, Caroline was crowned Grand Champion. See below. The trophy was so large, they had to give her a special suitcase so she could transport it home. Pretty cool stuff!

Material Of A Less Serious Nature
A reporter at a ball game said to an old guy sitting next to his wife, “What’s your secret to 50 years of a happy and successful marriage?”
The old man replied, “I’m going to tell you a story. Some 45 years ago, we were on a trip. We were horseback riding. Just the two of us. Out of nowhere, her horse went crazy, and threw her to the ground. She calmly got up, dusted herself off and said to the horse, “That’s One.”
She got back on the horse and we continued our ride. After awhile, the horse threw her off again. She calmly got up, dusted herself off and said to the horse, “That’s Two.”
She got back on the horse and we continued our ride. I was amazed at how calm my wife remained. After awhile and for the third time, the horse threw her off yet again.
My wife calmly got up, dusted herself off, grabbed the shotgun and shot the horse in the face, and it keeled over.
I was shocked by what I had seen, and started yelling at her and calling her crazy and insane.
My wife, however, kept looking at me calmly, and once I had finished, she said “That’s One.”
To many of you who may be enjoying a high school or college graduation of a child or grandchild, enjoy this special time of year. Summer is almost upon us, and the weather in Southern California and elsewhere is beginning to reflect that, even with some snow still on Mammoth Mountain. Meanwhile, my Dallas Stars are 50% of the way through the most difficult path in pro sports, the road to the Stanley Cup. Eight down, eight to go, starting tomorrow night in the Western Conference Finals. In 1999-2000, the only time Dallas has won the Cup, their theme song was “Nothing Else Matters,” from Metallica. If you’re a hockey fan and your team is still playing in mid-May, no explanation is necessary.
Thanks for your trust and confidence in all of us at TABR.
Sincerely,
Bob Kargenian, CMT
President
TABR Capital Management, LLC (“TABR”) is an SEC registered investment advisor with its principal place of business in the state of California. TABR and its representatives are in compliance with the current notice filing and registration requirements imposed upon registered investment advisors by those states in which TABR maintains clients. TABR may only transact business in those states in which it is notice filed, or qualifies for an exemption or exclusion from notice filing requirements.
This newsletter is limited to the dissemination of general information pertaining to our investment advisory/management services. Any subsequent, direct communication by TABR with a prospective client shall be conducted by a representative that is either registered or qualifies for an exemption or exclusion from registration in the state where the prospective client resides. For information pertaining to the registration status of TABR, please contact TABR or refer to the Investment Advisor Disclosure web site (www.adviserinfo.sec.gov).
The TABR Model Portfolios are allocated in a range of investments according to TABR’s proprietary investment strategies. TABR’s proprietary investment strategies are allocated amongst individual stocks, bonds, mutual funds, ETFs and other instruments with a view towards income and/or capital appreciation depending on the specific allocation employed by each Model Portfolio. TABR tracks the performance of each Model Portfolio in an actual account that is charged TABR’s investment management fees in the exact manner as would an actual client account. Therefore the performance shown is net of TABR’s investment management fees, and also reflect the deduction of transaction and custodial charges, if any.
Comparison of the TABR Model Portfolios to the Vanguard Total Stock Index Fund, the Vanguard Total International Stock Fund, the Vanguard Total Bond Index Fund and the S&P 500 Index is for illustrative purposes only and the volatility of the indices used for comparison may be materially different from the volatility of the TABR Model Portfolios due to varying degrees of diversification and/or other factors.
Past performance of the TABR Model Portfolios may not be indicative of future results and the performance of a specific individual client account may vary substantially from the composite results above in part because client accounts may be allocated among several portfolios. Different types of investments involve varying degrees of risk, and there can be no assurance that any specific investment will be profitable
For additional information about TABR, including fees and services, send for our disclosure statement as set forth on Form ADV from us using the contact information herein. Please read the disclosure statement carefully before you invest or send money.
A list of all recommendations made by TABR within the immediately preceding one year is available upon request at no charge. The sample client experiences described herein are included for illustrative purposes and there can be no assurance that TABR will be able to achieve similar results in comparable situations. No portion of this writing is to be interpreted as a testimonial or endorsement of TABR’s investment advisory services and it is not known whether the clients referenced approve of TABR or its services.

