Should You Be Fearful When Others Are Greedy? Truck Yeah!
For those of you unfamiliar, our monthly headline is based on one of Warren Buffet’s famous quotes. OK, maybe not the Truck Yeah! (That’s my tribute to Tim McGraw). But you get the message. There’s actually a 73% probability that stocks will gain ground in 2025. Enjoy your Christmas, as the odds suggest a much grimmer Long Run.
Inside, we’ll explore some long-term valuation data, an update on the Value Line MAP indicator, the high yield bond market, the crazy speculation going on, and cycles for 2025.
And, don’t forget the Christmas humor. Finally, we found one of the most touching Christmas videos you might ever come across. Read on.
Playing The Odds—Short And Long Term
The stock market, as measured by the Vanguard S&P 500 Fund (VFINX), posted a total return gain of 26.11% last year, and is up a near identical 25.85% year-to-date through December 20. Can it go up again next year? Isn’t it too high? The answer to both of those questions is Yes. Statistically, what happens in 2025 is not related necessarily to what happens this year. Since 1926, stocks as measured by the S&P 500 have risen on a calendar year basis about 73% of the time. That’s about 3 of every 4 years. Hence, the odds, regardless of valuations.
But, don’t valuations matter? Yes, they do. But not in the short term. Only in the long term. And for these purposes, we’ll focus on the long term being 10 years. Perhaps the favorite indicator for Buffett regarding longer term valuations is market capitalization to GDP (Gross Domestic Product). The 30-year average of this ratio (1995-to-date) is a “modern era” median of 106%, yet today this has grown to 206%. A similar indicator is shown below, courtesy of our friends at Ned Davis Research (www.ndr.com).
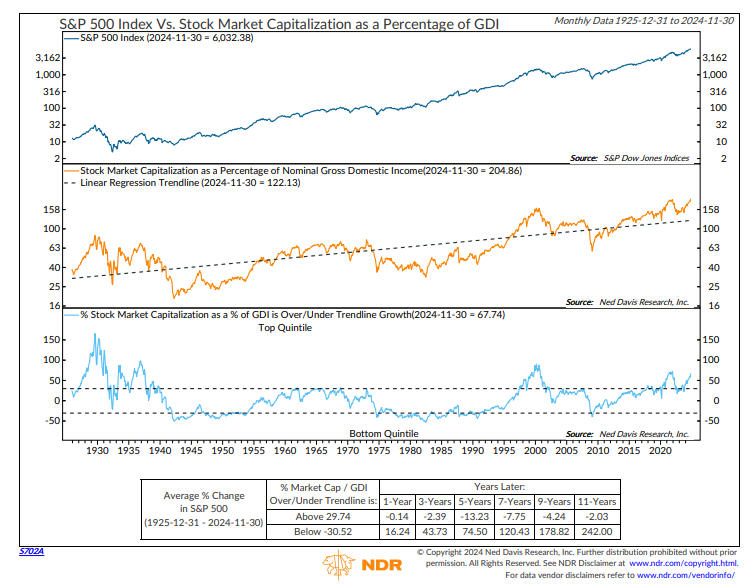
The chart above depicts market cap as a percentage of GDI (Gross Domestic Income). It’s currently 67% above its trendline going back to 1926. On average, when in this mode, 9 to 11 years later the S&P 500 has barely had a positive return (including dividends).
Perhaps as a result of this, Buffet has been raising cash, and his company, Berkshire Hathaway, is now sitting on over $300 billion in cash, at 28% of assets, and the highest percentage since 2004. Look at some of the data below on Apple stock, his largest holding. The chart is courtesy of Charlie Bilello and his team at Creative Planning.
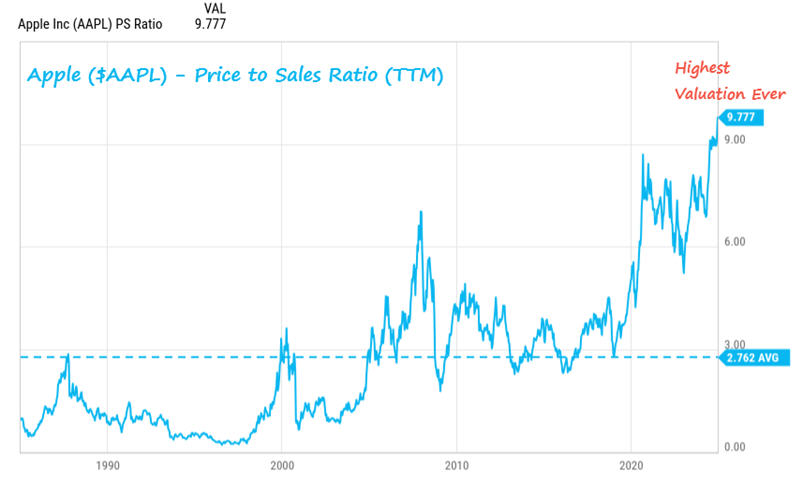

The stock is now trading at nearly 10 times sales, the highest ratio ever. It also trades at over 41 times earnings. According to Bilello, when Buffett first began to build his position in Apple, the stock was trading for 10 times earnings. Perhaps this is why he has sold some 67% of his position in 2024 through the 3rd quarter of 2024. If one of the greatest value investors in history thinks stocks are expensive (he’s done similar selling this year in Bank of America), don’t you think one should pay attention?
My opinion—if investors think the top 10 stocks in the S&P 500 (Apple, Microsoft, Nvidia, Meta, Amazon, Google, Tesla and others) are going to keep growing as they have in the last 10 to 15 years, they are invoking the four most famous words in investing made popular by the late John Templeton—“This time is different.” In 1999, the excuse was the internet. Today, the excuse is AI (artificial intelligence). I’m saying the data says differently.
Another way to look at the long term trend is below, using trend channel data from Ned Davis Research. The designated alphabet letters mark secular stock market lows and peaks going back to 1932.
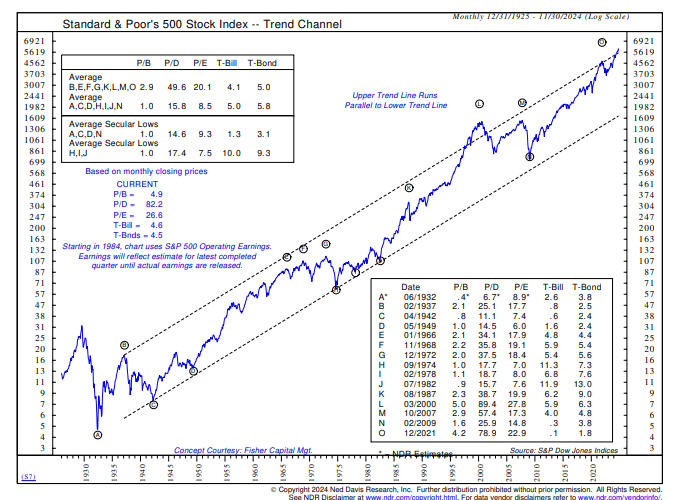
Stocks are currently above the long-term trend channel, where historically they don’t stay very long. At the previous secular peaks since 1937, the average price to book value ratio was 2.9, and today it is 4.9. The average price to dividend ratio was 49.6 versus today’s value of 82.2 and the average price to earnings ratio was 20.1 with today’s P/E at 26.6. These valuations are nearly matching the peaks in March of 2000 and significantly above those of December 2021.
The former resulted in a -45% drop in the S&P 500 spread over three years (and a -80% loss in the NASDAQ) while the more recent peak essentially in January 2022 led to a -25% decline. Bottom line—stocks are priced today (at least large companies) with very little margin of safety, with several models estimating 2-4% annual nominal returns for the next 10 years, with much more downside risk.
Speculation Gone Wild
It is impossible to know when the stock market has peaked, or will peak. Our risk models are not designed to forecast tops or bottoms, but rather to react to changes in trend. But there are certainly clues when things get excessive, both on the upside and the downside. We believe we’re at that juncture.
Analyst David Steets of SystematicIndividualInvestor.com wrote this past week the following. “Numbers across the board show massive retail buying that is now moving into the most speculative areas of the market: Leveraged single stock ETFs have reached record high AUM (assets under management), while speculative option volume is closing in on the 2021 all-time highs. All positioning data is currently indicating extremes.”
This is illustrated in the chart below, courtesy of Ned Davis Research. It shows that 50-day average daily flows into equity ETFs hit a recent record high of $4.7 billion.
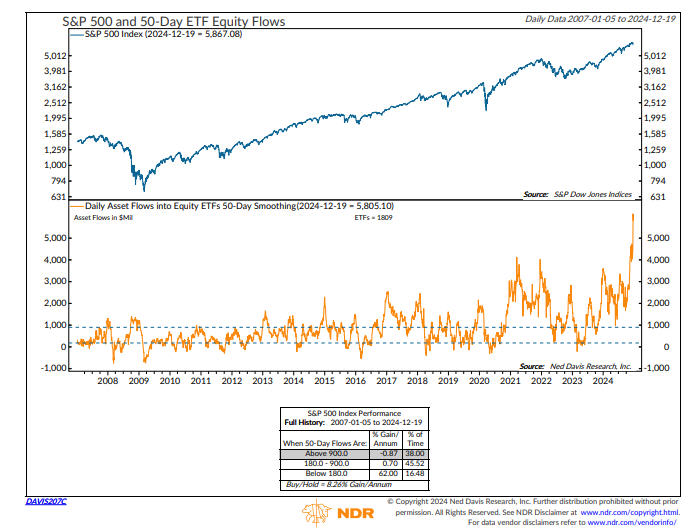
As shown in the mode box in the bottom clip, the stock market has been in this mode 38% of the time since 2007 and has on average, lost money. And if you think Bitcoin is ridiculous, just look at what it spawned.
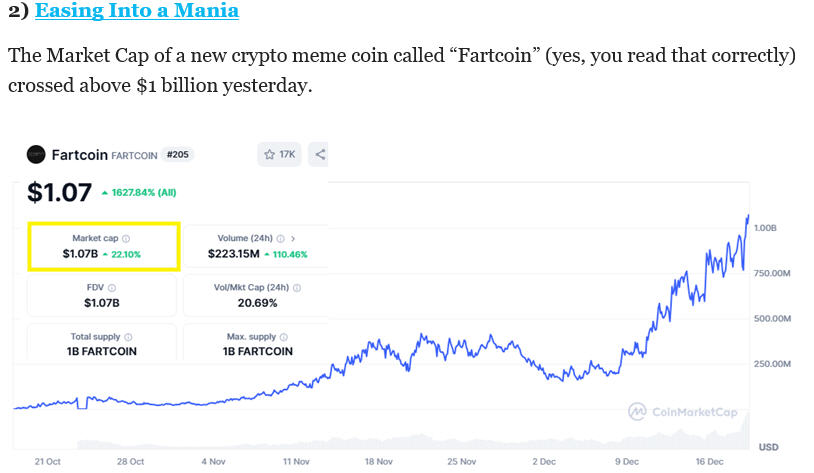
The above chart and note are also courtesy of @CharlieBilello and Creative Planning Network. This is the latest cryptocurrency one can speculate in. Absolutely nothing behind it but a name and a computer network. Wall Street has managed to make Bitcoin appear legitimate, all in the name of another revenue source, but please don’t call it investing. Good luck to all of those who are playing. Just know what you’re dealing with. They are more appropriately called, as more than one analyst has written—$hitcoins. This is the kind of behavior that goes on at major market peaks.
The Value Line MAP (update)
We’ve written about this little known indicator in the past, having followed it for many years now, both from subscribing to the Value Line Investment Survey, and then seeing how Ned Davis Research has used it as an indicator, along with others. The Value Line MAP, which stands for Median Appreciation Potential, is the median estimated three to five year price appreciation potential of all stocks in the Value Line universe, which is 1700 stocks.
Weekly readings go back to the 1960s. In general, low readings in the 25% to 35% range indicate market tops, while readings in the 85% to 100% range and up tend to be low-risk market bottom areas, but the upper limit in history has at times even exceeded 200%. The indicator reached 140% during the Covid panic and then dropped to 35% in January 2022, which marked a major top. The indicator then bottomed at 85% in late October 2022, which was virtually the exact bottom, and we actually used that signal to increase equity exposure by about 5%.
Well, look where the indicator is now. See below.
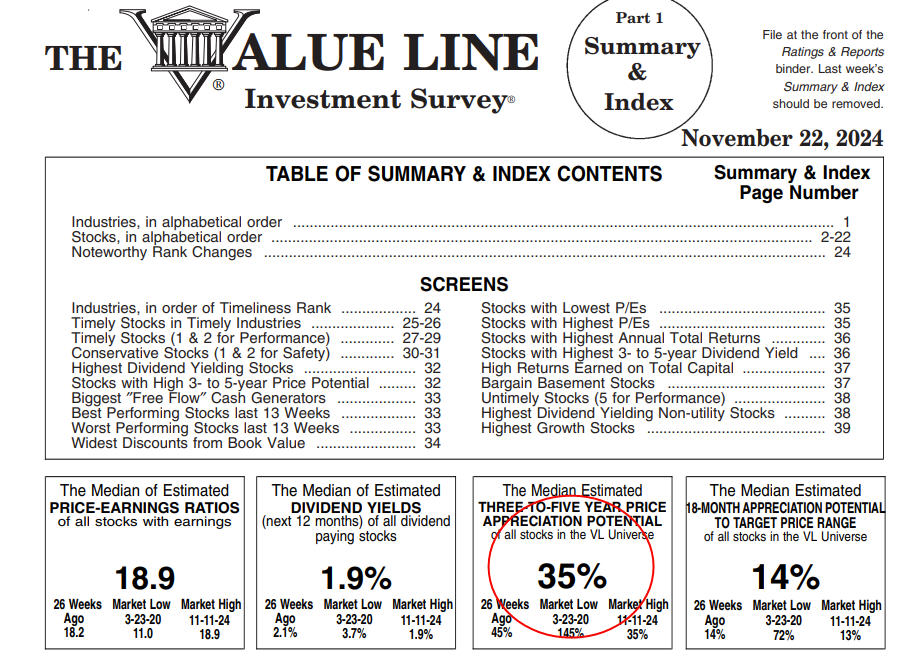
In mid-November, the indicator once again breached the 35% level. It’s actually been as low as 25% in history, and we need a fact check on this, it may have even hit 15% (we are looking for our past data). Nevertheless, we think this is just another nail in the coffin for the stock market. The S&P 500 was at basically 6000 when the indicator recently reached 35%. As we’ll outline below, other internal indicators we follow, mainly breadth, suggest that stocks were confirming the new highs in early December, which historically means higher highs later accompanied by negative divergences. That’s certainly plausible. But, here’s a really good bet. By the time the VLMAP retreats back to at least 85%, there’s an extremely high probability that the S&P 500 Index will be much lower than it is today. Consider the recent reading a strong SELL signal.
The Message In High Yield Credit
Our favorite area of the bond market, going back to the late 1980s, are high yield bond mutual funds. In our view, they are the best alternative to the stock market, with better trending characteristics and risk/reward, especially with an effective risk management model.
Below is an updated chart of the Blackrock High Yield Bond Fund, one of about 6 that we currently own in client accounts.
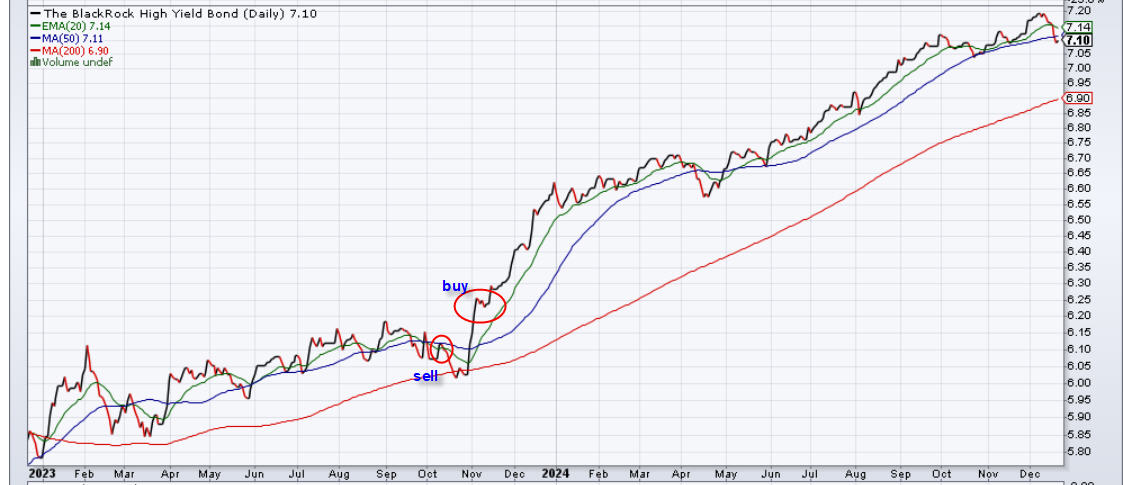
We’ve circled in blue our last two signals, a SELL in early October of last year, followed by a BUY in early November (that’s called a whipsaw!). That BUY signal has now been in force for over 13 months, one of, if not the longest in the history of our model. As has been said, as credit goes, so goes the stock market. Based on the last three full months of dividend payouts, the yield on the fund is at about 6.87%, but high yield credit spreads are now at their lowest level in about 17 years.
I don’t see much upside from current levels, though spreads COULD go even lower. However, our model took a hit this week, and if weakness continues, a SELL signal may be in the offing. When that happens, I’ll be a lot more concerned about the near-term outlook for stocks.
Why 2025 Could Be Good
Despite the concern about stock valuations, there’s nothing that says stocks cannot go up three years in a row. Arguing for that outcome is the 2025 Cycle Composite for the S&P 500, as computed by Ned Davis Research. It is shown below.
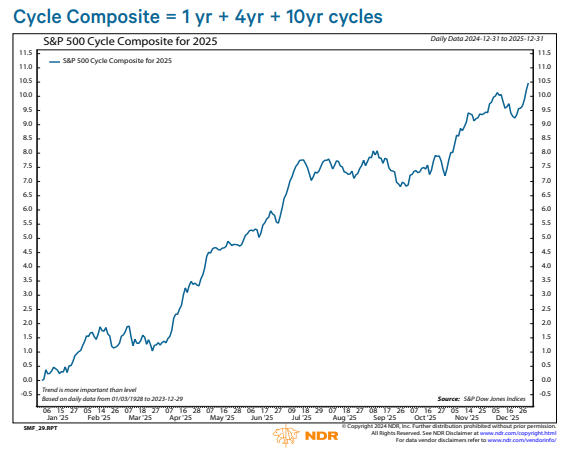
The composite is made up of the 1-year cycle, the 4-year Presidential election cycle, and the Decennial cycle. The outlook calls for a continuing uptrend until about mid-year, with probable weakness in the 3rd quarter and a year-end recovery. Notably, this is what the Decennial Cycle calls for.
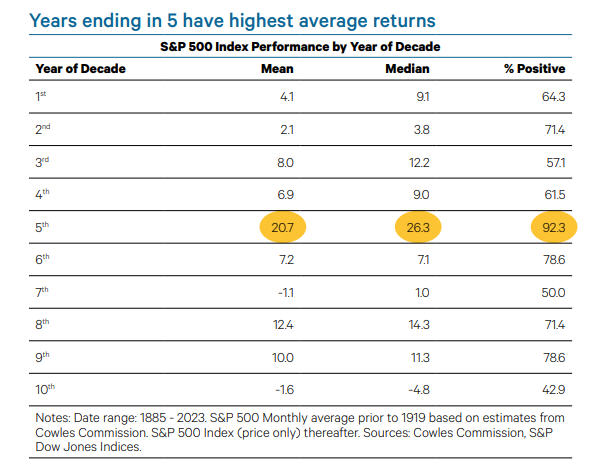
Years ending in 5 have shown the best gains of any year in the decade, with mean returns of over 20% and a 92% success rate, which is higher than the baseline 1-year performance of 73% noted at the beginning of this update. Below are the year-by-year results.
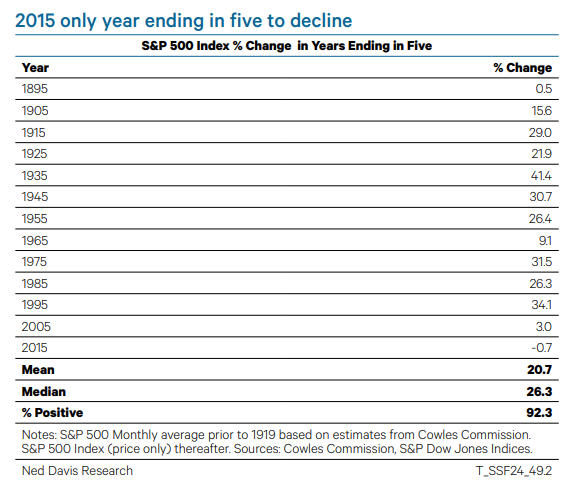
As you can see, there has been only one year with a negative return, and that was in 2015 with less than a -1% loss. There’s hope, but here’s my concern. Statistically, there’s no meaning in this phenomenon, with only 13 data points. We’ll see.
Portfolio Allocations
As noted above, TABR’s risk management model for high yield bond funds is still currently on its November 2023 BUY, but is weakening substantially. We don’t act, though, until there is a signal. On stocks, our shortest term risk management model turned negative last Monday after a great three-month BUY, and we reduced tactical equity exposure to about 66%, now holding 34% in cash. That was extremely timely, given Wednesday’s wipeout.
There are now only 6 trading days left in the year, and stocks are normally positive during this period. They are oversold on a short term basis, so how stocks behave in the next few weeks, perhaps especially after January 1, should be quite telling.
This is a good time for the following reminder. Our process is designed to exit stocks and bonds during truly wealth-destroying declines and we rely upon a variety of technical and trend-following models to do so. We don’t listen to all the rhetoric about the record levels of government debt, world conflicts, or god forbid, what’s going to happen on or after January 20. We simply let the market tell us where it’s going. We suggest that investors do the same.
Material Of A Less Serious Nature
Well, I’ll never be asked to go caroling at the psychiatric hospital again. In hindsight, I guess singing “Do You Hear What I Hear,” wasn’t such a great idea.
A man from Texas is vacationing in Mexico and spends his day roaming around, taking in the sights.
In the evening, he goes to a fancy restaurant for dinner.
As he sits there, sipping his tequila, he notices a couple at the table next to him. They were being served a beautifully garnished dish with two gigantic meatballs in the middle.
When the waiter asks for his order, the man inquires about the meatball dish.
The waiter replies, “Ah, sen~or, you have excellent taste.” “Those are called Criadillas de toro. They are the bull testicles from the morning bullfight. A real delicacy.”
“Well, what the heck,” the man said. “Bring me an order.”
The waiter replied, “Oh, no, I’m sorry sen~or. There’s only one serving per day, because there’s only one bullfight each morning. If you come tomorrow early and place your order, we’ll be sure to serve you the delicacy.”
The next morning, the man returned and placed the order. That evening, he was served the one and only delicacy of the day.
After a few bites, inspecting his platter, the man called the waiter over and said, “These are delicious, but they are much, much smaller than the ones I saw yesterday.”
The waiter shrugged his shoulders and said, “Si, sen~or. Sometimes, the bull wins.”
Finally, I encourage you to take a few minutes and listen and watch the reel on the link below.
I promise, it will touch your heart.
https://www.instagram.com/reel/DB3pOBjxEzf/?igsh=MTc4MmM1YmI2Ng%3D%3D
All of us at TABR want to extend our heartfelt thanks to you, for allowing us to serve you. May you and all of your loved ones be blessed with a Happy Hanukkah, a Merry Christmas and a wonderful New Year.
Sincerely,
Bob Kargenian, CMT
President
TABR Capital Management, LLC (“TABR”) is an SEC registered investment advisor with its principal place of business in the state of California. TABR and its representatives are in compliance with the current notice filing and registration requirements imposed upon registered investment advisors by those states in which TABR maintains clients. TABR may only transact business in those states in which it is notice filed, or qualifies for an exemption or exclusion from notice filing requirements.
This newsletter is limited to the dissemination of general information pertaining to our investment advisory/management services. Any subsequent, direct communication by TABR with a prospective client shall be conducted by a representative that is either registered or qualifies for an exemption or exclusion from registration in the state where the prospective client resides. For information pertaining to the registration status of TABR, please contact TABR or refer to the Investment Advisor Disclosure web site (www.adviserinfo.sec.gov).
The TABR Model Portfolios are allocated in a range of investments according to TABR’s proprietary investment strategies. TABR’s proprietary investment strategies are allocated amongst individual stocks, bonds, mutual funds, ETFs and other instruments with a view towards income and/or capital appreciation depending on the specific allocation employed by each Model Portfolio. TABR tracks the performance of each Model Portfolio in an actual account that is charged TABR’s investment management fees in the exact manner as would an actual client account. Therefore the performance shown is net of TABR’s investment management fees, and also reflect the deduction of transaction and custodial charges, if any.
Comparison of the TABR Model Portfolios to the Vanguard Total Stock Index Fund, the Vanguard Total International Stock Fund, the Vanguard Total Bond Index Fund and the S&P 500 Index is for illustrative purposes only and the volatility of the indices used for comparison may be materially different from the volatility of the TABR Model Portfolios due to varying degrees of diversification and/or other factors.
Past performance of the TABR Model Portfolios may not be indicative of future results and the performance of a specific individual client account may vary substantially from the composite results above in part because client accounts may be allocated among several portfolios. Different types of investments involve varying degrees of risk, and there can be no assurance that any specific investment will be profitable
For additional information about TABR, including fees and services, send for our disclosure statement as set forth on Form ADV from us using the contact information herein. Please read the disclosure statement carefully before you invest or send money.
A list of all recommendations made by TABR within the immediately preceding one year is available upon request at no charge. The sample client experiences described herein are included for illustrative purposes and there can be no assurance that TABR will be able to achieve similar results in comparable situations. No portion of this writing is to be interpreted as a testimonial or endorsement of TABR’s investment advisory services and it is not known whether the clients referenced approve of TABR or its services.

