The Trump Tariffs and a Market Update
You may have woken up yesterday morning to a headline similar to one of the first I saw: Trump Tariffs Wipe Out Nearly $2T From Stocks. This morning’s Wall Street Journal page 1 headline was: Stocks Suffer Steepest Slide Since 2020. In today’s newsletter, I’ll put these headlines into context, let you know how we’re positioned, and discuss our plan as the tariffs play out. First, here is a little background information.
The S&P 500, one of the most widely followed stock indexes, closed at 5,670.97 Wednesday and closed at 5,074.08 today, a two-day drop of about 10.5%. That’s a big drop, to say the least. In the last year, the S&P 500 climbed from 5,147.21 on April 4, 2024, to a peak of 6,147.43 on February 19, 2025, and is now about 1% below where it was 12 months ago. The questions on everyone’s mind are what will happen from here and what the plan is if the market continues to decline, so read on.
According to a report we just received from Ned Davis Research, this week’s reciprocal tariffs were hastily determined by simply taking US trading partners’ economic exports to the US as a percentage of its trade balance. The administration didn’t include calculations of non-tariff trade barriers, so the NDR report’s authors speculate that the apparent lack of effort could indicate the Trump Administration doesn’t plan to keep the tariffs for long.
Others have long assumed that Trump is using the tariffs as a bargaining chip to receive other concessions in upcoming negotiations. Nobody knows if these tariffs are here to stay, but we do know what happened during the first Trump Presidential term. The Capital Group sent us some interesting research about that yesterday, and the slide below helps put the tariffs in context. You can click on the slide if you’d like to view the full report.
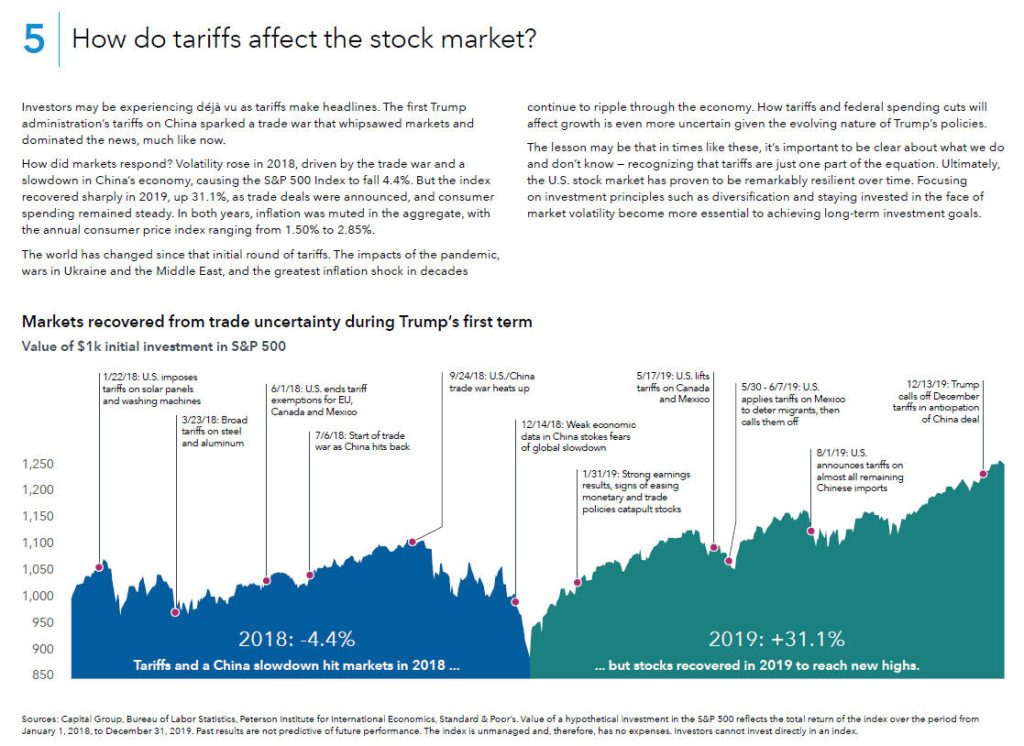
The tariffs increased stock market volatility and resulted in losses in 2018, but stocks recovered in 2019 and reached new highs. While we don’t know what will happen this time, we are prepared to act either way. We’ve only had between 20% and 40% of our maximum stock exposure since March 5 due to a few of our investment models turning negative as 2025 has progressed. There are more details on this in the TABR Investment Allocations section below, which Bob has written.
TABR Investment Allocations
With the recent decline, stocks are in their steepest decline since early 2020. Though the S&P 500 Index hasn’t quite reached the -20% decline level that is commonly associated with a bear market, the NDX 100 (QQQ), S&P 400 (mid-caps) and S&P 600 (small caps) have already breached this level. Given the chart below, courtesy of www.stockcharts.com, it may only be a matter of time before the S&P 500 joins the list, maybe even as early as Monday.
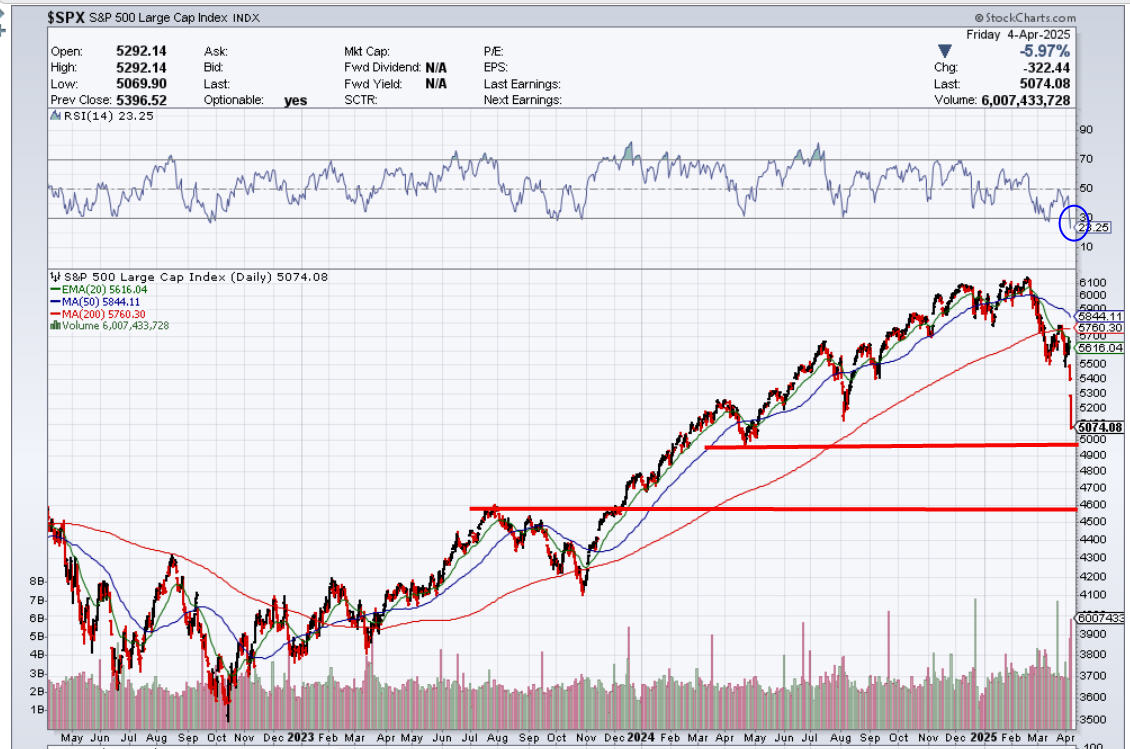
As one can see above, there is chart support at the 4950-5000 level on the S&P, as drawn by the upper horizontal line. That’s less than 2% away from Friday’s close. Below that is the July 2023 peak around the 4600 level, as depicted by the lower horizontal bar. That’s over -9% lower, but given the near vertical descent, we are reminded that anything can happen in the stock market. The market is very compressed on the downside, closing on Friday nearly -7% below it’s bottom 3% trading band and some -10% below its 21-day moving average. Down volume to up volume reached near 88% on Thursday, and appears to have reached the magic 90% level on Friday, indicating washout conditions.
A rally, and a very sharp one, could occur at any time, including Monday, but it could also come after a Monday crash-type event. There’s simply no way to know, nor to guess, given that there could be market-moving news out of Washington during the weekend to try and soothe the markets (or not!).
At present, three of our five stock market risk models are negative, which means that in tactical accounts, we have only about 40% of maximum equity exposure, with the balance sitting in cash (SPRXX), earning a comforting 4% annualized yield. Our shortest term model gave a BUY on March 17, which at present is looking like a big DUD, but over time, this model has been perhaps the most effective of the 5 we use. Sometimes, even the best models have bad trades, but this is also why we do not rely on only ONE model for stocks.
One of the perplexing things of this recent decline, which looks more and more like a bear market, is the tenacity of the BUY signal from our high yield bond fund trading model. Normally, big declines in stocks come AFTER this model turns negative, but that hasn’t been the case. After being positive for nearly 17 months, that model has turned negative, and we sold 50% of our positions today (Friday), with the rest on Monday, in deference to the discipline of our process. Those funds are being shifted into ultra-short bond funds to just sit and wait until the next BUY signal. The odds are, it will likely be a lot sooner than 17 months from now.
In our December and January updates, we have been warning of an extremely overvalued stock market. The good times don’t last forever. And here we are. How low can markets go? As low as they want. We’ve had 16 years of prosperity. Just because the stock market is down about -20% from its peak, doesn’t mean it will automatically stop there. Once every 10 to 20 years, there’s a decline that shakes your boots, when stocks go down -30% or even -50% from their peak. That’s why with the majority of our client funds, we use tactical strategies to play defense in negative environments for both stocks and bonds. That’s where we’re at right now. With passive strategies which are fully invested, you don’t change anything. That’s why they call them passive. And we run those strategies for smaller portions of client accounts who wish to take on more risk. Many of you might put your 401 (k) in your workplace plan on auto pilot. That’s easy to do when prices are rising, not so easy now. If you’re tempted to mess with those allocations now because of recent market weakness, it means you’ve been over-invested in stocks. Whatever plan you have, follow it. And if you don’t have one, well, that’s not good.
Brief Overview of the Social Security Fairness Act
This is Steve again, writing on a few financial planning topics of interest.
The Social Security Fairness Act was passed at the end of last year to eliminate the Windfall Elimination Provision (WEP) and Government Pension Offset (GPO). These two rules would reduce Social Security benefits for public employees like teachers, police officers, and firefighters, who may not have paid into Social Security during their working years. These provisions impacted individuals who have worked in both government and private sector jobs by reducing their Social Security benefits.
The WEP reduced Social Security retirement benefits for those who received pensions from non-covered employment (jobs that didn’t withhold Social Security payroll taxes). The GPO reduced or eliminated the Social Security survivor benefits of spouses and widows who also received a pension from non-covered employment. For many Social Security recipients, these provisions resulted in significantly reduced monthly payments, often by hundreds of dollars or more.
As we’ve met with clients who may have been affected, we’re recommending they proactively check to see if their benefits will increase. If you think you’ve been affected, by the WEP or GPO, please click on the graphic below to determine your next steps:
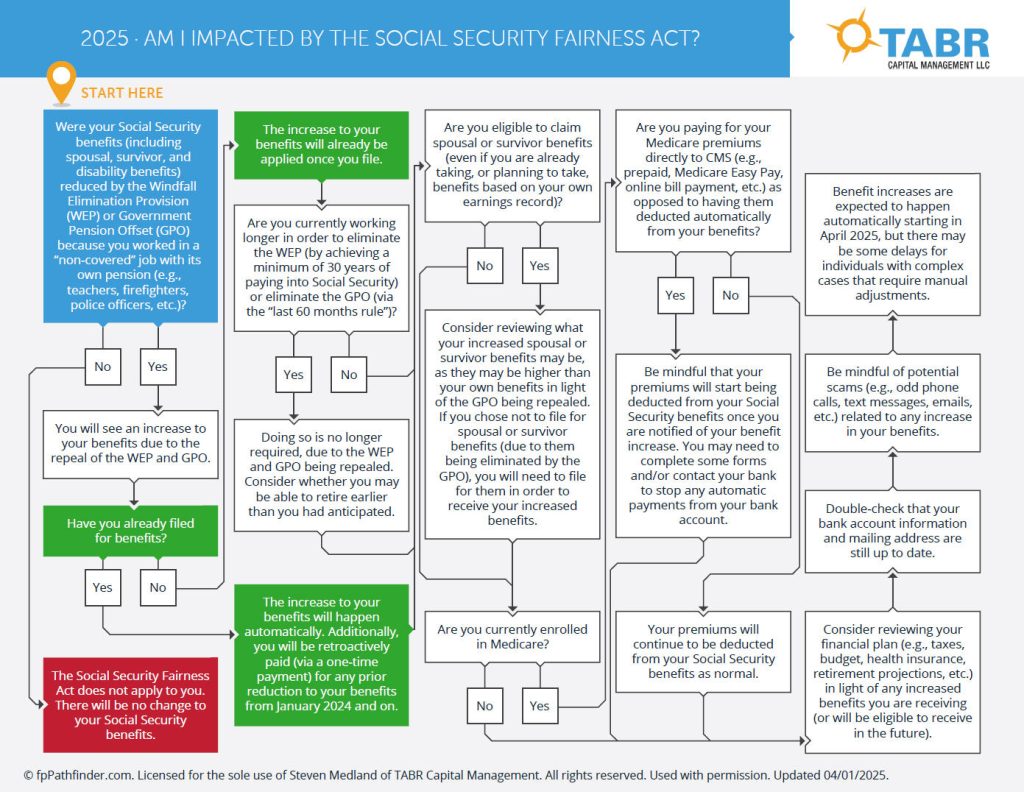
If you have additional questions after reviewing the above flowchart, please call or email us. It’s also a good idea to contact the Social Security Administration (SSA) to ensure you’re receiving your full benefits.
Reminder: IRA Contributions and Income Taxes
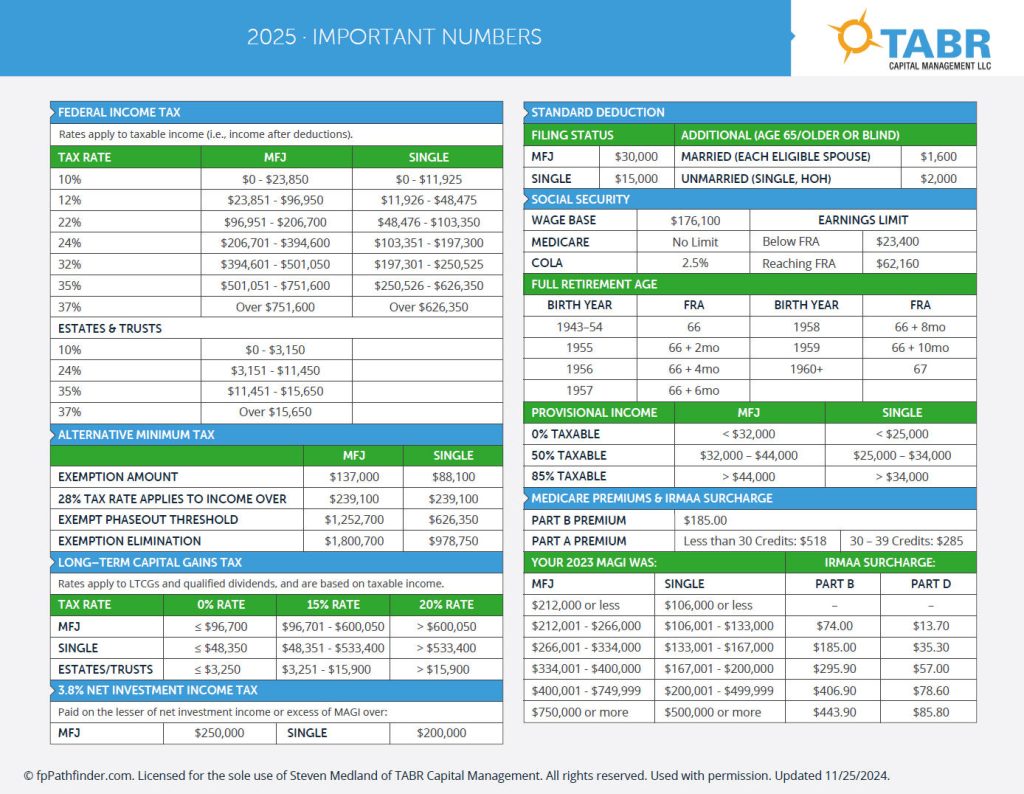
As a quick reminder, if you plan to make a 2024 IRA contribution, it must be made by the income tax deadline on Tuesday, April 15. The 2024 contribution limit for Traditional and Roth IRA accounts is $7,000 (or $8,000 for those 50 and over).
These limits remain the same for 2025, but many of the other IRS numbers have changed.
Please click on the handy summary of all the relevant 2025 tax numbers below, including contribution limits, tax brackets, and more.
Heroic Interview
Last month, I was honored to be interviewed about my book, Spiraling Up: Discover Financial Serenity, Make Work Optional, and Live Happily in Retirement, on a 1-hour segment for Heroic Public Benefit Corporation.
Heroic is a training platform that integrates ancient wisdom and modern science to help individuals show up as the best version of themselves. John Mackey, Co-Founder & former CEO of Whole Foods Market, said, “Heroic is the best self-development platform in the world.” If you’re interested in watching the video, you can click the red play button below.

I’ve been a member of Heroic for years and was also an early investor. I completed my first Spartan Race at a Heroic event in 2022, and my daughter and son, Audrey and Conrad, asked if they could join me for my most recent Spartan Race. The pictures below are from that day. The race was a grueling, muddy 5K with 20 obstacles, but they never gave up. I was so proud of them both.


The Spartan Race is a great metaphor for life’s challenges. With each of the 20 race obstacles, you have to figure out how to go over, under, or through whatever’s in your way. While 2025 is off to a rocky start in the stock market, and I see significant challenges ahead, I’m still optimistic in the long run. One reason for that is you; our amazing clients have stayed the course through the 2008 Global Financial Crisis, the COVID-19 market crash, and most recently, the 2022 bear market.
By sticking to the long-term plan during these downturns, you were positioned for subsequent growth when sanity returned to the markets. TABR is extremely fortunate to have so many wonderful clients entrusting us during these turbulent times. Thank you, as always, for your continued trust and confidence.
Best regards,

Steven W. Medland, MBA, CFP®
Partner
TABR Capital Management, LLC (“TABR”) is an SEC registered investment advisor with its principal place of business in the state of California. TABR and its representatives are in compliance with the current notice filing and registration requirements imposed upon registered investment advisors by those states in which TABR maintains clients. TABR may only transact business in those states in which it is notice filed, or qualifies for an exemption or exclusion from notice filing requirements.
This newsletter is limited to the dissemination of general information pertaining to our investment advisory/management services. Any subsequent, direct communication by TABR with a prospective client shall be conducted by a representative that is either registered or qualifies for an exemption or exclusion from registration in the state where the prospective client resides. For information pertaining to the registration status of TABR, please contact TABR or refer to the Investment Advisor Disclosure web site (www.adviserinfo.sec.gov).
The TABR Model Portfolios are allocated in a range of investments according to TABR’s proprietary investment strategies. TABR’s proprietary investment strategies are allocated amongst individual stocks, bonds, mutual funds, ETFs and other instruments with a view towards income and/or capital appreciation depending on the specific allocation employed by each Model Portfolio. TABR tracks the performance of each Model Portfolio in an actual account that is charged TABR’s investment management fees in the exact manner as would an actual client account. Therefore the performance shown is net of TABR’s investment management fees, and also reflect the deduction of transaction and custodial charges, if any.
Comparison of the TABR Model Portfolios to the Vanguard Total Stock Index Fund, the Vanguard Total International Stock Fund, the Vanguard Total Bond Index Fund and the S&P 500 Index is for illustrative purposes only and the volatility of the indices used for comparison may be materially different from the volatility of the TABR Model Portfolios due to varying degrees of diversification and/or other factors.
Past performance of the TABR Model Portfolios may not be indicative of future results and the performance of a specific individual client account may vary substantially from the composite results above in part because client accounts may be allocated among several portfolios. Different types of investments involve varying degrees of risk, and there can be no assurance that any specific investment will be profitable
For additional information about TABR, including fees and services, send for our disclosure statement as set forth on Form ADV from us using the contact information herein. Please read the disclosure statement carefully before you invest or send money.
A list of all recommendations made by TABR within the immediately preceding one year is available upon request at no charge. The sample client experiences described herein are included for illustrative purposes and there can be no assurance that TABR will be able to achieve similar results in comparable situations. No portion of this writing is to be interpreted as a testimonial or endorsement of TABR’s investment advisory services and it is not known whether the clients referenced approve of TABR or its services.