There Is No Magic Number, And Highlights Of The THNGVBD Act (Terrible, Horrible, No Good, Very Bad Day)
I cringe when I see a personal finance column with a headline such as “You need $2 million to retire.” Maybe it attracts readers, but it’s a really worthless comment. My floor might be your ceiling, or vice versa. We’re all different, with different sets of resources. This month, we’ll touch on this topic a bit. Hint—retirement is different for everyone.
And, unless you’ve been under a rock, you already know that Washington passed what they are calling the OBBBA Act shortly before July 4. That stands for One Big Beautiful Bill Act. I won’t go as far as to say it has something for everyone, but we’ll try and summarize the highlights. As soon as I first heard the acronym, I instantly thought of the children’s book, “Alexander and the Terrible, Horrible, No Good, Very Bad Day.” Another $3.5 Trillion of debt will do that to you.
Finally, we’ll touch on the long term stock market outlook, the not so FAIR Plan and the upcoming poor months of August and September. Humor may be necessary after those months. Read on.
There Is No Magic Number
Picking up on my imaginary headline above, let’s assume a married couple who are currently 60 years old have saved $2 million, not counting any equity in their home. The breakdown is $1.5 million in their combined respective IRA accounts, plus $500,000 in a Trust brokerage account. They’ve each paid into Social Security during their careers. No pensions, no income from other sources. Very straightforward. Can they retire comfortably, and make sure the money lasts into their 90s?
As you’ll see, that depends on a lot of variables. What age are they retiring at? 62? 65? 67? How much do they need to spend in retirement? What are their goals in this area? For the sake of numbers here, let’s just assume they were about to turn 65, and had the above data. We can then assume if we use a 4% return on investments, that the $2 million will generate $80,000 in gross income. Of this, $60,000 will be fully taxable at ordinary income rates, since the money would be withdrawn from their IRA accounts in retirement.
There would be another $20,000 coming from the taxable Trust, but taxes are only paid on dividends/interest and capital gains of the Trust. If they are like many couples we come across, we’ll typically advise them not to touch their Social Security until at least age 67, which today is the full retirement age for many (FRA), which is not to be confused with one’s maximum benefit.
For the sake of the illustration, let’s further assume each spouse had a similar career earnings path, and were eligible for a $3000 gross monthly benefit at age 67. That would equate to $6000 a month starting at age 67, or $72,000 annually. Coupled with the $80,000 of income above, this equals a combined gross of $152,000. But wait. Each of their respective Social Security benefits would grow to about $3720 monthly if they waited until age 70, increasing the annual gross to about $44,640 each.
If at least one of the two spouses did this, now their gross bumps up to about $160,000 annually, and if they both waited to age 70, the total would be around $169,000. Would that be enough? And what do they do between the ages of 65 and 70 for income, if they are delaying Social Security?
We’ll answer the second question first. For the years one has retired but is delaying Social Security, one would begin to take withdrawals from their retirement plan accounts (yes, and pay taxes on them), and then once Social Security payments kick in, we throttle back the withdrawals from the retirement plans.
The first question was, would the $152,000 of gross income be enough for this couple, or the $169,000 in the latter scenario where they both delay? The answer is. . .it depends. It depends on how much this couple is spending monthly, on average, after taxes.
We’ll calculate as best we can the taxes due for this imaginary couple using the scenario of $152,000 of gross income. Assuming they use the standard deduction of $31,500 for married couples, I estimate their taxable income would be just shy of $120,000, and they would owe combined federal and state taxes of $21,000, leaving them with about $129,000 of after-tax income, or about $10,750 per month.
At this point, one can see that we now need to focus on their spending. If their spending needs are say $8000 a month after taxes, they have a nice margin of safety, and might even consider drawing less money out of their plans. But, what if they are spending $12,000 a month or more? This is what planning is all about. There is no magic number. For this couple, having amassed $2 million in savings might very well be fine.
Another couple, though, or individual, might have only saved $1 million and certainly won’t be able to spend $10,000 a month. Or another couple may be spending $20,000 a month, but they’ve amassed $5 million in savings. That might work for them.
In our mind, the only way to figure out what is right for a couple or individual is to dive into the details and do the work. We’re all different, with simple situations and complex ones. Just don’t believe any of the personal finance gurus. There is no magic number.
Highlights Of The Newly Passed Tax Bill
According to a Google search I did on the newly passed tax bill which President Trump signed into law on July 4, the length of the bill was 870 pages long. Imagine having to slog through that, and proof it. Let alone, write it. Simplicity doesn’t jive with Washington.
Below, we’ll touch on the major points we see that will affect the majority of investors and clients. For those of you who are into this stuff and want a detailed breakdown of the entire thing, and are willing to read 33 pages, I’ve provided a link below to a summary created by our friends at Kitces.com, and their Lead Planning Nerds as they are called, Jeff Levine and Ben Moreland, for their research efforts.
Breaking Down The “One Big Beautiful Bill Act”: Impact Of New Laws On Tax Planning
Many of the provisions of the original TCJA (Tax Cuts & Jobs Act of 2017) are made permanent with the new law, including tax brackets, and an increased standard deduction. The State And Local Tax (SALT) deductions, which were capped at $10,000, have been temporarily increased to $40,000, but are phased out for higher income earners at the $500,000 and above level, and the $40,000 limit will revert back to $10,000 beginning in 2030.
In addition, new temporary deductions were added below the line, including a $6,000 deduction for seniors who are age 65+, deductions of up to $25,000 of income from tips and overtime wages, and up to $10,000 of interest paid on qualifying auto loans. Qualifying is the key word there. In addition, the estate tax exclusion was increased to $15 million per person, or $30 million per couple, who otherwise would have faced estate tax rates of up to 40% on the excess. This area is only relevant to the top 1% of the population.
Yes, it’s possible this number could be reduced in the future, but it allows for more long term planning, and for anyone substantially below those numbers (99% of the population), continues to make trust splitting a thing of the past at the death of the first spouse except for specific situations. If you’ve not eliminated this onerous task from your Trust document, you should.
What’s nice about the bill is that the federal tax brackets ranging from 10% to 37% are now permanent, and can only be changed in the future by a new act of Congress. This allows for better planning going forward. There always seems to be this drum beating in certain corners of the personal finance world that tax rates are always going up, and you better do a Roth IRA conversion. Well, guess what? Tax rates aren’t going up any time soon.
Trump campaigned on, among other things, eliminating taxes on Social Security, tips and overtime. Nothing was eliminated, but there were provisions in all three areas with certain qualifications that will expire after 2028. Notably, for those 65 and older, there’s an additional below the line deduction of $6000 per person which fully phases out for singles with income over $175,000 and couples over $250,000. There were no changes to the tax method on Social Security benefits, as has been erroneously reported, but the above will definitely reduce taxes for a large amount of the population 65+ for the next four years.
For those who work in careers where there is overtime pay, deductions of $12,500 for single filers and $25,000 for joint filers are available with phaseouts very generous, at the $150,000 for singles and $300,000 for joint filers. The computation applies only to the amount of income earned over one’s base pay.
Of significant note on the deduction for interest on auto loans, it only applies for loans taken out after December 31, 2024 and only applies to eligible vehicles including new cars, vans, SUVs, pickup trucks and motorcycles. Pre-owned, or used vehicles, are excluded from the benefit.
Lastly, the bill takes away significant incentives that have been in place to promote “clean energy,” removing tax credits ($7500 for new, $4000 for used) for vehicles acquired after September 30, 2025, as well as credits for charging equipment, and for purchasing or installing solar panels.
Needless to say, it will be interesting to see the effect of this on the sales of electric vehicles. Ford and General Motors have been losing $billions of dollars making EVs that mostly nobody wants (partly because they were mandated by the Federal Government), while Tesla has made significant money from selling energy credits, though that has not exceeded the amount the company has generated from car sales. We’re all human and driven by a good deal and incentives, and this legislation will make EVs more expensive. That can’t be good for sales.
Stocks From The Long Term View
Below we’ll touch on the upcoming months of August and September, along with the current status of our risk models, but we also want to take a look at a long term chart of the stock market, in this case, the S&P 500. We’ve created the chart below from www.stockcharts.com.
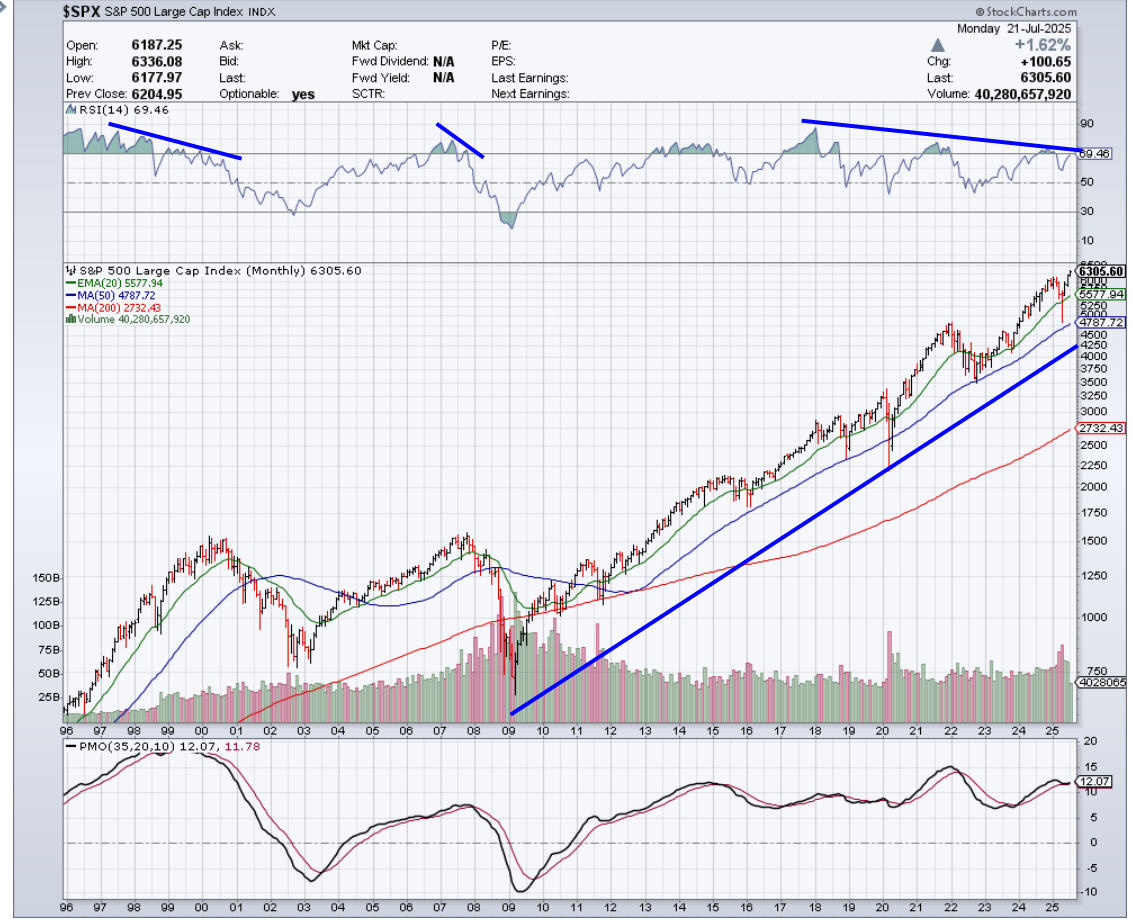
This is a good reminder to take a step back and see the stock market as defined by the S&P 500 has been in a long term uptrend since the bottom in early 2009. There have been significant corrections in 2020, 2022 and again earlier this year in April, yet the market stands at an all-time high at this writing. I’ve highlighted in blue with the top clip the RSI (Relative Strength Index), which is one measurement of momentum. Almost all significant peaks are characterized by negative divergences in momentum (i.e., lower highs). Such a divergence exists now, starting with the peak 7 years ago. But nobody knows what the trigger will be to start the next big drop. In the bottom clip is the PMO (Price Momentum Oscillator). It’s also showing a negative divergence and is about to rollover with a negative crossover.
Sometimes those declines are modest, such as in 2015, and don’t amount to much. The crossover sell in early 2022 did lead to a -25% drop and a strong down year. It’s important to note that the really big declines are accompanied by the PMO going below the zero line. That’s a long way away, but it did happen in both 2002 and again in 2008. In those instances, the S&P 500 was in the midst of what turned out to be declines of 45-55%.
Right now, despite some expected seasonal weakness that may be very likely in the next 8 weeks, there are few cracks in the overall stock market picture, with the NY Advance/Decline line recently confirming the new highs in the index. According to Doug Ramsey, our friend at The Leuthold Group, there have been 33 cases since 1929 when the stock made a new high in the month of June. In the 20 cases where “breadth” as defined by a new high in the Advance/Decline line was confirming the new high, the average gain the second half of the year was 8.5%, with gains in 15 of 20 cases. In the 13 cases where new highs were not confirmed, the average result was a -1.0% loss. All in all, the odds favor higher highs in the months ahead, possibly at year-end, with some thunderstorms dead ahead.
Tornado Warning Ahead
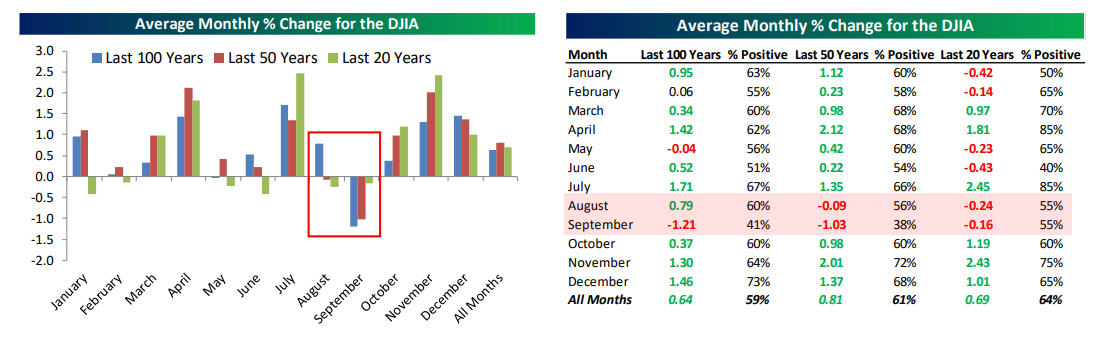
Seasonality is an external indicator, which simply ties the performance of the stock market to the calendar. Since 1950, certain patterns have been statistically significant, sometimes even after their public discovery. But, they don’t always work as an indicator. Nothing is perfect. Nevertheless, July has one of the better records (in fact, the best of the last 100 years—see below). The strength of July, though, is followed by the weakness of August and September, which have the worst records of the past 50 years. Below is a graph and table, courtesy of www.bespokepremium.com, showing these tendencies.
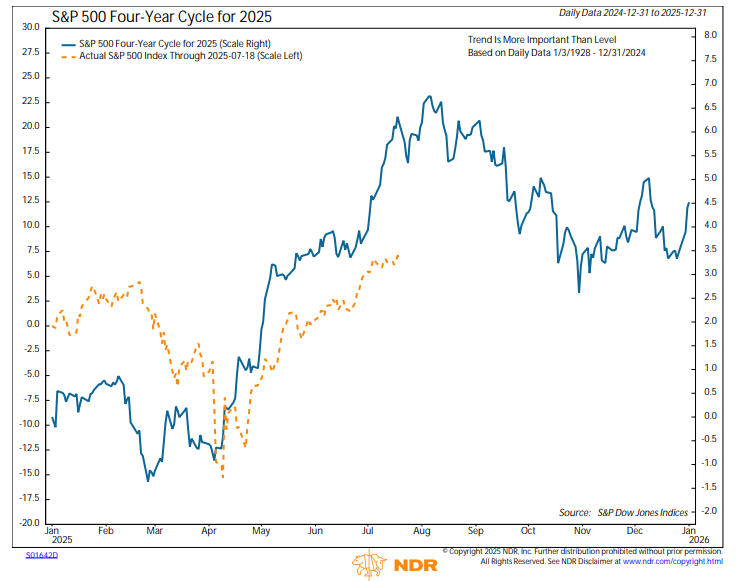
The Presidential Cycle, also known as the Four-Year Cycle, is constructed from seasonal data, and the latest version below is from our friends at Ned Davis Research, at www.ndr.com. It’s showing a peak in late July, dead ahead, followed by a decent decline into late October, though keep in mind these seasonal charts cannot predict the magnitude of movements. Thus far, stocks have been following this cycle fairly well here in 2025.
A Brief Update On The Not So FAIR Plan
The past two years, I’ve chronicled our personal experience with the challenges of homeowners insurance, living in Yorba Linda, CA and being deemed in a higher risk fire zone. We know that some of you face similar issues and have also been relegated to the insurer of last resort in California, the FAIR Plan. From August 2023 to August 2024, the premiums on our policy increased by about 100%, to nearly $10,000 per annum.
Given the terrible fires in the Los Angeles area earlier this year, plus well publicized losses to the FAIR Plan (supposedly in the $billions), I was expecting another premium increase of maybe 15-25%. Instead, our premium went down about $1000. Yes. Go figure. This is because they revised our premium based on our fire line score. That’s a score that is assigned to a property indicating its likelihood to burn in a wildfire. The score is based on factors such as vegetation, slope and access to the property. At present, the FAIR Plan has not filed for a rate increase, but I’m thinking it’s only a matter of time.
Below is a link to a helpful article published in the San Francisco Chronicle on this area. There’s a nice tool within the article where you put in your zip code, and it will tell you the range of premiums being charged in your area.
https://www.sfchronicle.com/california/article/california-fair-plan-premium-20761726.php
Portfolio Allocations
Our tactical equity exposure will be at 60% as of today’s close. It was increased to 80% on July 2, when one model turned positive, while another model has turned negative today, resulting in the shift back down. Meanwhile, our high yield bond fund risk model remains on its May 2 BUY signal, with no signs of deterioration, and that’s normally a positive sign for equities.
Material Of A Less Serious Nature
A teacher is explaining biology to her 4th grade students.
“Human beings are the only animals that stutter,” she says.
A little girl raises her hand. “I had a kitty-cat who stuttered,” she volunteered.
The teacher, knowing how precious some of these stories could become, asked the girl to describe the incident.
“Well,” she began. “I was in the back yard with my kitty and the Rottweiler that lives next door got a running start and before we knew it, he jumped over the fence into our yard!”
“That must’ve been scary,” said the teacher.
“It sure was,” said the little girl.
“My kitty raised his back, went ‘Fffff,Fffff, Fffff….And before he could say ‘F$CK’, the Rottweiler ate him!”
Summer technically starts today, July 21, but the weather in SoCal and other regions of the country has been summer-like for many weeks. Enjoy it, as school for many students will start in just about four weeks. I’m thinking baseball, barbeque and ice cream, at least until my Giants and Angels give me no reason to hope. At that point, well, the NFL starts training camp this week. And the Super Bowl will be played in February at the 49ers’ home stadium in Santa Clara. And wouldn’t that be cool, playing for the championship in your home stadium. One can dream.
Thanks for your continued trust in all of us at TABR.
Sincerely,

Bob Kargenian, CMT
President
TABR Capital Management
TABR Capital Management, LLC (“TABR”) is an SEC registered investment advisor with its principal place of business in the state of California. TABR and its representatives are in compliance with the current notice filing and registration requirements imposed upon registered investment advisors by those states in which TABR maintains clients. TABR may only transact business in those states in which it is notice filed, or qualifies for an exemption or exclusion from notice filing requirements.
This newsletter is limited to the dissemination of general information pertaining to our investment advisory/management services. Any subsequent, direct communication by TABR with a prospective client shall be conducted by a representative that is either registered or qualifies for an exemption or exclusion from registration in the state where the prospective client resides. For information pertaining to the registration status of TABR, please contact TABR or refer to the Investment Advisor Disclosure web site (www.adviserinfo.sec.gov).
The TABR Model Portfolios are allocated in a range of investments according to TABR’s proprietary investment strategies. TABR’s proprietary investment strategies are allocated amongst individual stocks, bonds, mutual funds, ETFs and other instruments with a view towards income and/or capital appreciation depending on the specific allocation employed by each Model Portfolio. TABR tracks the performance of each Model Portfolio in an actual account that is charged TABR’s investment management fees in the exact manner as would an actual client account. Therefore the performance shown is net of TABR’s investment management fees, and also reflect the deduction of transaction and custodial charges, if any.
Comparison of the TABR Model Portfolios to the Vanguard Total Stock Index Fund, the Vanguard Total International Stock Fund, the Vanguard Total Bond Index Fund and the S&P 500 Index is for illustrative purposes only and the volatility of the indices used for comparison may be materially different from the volatility of the TABR Model Portfolios due to varying degrees of diversification and/or other factors.
Past performance of the TABR Model Portfolios may not be indicative of future results and the performance of a specific individual client account may vary substantially from the composite results above in part because client accounts may be allocated among several portfolios. Different types of investments involve varying degrees of risk, and there can be no assurance that any specific investment will be profitable.
For additional information about TABR, including fees and services, send for our disclosure statement as set forth on Form ADV from us using the contact information herein. Please read the disclosure statement carefully before you invest or send money.
A list of all recommendations made by TABR within the immediately preceding one year is available upon request at no charge. The sample client experiences described herein are included for illustrative purposes and there can be no assurance that TABR will be able to achieve similar results in comparable situations. No portion of this writing is to be interpreted as a testimonial or endorsement of TABR’s investment advisory services and it is not known whether the clients referenced approve of TABR or its services.