If You’re 40 Or Younger, You’ve Rarely Experienced Investment Pain. That’s Likely To Change Soon.
Since the major bottom in early 2009, the U.S. stock market has been on a tear, compounding at nearly 15% for 16 years. If there’s such a thing as “normal,” that’s not it.
Yes, stocks and bonds declined in tandem in 2022, resulting in an approximate loss of -12% to -14% for balanced investors, but for investors in the 24 to 40-year-old category, there’s really been no real pain in their investing lifetime.
We’ll examine this inside, along with the 10 years that preceded 2009. It’s about giving you a balanced perspective. Longer term valuation indicators absolutely suck, yet our models are fully invested across the board. Their message is more about the future than the present.
We’ll also touch on the very serious bump coming in health insurance premiums. Given that depressing news, it’s always appropriate to close with some humor. Read on.
2009 To The Present—One Of The Best Periods Ever
As financial author Morgan Housel recently wrote, “Nothing too good or too bad stays that way forever, because great times plant the seeds of their own destruction through complacency and leverage, and bad times plant the seeds of their own turnaround through opportunity and panic-driven problem-solving.” In my opinion, we are in the late phases of “nothing too good stays that way” stage. Here’s some perspective, on what has been going on since late 2008, and importantly, what all the 40 and under investors don’t really know (unless they have studied markets, which I know is not likely), is what happened before 2009.
The secular bear market in U.S. stocks that began in early 2000 ended in March of 2009. From December 31, 2009 to the present, which is now a span of nearly 16 years, the S&P 500 index has compounded at an annualized rate of 14.7%. During that span, there have been only two calendar years with losses, assuming there is no complete collapse here in 2025. The two negative years were 2018 and 2022, with losses of -4.18% and -18.23%. Historically, stocks post annual gains about 77% of the time, but it’s been nearly 88% since 2009.
Can you see why younger investors have mostly felt nothing but good results in their investing lifetimes? Since 1926, the S&P 500 has compounded at 10.4% per annum. The last nearly 16 years have been nearly 50% over trend. How did this happen? The seeds of the good times were sown in the prior 10 years. See the annual returns from 2000 to 2009 of the S&P 500 (dividends included).
2000 -9.06%
2001 -12.02%
2002 -22.15%
2003 28.50%
2004 10.74%
2005 4.77%
2006 15.64%
2007 5.39%
2008 -37.02%
2009 26.49%
Four down years in 10. Care to guess the compound annual return for the 10 years? How about -1.00%. This was the worst 10-year period in the history of the S&P 500, nearly 100 years back. The worst set up one of the best periods that we’re still in. I’m not prophesying here. As Housel also wrote, “Unsustainable things can last longer than you anticipate.” And candidly, our various models are all positive at present and not suggesting imminent danger. But, they are not designed to forecast. They are mostly trend-following in nature. The current hope (and hype) appears to be AI, also known as Artificial Intelligence. Based on the data, I think the outcomes are going to be of great disappointment. I don’t believe that market cycles have been repealed, and that price/earnings ratios will continue to expand indefinitely. Importantly, though, we’re not betting on a negative outcome. We adjust our exposure based on the current evidence, and long-term valuation indicators are not part of our investing process, for good reason.
To ignore them, though, is folly. Let’s take a look at what’s happened to earnings, and price/earnings ratios, since 1975. Below is a table I’m reproducing from Research Affiliates, LLC, based in Newport Beach. You can learn more about them at www.researchaffiliates.com.
Cumulative Returns by Valuation Change Using the CAPE Ratio, 1975-2025
S&P 500 Valuations by Decade
| Years | Beginning CAPE | Ending CAPE | CAPE Expansion |
| 1975-1979 | 8.3 | 8.7 | 5.5% |
| 1980-1989 | 8.7 | 17.7 | 101.8% |
| 1990-1999 | 17.7 | 44.2 | 150.4% |
| 2000-2009 | 44.2 | 20.3 | -54.0% |
| 2010-2019 | 20.3 | 30.3 | 49.3% |
| 2020-2025 (through August 30) | 30.3 | 38.27 | 26.30% |
First, let’s explain what the CAPE Ratio is. It stands for Cyclically Adjusted Price Earnings, and was developed by Yale professor Robert Shiller in the late 1990s. Instead of just looking at the last 12 months of earnings of a company or index, as most analysts do, the CAPE looks at the last 10 years, and normalizes them, to better reflect the business cycle. Though I’m not showing a chart here, the current level of the CAPE above 38 is the second highest in history, even exceeding that of 1929, but not yet reaching the levels of the Dot Com boom in 1999. There are many reasons to argue why valuations have been rising over time, and especially since around 1995. It doesn’t mean, though, they’ll never revert back. The CAPE fell by more than 50% after the 20-year run up to the 1999 peak. Investors should know this could happen again.
In just the last three years, going back to the October 2022 bear market lows, the S&P 500 Index has gained 83%, according to Ned Davis Research, while earnings have grown only 16%. That’s unsustainable. NDR, as they are known, has tried to adjust for this expansion by creating a long-term trendline. See their chart below.
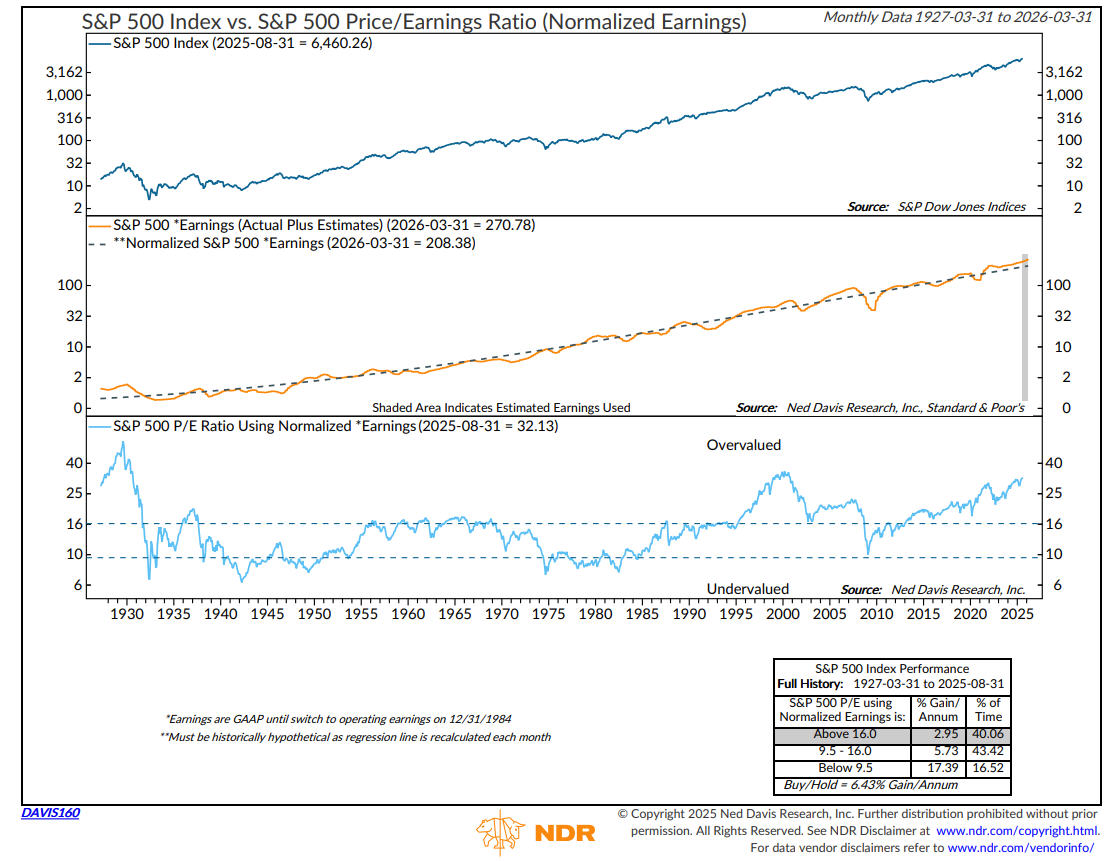
At present, the current P/E is 32% above the regression line. That’s a lot of fluff, and a long way down if expectations disappoint. In history going back to 1927, when normalized earnings have been above 16, which has been 40% of the time, the annualized return of the S&P 500 has been a paltry 2.95%. This is in line with many other forecasting models, some a bit better, and some even worse.
There are many factors which may be responsible for the expansion in stock valuations. One of them in my mind is that of indexing, which has taken on a huge role in investing today, compared to the late 1990s and early 2000s. I won’t get into the differences here between active and passive management, but for those who don’t know, there is no fundamental analysis being done when one is investing in indexing. There is not necessarily anything wrong with that. We own indexes of various kinds in our process. $Billions of dollars almost every month are going into the S&P 500, and other stock and bond indexes. With indexing, there is no consideration for cheap stocks or expensive stocks. And today, the 10 largest companies in the S&P 500 (think Nvidia, Apple, Amazon and so on) account for nearly 40% of the index. Since the S&P 500 is a cap-weighted index, nearly $40 of every $100 invested is going into those 10 companies. And it doesn’t matter how pricey any of them are (and they are more pricey than in all but one time in history).
I absolutely think this is one of the reasons that price/earnings multiples have expanded significantly during the last 30 years. And though I do think it’s unsustainable, I can’t tell you when it will end, and nobody else can either. Our process is not dependent on that. We’re not taking chips off the table. We only do that when our evidence changes. But because of the cap weighted process, and the proliferation of the ease of trading and leveraged products, I do think there is an element of gambling that has taken over for younger investors. Fundamental analysis? What’s that? Well, since I’m involved in the TCM (Titan Capital Management) Class at Cal State Fullerton, that’s actually what these students are learning, and it’s quite intensive. Trying to figure out what a company is worth, and what they’re going to be worth down the road.
And to be fair, active management, as it is called, struggles to do better than indexing, partly because of fees and partly because of the concentration. So, more money goes into indexing, and as more money goes in, the indexes mostly outperform actively managed funds, until something snaps and they go the other way. Which they will. I don’t want to bash indexing as a thoughtless approach. Heck, we primarily use technical and quantitative analysis, and we hardly use any fundamentals either in our process. Our relative strength approach, which we apply to both indexes and individual stocks does not look at fundamentals in any fashion. I don’t want to be hypocritical here. I’m just explaining why I think this has been happening. Most 27 or 37-year old’s don’t likely give a rip what the price/sales or cash flow yields are of a particular stock. It’s more like, “give me something that moves that I can make some serious money on.”
I did not have this wisdom when I was 37, which was 1994. Hardly anybody has the wisdom when they’re younger. That’s just the cycle of life. Today’s younger investors will have to go through some real pain to understand that markets don’t always go up. And though “older” investors certainly want to participate in rising markets, when you get to be 55 and up and start thinking about your retirement nest eggs, you sure don’t want to lose 30% of your capital in one year, or go through 10 years of a lost decade. Both of those scenarios are very possible from here. Don’t ignore the warning signs that are present. We’re fully invested at present, but because a lot of great people entrust their lifetime capital with us, risk management and preservation of capital will always be top of mind for us.
Political Odds Negative For 2026 And Trump’s Term
We’ve not had a recession since 2008-09, although technically the 2020 Covid panic was considered one. The Fed has been extraordinarily active in markets since the 2008 meltdown, throwing $trillions of dollars at markets during Covid. Conditions, notably the inversion of the yield curve that have in the past almost always indicated an on-coming recession, have failed to work recently. That’s simply a reminder that no model works perfectly. As a result, we think it’s more prudent to look at odds, but always let the evidence guide you. By the way, as you look at the table below, courtesy of our friends at The Leuthold Group in Minneapolis (www.leutholdgroup.com), I’m taking liberty with the recession listed in 2020 in that by definitions used, it was a recession, but in my view, a worldwide panic caused by an infectious disease should not be blamed on a party, be it Democrat or Republican. Trump just happened to be President when it happened.
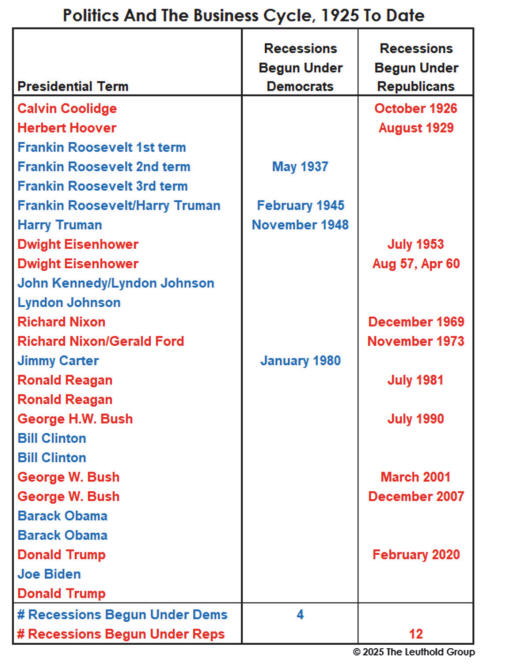
Regardless, the data above does not favor Trump leaving office without a recession beginning in the U.S. Stocks decline much more severely during recessions than during cyclical bear markets without one. In the last 100 years, only a single Republican presidential term concluded without the economy falling into recession, according to the study from Leuthold. Coupling that with the typical results of the four-year Presidential Cycle below, and the odds are quite high that 2026 for the stock market will not be a good experience. The chart below is courtesy of our friends at Ned Davis Research (www.ndr.com).
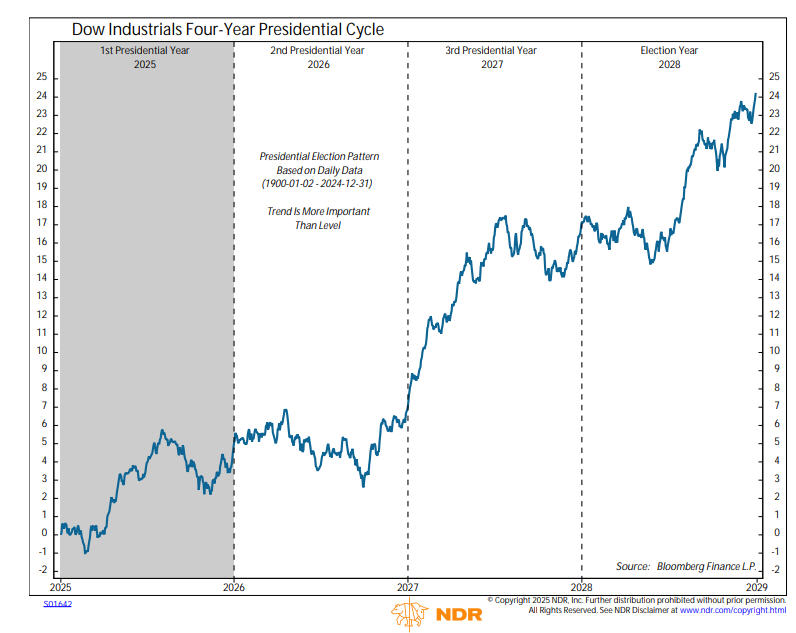
Caveat. The chart is constructed by averaging the performance of each year in the Presidential Election Cycle going back to 1900. We are currently in the 1st Presidential Year, and the stock market has behaved almost perfectly in line with past cycles. A top early in the year, a quick decline, followed by new highs. Just now we are beginning to see some weakness, which may carry into late October (we’ll see), and then a rally into year-end. Next year, though, is the worst of the four years, with below average returns. All in all, 2026 favors a flat to down year, especially given that we’re currently looking at 3 up years in a row. Don’t say I didn’t warn you. 🙂 Will we change anything because of this? Nope. We just follow our stuff. Forecasts are mostly useless. This is simply being aware of conditions and risk. Here is what the data looks like going back to 1872 using Dow Jones Industrial data, again courtesy of NDR.
| Time Period | Number Of Cases | Post Election | Mid Term Election | Pre Election | Election Year |
| Median Gains 1872-2024 | 38 | 7.2% | 2.0% | 13.1% | 9.3% |
| Median Gains 1948-2024 | 19 | 9.1% | 1.1% | 18.9% | 11.8% |
Be Prepared For A Double-Digit Increase In Your Health Insurance Costs
The supposed inflation rate as depicted by the Consumer Price Index (CPI) has been running at around 3% most of this year. But that doesn’t pass the smell test for most of us when it comes to looking at insurance bills (health, auto and homeowners), the cost to rent, mortgages for those that have them, or the cost of food and eating out. To add to that pain, recent articles in both USA Today and the Wall Street Journal have warned of the biggest health-insurance cost increases in at least 15 years, as most employer-paid plans come up for renewal in the fourth quarter of this year.
These costs are expected to increase between 9-10%, according to estimates from Aon and an employer survey by WTW, both of whom are benefits-consulting firms. For perspective, the recent average cost for a family plan is roughly $25,500 annually. Unfortunately, I can vouch for that. Last year, our premiums which cover myself, my wife and our 20-year-old daughter increased by 13.6%, to $2679 per month, or over $32,000 per year. By the way, our PPO plan comes with a $6700 deductible per person.
The causes for rising premiums include higher prices for hospital care, expanding use of services and pricey drugs. “Diseases that we usually thought of as for elderly, we’re seeing more and more in a younger, working-age population,” said Kirk Roy, chief actuary at Blue Cross Blue Shield of Michigan.
Since TABR is a company with fewer than 20 employees, I have a less common situation where now I’m in the process of moving off the work plan to Medicare for my wife and I, since she recently turned 65, and separately purchasing an individual policy for our daughter. Believe it or not, this will not save us much money, given Medicare IRMA penalties plus a supplement plan and separate coverage for our daughter. But our deductible will be pretty much gone.
The cost of healthcare and the cost of housing just may be the two biggest problems in the United States. Whether you’re self-employed, or work in corporate or have coverage through a government job or your state (teacher, fire, police, etc.) and you’re being asked to pay more for your coverage, you’ll understand why. This stuff is expensive.
Portfolio Allocations
As noted above, despite our concerns about risk, the evidence of our models has us fully invested in stocks via our tactical risk models. We had been 80% invested as of August 11, and that increased to 100% on September 11. Our high yield bond risk model remains on its BUY signal from May 5, as high yield bond funds have been making new highs nearly every week for several weeks. We are currently in the worst seasonal period of the year, and stocks are finally beginning to pull back, so weakness could continue through October. We’ll see. With the NYSE Advance/Decline line making a new high just a couple of weeks ago, though, the historical odds suggest a topping process hasn’t even started yet.
What The Heck Happened To Bob?
Growing up, even though my legal name was Robert, I always went by Bobby, and my nickname in elementary and high school was Boo-Boo. I stayed Bobby until I was 24, and many close friends from that time period when I was employed by the California Angels still call me Bobby today. And I love that. When I started with E.F. Hutton, though, in 1982, somehow things got changed to Bob. I guess my perception was something like, hey, people are entrusting their money to me, I better get serious and become Bob. Hmmm. Oh well. Today, I’m professionally Bob, but to several close friends, I’m Bobber. To others, still Bobby. And one friend started calling me Bobert (ha–Bob and Robert combined!). That’s fun.
Until last week, though, I didn’t realize that Bob was becoming extinct in my first love, major league baseball. And apparently, as you’ll see, Bobby doesn’t count. I grew up with Bobby Murcer of the Yankees, and personally know Bobby Grich of the Angels, since he was our starting All-Star second baseman when I was with the team. Then there’s Bob Gibson, one of the best pitchers ever. And Bob Lemon, a former manager of the Yankees who I got to know also when I was with the Angels. Anyway, the article below was too good to just pass up, or provide a link to, so I’m reproducing it in its entirety. It was written by Bob Greene, and was published in the Wall Street Journal last Thursday, September 18. It’s called “I’m Bob, an Endangered Species.” Thanks Mr. Greene, aka Bob.
Major League Baseball is filled with arcane statistics and historical quirks, but as this season barrels toward the playoffs one stat almost defies belief. At least by those of us who share a certain first name.
Last month, when the Tampa Bay Rays brought first baseman Bob Seymour up from the minors, he was the first big-league Bob in 15 years. Robbys and Robertos and the occasional Bobby don’t count; they have consciously and summarily rejected being called Bob.
It’s astonishing. Bob was once so popular a ballplayer name that managers had to be careful not to trip over one Bob or another on their way through the clubhouse. In the mid-20th century, there were enough great pitchers named Bob to fill a 5-cent pack of Topps baseball cards: Bob Feller, Bob Lemon, Bob Turley, Bob Gibson and the amiably named hurler Bob Friend.
And then the bottom dropped out on baseball Bobs. I had been noticing this for a while—we Bobs tend to be sensitive to such things—but ace scribe Blake Silverman of Sports Illustrated was the fellow who officially informed the world that when Bob Seymour joined the Rays this summer, he was the first Bob in the big leagues since relief pitcher Bob Howry retired from the Chicago Cubs in 2010.
In 2019, when the majors were almost a decade into being Bobless, writer Jordan Shusterman, on an MLB website, pointed out that in Game 2 of the 1971 World Series no fewer than five Bobs took the field for the Pittsburgh Pirates: Bob Johnson, Bob Moose, Bob Veale, Bob Miller and Bob Robertson. Baseball’s Bob horizon seemed infinite.
But historical trends were working against Bobs. Robert was the most popular name in America for newborn boys from 1924 until 1939. Even more impressive, from 1900 until 1990 it never dropped out of the top 10.
Last year, according to the Social Security Administration, Robert had sunk to No. 90 among names for newborn American males. The top three: Liam, Noah and Oliver.
For so long, though, Bobs were everywhere. In my childhood neighborhood there were seven Bobs within six houses of each other. It’s an economical name: just three letters, and two of them are the same. There’s nothing exotic about it: Bob has always been the Wonder Bread and vanilla ice cream of names.
Even in the glory years there were signs that Bobs shouldn’t take their ubiquity for granted. How does the nation reward its most exalted citizens? By electing them president. Examine, if you will, the list of the country’s chief executives, from George to Donald. Not a Bob among them. A Chester, sure. A Millard, a Barack, a Woodrow, a Zachary, a Ulysses, a Rutherford, a Calvin, even a Grover. But the electorate has pitched a shutout against Bobs.
So at least in baseball, Bob Seymour has ended the long Bobless drought. You would think that the commissioner would commemorate the moment in some way.
The commissioner, however, is part of the problem. His name is Robert Manfred. But in a bush league snub, he chooses to be Commissioner Rob, not Commissioner Bob.
Mr. Greene’s books include “Chevrolet Summers, Dairy Queen Nights.”
A Baptist preacher sits next to a cowboy on a flight. After the plane takes off, the cowboy asks for a whiskey and soda, which is promptly brought and placed before him.
The flight attendant then asks the preacher if he would like a drink.
Appalled, the preacher replies, “I’d rather be tied up and taken advantage of by women of ill-repute, than let liquor touch my lips.”
The cowboy then hands his drink back to the attendant and says, “Me too! I didn’t know we had a choice.”
I know everyone doesn’t drink coffee, but I do, and maybe you can relate to this at times. . . . 🙂
Coffee spelled backwards is EEFFOC.
Just know that I don’t give EEFFOC until I’ve had my coffee.
Now that you’re laughing, thanks for getting this far. School is in full swing, as is the NFL, with the baseball playoffs ready for next week and much intrigue there. No Angels or Giants. But my buddy Tanner Bibee and his Cleveland Guardians are on the verge of the greatest comeback in MLB history since 1950. We’ll see. My 49ers and Oklahoma Sooners are undefeated, but both suffered devastating injuries this past weekend. It’s hard enough to win, but win without your best player is even tougher. In sports, though, you never know. See the Guardians story.
As always, thanks for allowing us to serve you and for your trust and confidence in all of us at TABR.
Sincerely,

Bob Kargenian, CMT
President
TABR Capital Management
TABR Capital Management, LLC (“TABR”) is an SEC registered investment advisor with its principal place of business in the state of California. TABR and its representatives are in compliance with the current notice filing and registration requirements imposed upon registered investment advisors by those states in which TABR maintains clients. TABR may only transact business in those states in which it is notice filed, or qualifies for an exemption or exclusion from notice filing requirements.
This newsletter is limited to the dissemination of general information pertaining to our investment advisory/management services. Any subsequent, direct communication by TABR with a prospective client shall be conducted by a representative that is either registered or qualifies for an exemption or exclusion from registration in the state where the prospective client resides. For information pertaining to the registration status of TABR, please contact TABR or refer to the Investment Advisor Disclosure web site (www.adviserinfo.sec.gov).
The TABR Model Portfolios are allocated in a range of investments according to TABR’s proprietary investment strategies. TABR’s proprietary investment strategies are allocated amongst individual stocks, bonds, mutual funds, ETFs and other instruments with a view towards income and/or capital appreciation depending on the specific allocation employed by each Model Portfolio. TABR tracks the performance of each Model Portfolio in an actual account that is charged TABR’s investment management fees in the exact manner as would an actual client account. Therefore the performance shown is net of TABR’s investment management fees, and also reflect the deduction of transaction and custodial charges, if any.
Comparison of the TABR Model Portfolios to the Vanguard Total Stock Index Fund, the Vanguard Total International Stock Fund, the Vanguard Total Bond Index Fund and the S&P 500 Index is for illustrative purposes only and the volatility of the indices used for comparison may be materially different from the volatility of the TABR Model Portfolios due to varying degrees of diversification and/or other factors.
Past performance of the TABR Model Portfolios may not be indicative of future results and the performance of a specific individual client account may vary substantially from the composite results above in part because client accounts may be allocated among several portfolios. Different types of investments involve varying degrees of risk, and there can be no assurance that any specific investment will be profitable.
For additional information about TABR, including fees and services, send for our disclosure statement as set forth on Form ADV from us using the contact information herein. Please read the disclosure statement carefully before you invest or send money.
A list of all recommendations made by TABR within the immediately preceding one year is available upon request at no charge. The sample client experiences described herein are included for illustrative purposes and there can be no assurance that TABR will be able to achieve similar results in comparable situations. No portion of this writing is to be interpreted as a testimonial or endorsement of TABR’s investment advisory services and it is not known whether the clients referenced approve of TABR or its services.