Speculation Seems Rampant (Think Gold), But Seasonals Suggest Strength Through Early January
Who needs stocks, bonds and property when you can speculate in crypto, gold and gamble? When will the party end? Probably not for several months, based on our indicators, though gold appears to have already topped.
Inside, we’ll look at stock market seasonality, the Social Security COLA and Medicare increases, the Fed Funds cut, and why 3% inflation doesn’t resonate for most of us. Read on.
Silly Season Seems Upon Us
A couple of weeks ago, subprime auto lender Tricolor Holdings caught creditors off guard when it filed for Chapter 7 bankruptcy. Among its creditors was none other than JP Morgan Chase, who has reported a $170 million charge related to the filing. Unless you’re a bond analyst, you’ve likely never heard of Tricolor Holdings, and that includes us. But if you knew the following information, would you conclude this was a good risk play? According to a recent Wall Street Journal piece, a Tricolor bond offering this year showed that more than two-thirds of its borrowers lacked credit scores, and for those with credit scores, the average was 614. More than half also didn’t have a driver’s license. And you wonder why they’re bankrupt? Would you lend YOUR money to them? I didn’t think so.
At present, this story seems to be a one-off, but the lack of attention to lending standards is typical of late cycle credit market peaks. Thus far, the high yield bond market has been confirming recent new highs in the stock market, and that’s a good, but not foolproof sign. In the stock market, the S&P 500 was up over 18% through October 29, quite an accomplishment given the nearly -20% drop in March and April. Though price/earnings multiples continue to expand to near record levels, at least earnings are up approximately 11% year-to-date. How long price/earnings multiple expansion can continue is the big question of the day, but with other assets such as gold and bitcoin, it’s all about what investors are willing to pay. Until early last week, gold was on a parabolic rise, up 66% for the year. See the chart below, courtesy of www.stockcharts.com.
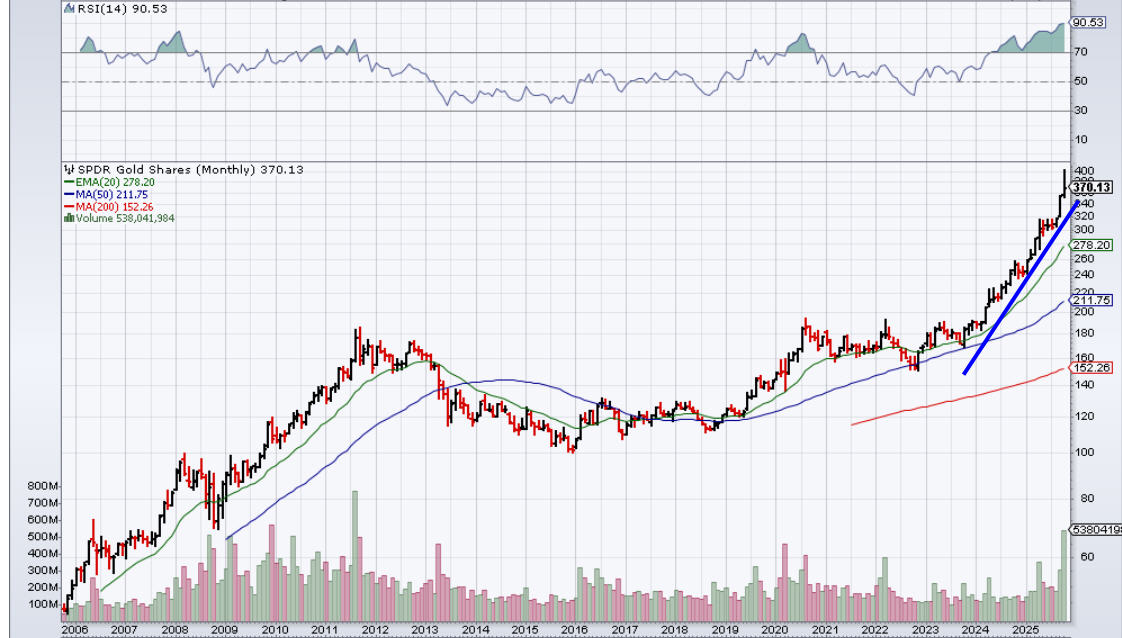
We’ve had an on-again, off-again affair regarding gold and its inclusion in client portfolios. And remember, we eat our own cooking, so if we’re investing in it for clients, we’ve also got our own skin in the game. We’ve found that gold is a tough asset to be patient with. Because of its inferior return profile relative to stocks, we’re not comfortable sticking 5% of a portfolio in gold and forgetting about it. From 2011 to late 2023, gold went nowhere while the stock market marched significantly higher. What we’ve learned from the gold risk models we’ve tested is that because of the very long term poor return profile versus stocks, one doesn’t want to go to cash when gold is on a Sell. Rather, move those funds back into the stock allocation. Then, when gold moves back into a BUY mode via the model or models, simply shift that allocation out of stocks and back into gold.
The above chart is that of GLD, which is one of the ETFs (exchange traded funds) one can buy to represent an allocation to physical gold. We actually use a different fund in portfolios, that of the IAU, which is sponsored by iShares, whereas GLD is sponsored by SPDR. The IAU fund has a lower expense ratio at 0.25% versus 0.40% for GLD, and that’s why we use it. Every little bit helps.
You can see on the chart that GLD peaked in 2011, and then proceeded to test that peak in 2020, March of 2022, April of 2023, and December of 2023. It then broke above this resistance zone in March of 2024, and since then, it has gained 92%, handily outperforming the S&P 500’s gain of about 36% in the same time period. Just as we were rebalancing all of our accounts near the end of 2023, I was dissatisfied with the progress in gold, and frankly, ran out of patience. Even with knowing that using a trend following model, one is going to have to put up with some frustrating periods of whipsaws and choppiness and little progress (even with stock market models). Count me with seller’s regret. Or FOMO (fear of missing out). Just as I was shoving it to the side, the shiny metal broke out to the upside, and arguably is still in a strong uptrend.
Fundamentally, there is no way to value gold. It has no cash flows, similar to Bitcoin, and is simply subject to what people believe it’s worth. Unlike Bitcoin, though, it has been around for ages, and has a reputation as an inflation hedge, a portfolio diversifier and a store of value. The reputation of an inflation hedge has very little evidence to support it. And it used to be that when stocks fell hard, gold would go up. That’s not necessarily the case, either, as assets have become more and more correlated during significant downturns. The store of value moniker has been around for quite some time. I think most of us would agree that for the last 25 years, the thought would be, “the government is printing unlimited amounts of money. This is going to cause inflation. It’s out of control. Better own some gold.”
That chorus is growing louder, and it began to ring in my ear earlier this year as gold crossed the 3000 level. At present, the United States has $38 trillion of debt, with no plan to reverse it. As I write this, our government is shut down, because the politicians can’t agree on a budget deal. Forgive me, but government budget seems to be an oxymoron these days (at many levels, not just Washington). As much as we all may worry about this and pontificate on it, the reality is the debt issues will be fine as long as the economy continue to grow at a moderate pace. Perhaps this is why the Federal Reserve is so intent on trying to prevent a recession, because with a recession and all the debt, all hell is going to break loose, and asset values across the board in stocks, bonds, and real estate are likely to get smashed. In that scenario, does gold shine? Hell if I know. But I’m willing to have a 5% allocation in Moderate portfolios (3% in Conservative and 7% in Aggressive) just so I don’t suffer from FOMO. Fear of missing out.
So, what did I do? I did a little of least regret, creating an approximate 1% position on September 1 and adding another 1% on October 1. In the first weeks of October, I started to notice something. Gold was going up every day. It was like nothing could stop it. Being 67, I’ve seen this movie before. And the data was backing up my feeling. From the close on September 18 to the close on October 20, gold prices rose on 18 of 22 days, and in that time span, increased 20%. It was a parabolic move. In the middle of a move like this in an asset class, including stocks, it’s really hard to identify the top. Markets can go higher than we think, and lower than we think. But then I came across some other technical information that was telling, and led me to act, given that we hadn’t been in sync with our models for the whole move, and I knew that we might be late in the game, even with a very modest 2% position. See the chart below courtesy of the Elliott Wave Financial Forecast (www.myelliottwave.com).
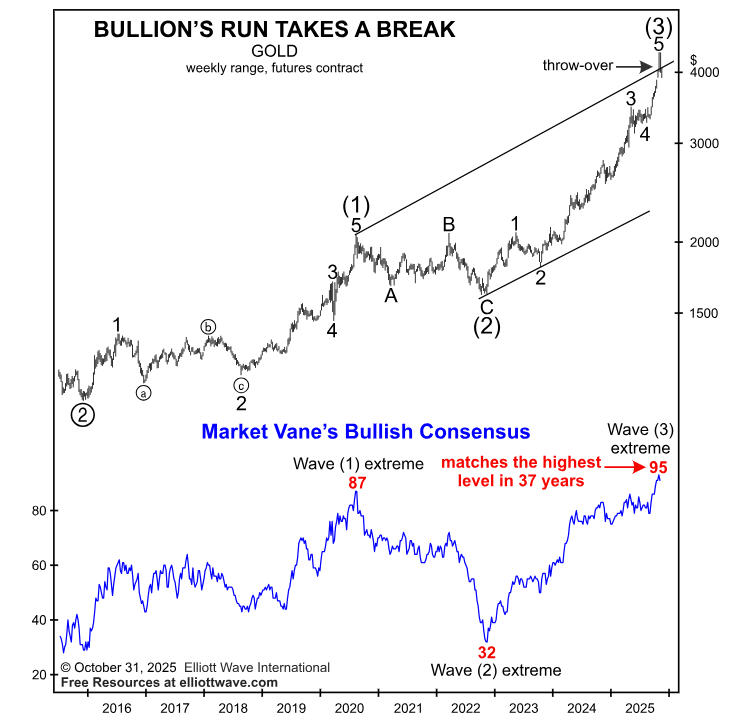
The lower clip of the chart above shows the Bullish Consensus indicator for gold from Market Vane. This is a sentiment indicator and it showed that of those polled, 95% were bullish on gold, matching the highest extreme in the 37-year history of the data. In other words, everyone believed. Thankfully, due to my voracious appetite for reading and staying current, I became aware of this on Saturday, October 18 with my weekend review, and made the decision it was time to sell the entire position on Monday morning. Full disclosure. This was not model driven, this was wisdom driven, and only because we’ve not been in sync with our gold models. Don’t believe for a minute we’d ever mess with the integrity of our models. They are not perfect, but they will mostly catch every big uptrend, and get out of the way of downtrends, and we don’t second guess them. Right now, despite maybe the second most over valued stock market in history, we are fully invested in stocks, because all of our models are positive. They won’t start getting negative until there is likely at least a decline of 7% to 10% off the eventual top.
In any case, we got a great break, as on Monday morning, October 20, gold gapped up over 2% on the opening, and we sold our entire position for a gain of over 16% in less than two months. Since then, gold has declined over -7%, and using the chart analysis above, the expectation is for a -20% to -25% decline in coming months, to either the top of Wave 3 or the bottom of Wave 4, using Elliott Wave analysis. Our models for gold are pretty far away from a formal SELL, but we’re going to be patient in terms of re-establishing a position. This has nothing to do with our models, but I think that gold has basically become a momentum trade (much like stocks), and there is a limit to momentum. Unlike stocks, where we are willing to take a portion of one’s capital and allocate it to a buy and hold approach (our passive index strategy), I’m not willing to do that with gold. Its long term return is about half that of the stock market, with more volatility. Not a great combination. And historically, when there has been a significant gain such as now, returns going forward have typically suffered, often for many years. We’ll only know that in hindsight, but in my opinion, the recent peak in gold may be leading the similar major peak in stocks I’m expecting sometime in the first half of 2026. Just remember the reminder, though, from the late Steve Leuthold of the Leuthold Group. Steve used to say, “Forecasts are for show, the indicators are for dough.” Heed that advice.
The Best Season Is Upon Us (Thanksgiving and Christmas Too!)
Since data from 1950, the U.S. stock market has performed best during the six months from November to April. There is debate about the rationale for seasonal tendencies, and as more of the data history becomes known, a question as to its helpfulness. The late Yale Hirsch, publisher of the Stock Trader’s Almanac (now published by his son, Jeff Hirsch), coined the phrase, “Sell in May and Go Away.” Had you done that earlier this year, you’d have missed an approximate 22% gain in the S&P 500. Ouch. In 2025, stocks have performed very strong during their weakest seasonal period of the year. Now, as we enter November, stocks have a seasonal tailwind behind them for several months.
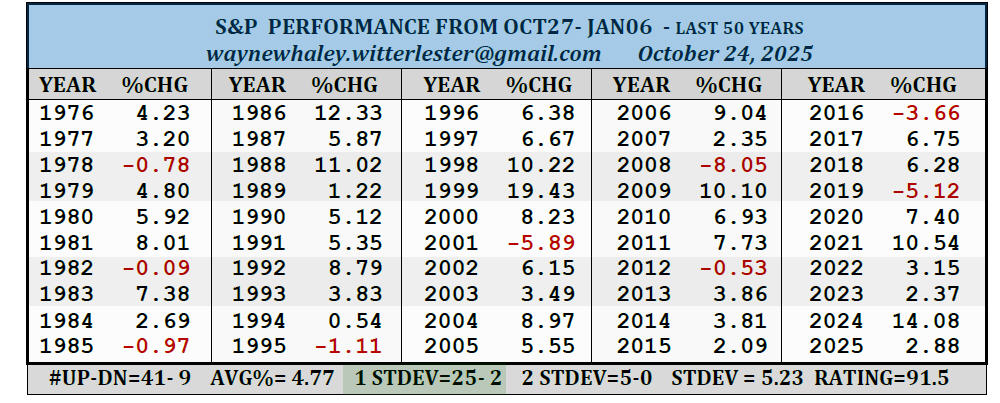
To get specific, let me cite recent research we received from analyst Wayne Whaley from Witter Lester. Whaley found that in the last 50 years, the top 5 results all originated on October 27, which was the beginning of this past week. In the rolling 12 months from October 27, 2024 to October 27, 2025, the S&P 500 gained 18.37%. Since 1950, 40 of the 75 rolling years experienced 10% plus gains. Of those 40 cases, 39 of them resulted in a positive gain from October 27 to January 7, with an average gain of 5.89%. That’s an annualized gain well in excess of 25%, substantially above the 10% norm. Hence, seasonal strength. Below is a table from Whaley showing the performance during this period for the last 50 years.
As a result, the odds favor higher prices into early January. But there are some warning signs developing, despite new highs last week in the NYSE Advance/Decline line, which confirmed new highs in stocks, and historically have not given a divergent warning only about 10% of the time historically. Notably, the percentage of stocks making new highs on the NYSE peaked 57 weeks ago, and according to our friends at Ned Davis Research (chart below, www.ndr.com), the median lead time from a new highs peak to the bull market top is 39 weeks. We’re on borrowed time. There’s a similar divergence in the percent of stocks trading above their 200-day moving average for the S&P 500, below.
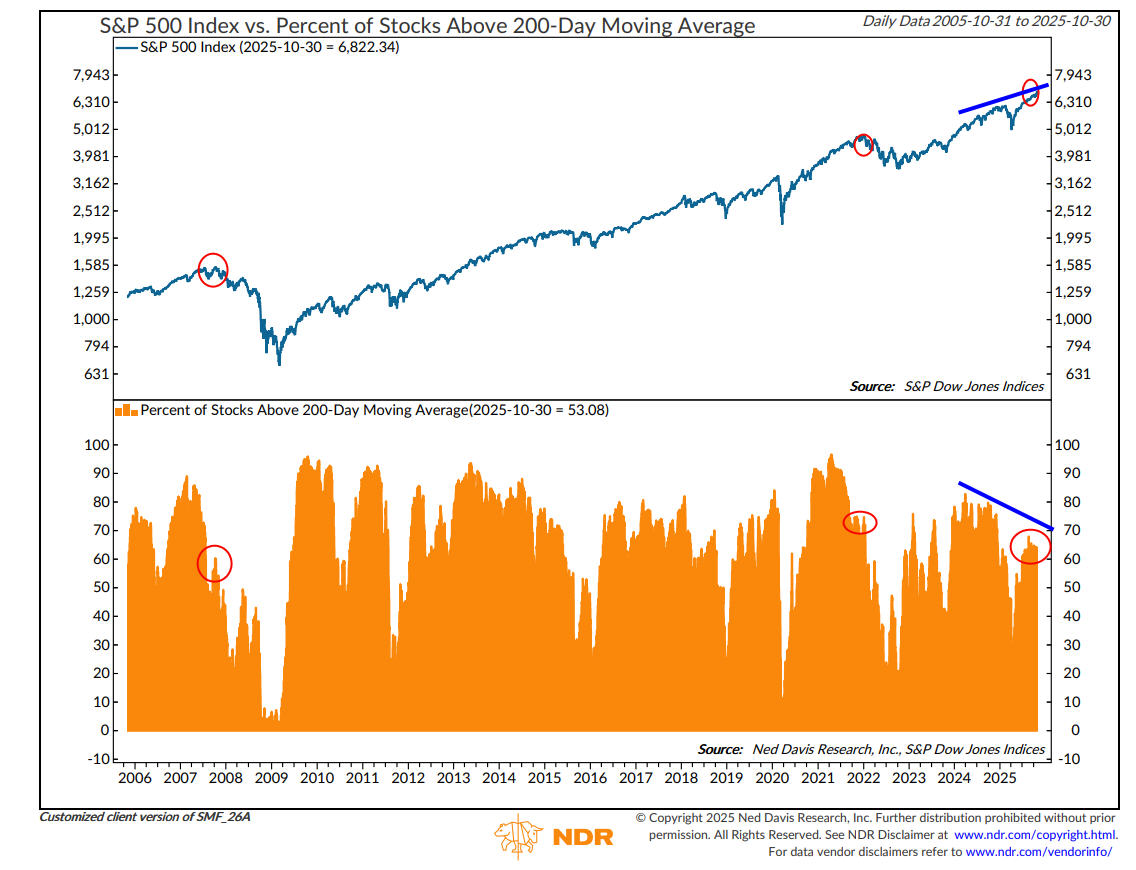
In early 2024, the percentage of stocks trading above their 200-day moving average for the S&P 500 reached 80%. Now, with the index substantially higher than a year ago, only 53% of the stocks sport that distinction. Similar divergences have taken place at the prior two major peaks in 2007 and 2021. Bottom line, this bull market is now over 3 years old, and is showing its age. Using a baseball analogy, we’re probably in the 8th inning. And unlike the Blue Jays/Dodgers epic game earlier this week, we’re not going 18 innings. We’ve had an excellent three years. Given the historical record of mid-term election years and the preponderance of valuation extremes in stocks and high yield credit, we should be preparing psychologically for a more difficult return environment.
Social Security COLA/Medicare Update And More Inflation News
Despite the government shutdown and a lack of many official statistics, the Social Security Administration announced last week that the cost-of-living adjustment, or COLA, for 2026 will rise 2.8%, and that the average monthly check for retirees will be $2,064, up $56 from this year. Much of this increase will be offset by higher premiums for Medicare Part B, which is typically deducted from Social Security benefit checks. Next year, the standard Part B premium is due to increase by $21.50 per month, from $185 to $206.50, a jump of 11.6%. Who says inflation is running at 3%? Not in auto insurance, not in homeowners insurance and certainly not in medical/health insurance.
I can’t vouch that a similar bump is happening nationwide, but look at the email I received two weeks ago from our electricity carrier in So Cal, Southern California Edison.
It’s been 50 years since I graduated from Tulare Union High School, and I was one of the top math students in my senior class. Last time I looked, a 13% increase in our electric bill is a hell of a lot greater than 3% inflation. By the way, this is the long term argument for stocks over fixed income, in that stocks have historically provided a significant return edge over inflation, whereas fixed income has not. Currently, depending on the type of fixed income and duration, yields are in the 3.60% to 4.25% range, excluding high yield credit. That’s above inflation as measured by the CPI (Consumer Price Index), but not as robust as stocks, which have over time returned over 6% above inflation. Given valuation concerns, that edge is likely not going to be there in coming years.
What Is The Fed Funds Rate And What’s The Impact Of This Week’s Reduction?
This past week, the Federal Reserve Board cut the federal funds rate by 0.25% for the second time in 3 months, and it now sits at 3.75% to 4.00, down from 4.25% to 4.50% a few months back. You might ask “what is the fed funds rate, and how does it impact me?” Great question. It is the interest rate that banks charge each other for overnight loans, loans of which are backstopped by the central bank. When rates decline, banks are able to borrow, and lend, at lower rates and maintain their profit margins. Sometimes, lower mortgage rates are a result of cuts, but not always. There is a huge difference in the duration of most mortgages, in the 15 to 30 year range, compared to overnight lending rates. And the factors that affect mortgage yields are actually quite complex.
In fact, last September when the Fed cut the Fed Funds rate for the first time in this cycle, the yield on the 10-year Treasury Note increased in yield from mid-September to early November from 3.75% to 4.40%, and mortgage rates also rose approximately 50 basis points. On the other side of the coin, when the fed funds rate goes down, banks and credit unions and money market funds almost immediately lower the yields on their accounts to reflect the lower payout. This is already happening, as online banks Ally and Capital One have cut their yields to 3.30% and 3.40%, respectively. With money market funds, the yield does not drop instantly on a portfolio, but typically takes about 30 days to change, as money funds normally have portfolios of $billions of dollars with about a 30-day maturity of corporate and/or government paper.
Fidelity’s FCASH product, which is now the core cash option on all after-tax accounts, immediately reduced their yield to 1.91% yesterday. Meanwhile, I noted the yields below on the four money market funds we typically use within client portfolios at Fidelity. These yields were as of October 28, 2025, the day before the Fed announcement.
Fidelity Government Money Market Fund (SPAXX) 7 Day Yield 3.79%
Fidelity Government Cash Reserves (FDRXX) 3.86%
Fidelity Money Market Fund (SPRXX) 3.85%
Fidelity Treasury Money Market Fund (FZFXX) 3.71%
By November 30, as each of the portfolios turnover, I would expect the yields on these funds to be about 0.25% lower, in the 3.55% to 3.60% range. The Fed meets for the final time in 2025 on December 9-10, and at present, the expectation is for another 25 basis point cut, but that is not guaranteed. Much may depend on economic data between now and then (if you can get it!), such as the unemployment rate and inflation data. Should they cut again, then by around mid-January, one should expect short term cash in money funds to be yielding down in the 3.25% to 3.35% range. As noted above, that does not imply that yields on 10-year Treasuries or mortgage rates will follow suit.
Portfolio Allocations
Our risk models for stocks and fixed income high yield remain bullish and in a fully invested position, with 5 of our five stock market models in positive mode since September 11, while our high yield model has been positive since May 2. Given the seasonal tendencies noted above, we’re not expecting much change during the final two months of the year. Hopefully, the Grinch stays home.
Material Of A Less Serious Nature
A new monk arrived at the monastery. He was assigned to help the other monks in copying the old texts by hand. He noticed, however, that they were copying copies, not the original books.
The new monk went to the head monk to ask him about this.
He pointed out that if there were an error in the first copy, that error would be contained in all of the other copies.
The head monk said, “We have been copying from the copies for centuries, but you make a valid point, my son.”
The head monk went down into the cellar with one of the copies to check it against the original. Hours later, nobody had seen him, so one of the monks went downstairs to look for him.
He heard a sob coming from the back of the cellar and found the old monk leaning over one of the original books, crying. He asked what was wrong?
“The word is CELEBRATE, not CELIBATE!” sobbed the head monk.
This may not end up in your email in box until tomorrow, so if that is the case, have a Happy Halloween. Hopefully no Tricks until 2026. About all I can wish for is no more injuries to my 49ers and a Blue Jays World Series victory. Yes, O Canada. If you know me, you know that an Angels and Giants fan cannot root for the Dodgers. Yeessh. Regardless, there have been some amazing storylines, like a 6 hour plus 18-inning extravaganza, the greatest player ever probably in Ohtani, and a rookie who was in the minor leagues in September making the Dodgers look silly in Game 5. This is why I love sports, even when my teams aren’t involved. Meanwhile, please know how much we appreciate all of your trust and confidence in all of us at TABR.
Sincerely,

Bob Kargenian, CMT
President
TABR Capital Management
TABR Capital Management, LLC (“TABR”) is an SEC registered investment advisor with its principal place of business in the state of California. TABR and its representatives are in compliance with the current notice filing and registration requirements imposed upon registered investment advisors by those states in which TABR maintains clients. TABR may only transact business in those states in which it is notice filed, or qualifies for an exemption or exclusion from notice filing requirements.
This newsletter is limited to the dissemination of general information pertaining to our investment advisory/management services. Any subsequent, direct communication by TABR with a prospective client shall be conducted by a representative that is either registered or qualifies for an exemption or exclusion from registration in the state where the prospective client resides. For information pertaining to the registration status of TABR, please contact TABR or refer to the Investment Advisor Disclosure web site (www.adviserinfo.sec.gov).
The TABR Model Portfolios are allocated in a range of investments according to TABR’s proprietary investment strategies. TABR’s proprietary investment strategies are allocated amongst individual stocks, bonds, mutual funds, ETFs and other instruments with a view towards income and/or capital appreciation depending on the specific allocation employed by each Model Portfolio. TABR tracks the performance of each Model Portfolio in an actual account that is charged TABR’s investment management fees in the exact manner as would an actual client account. Therefore the performance shown is net of TABR’s investment management fees, and also reflect the deduction of transaction and custodial charges, if any.
Comparison of the TABR Model Portfolios to the Vanguard Total Stock Index Fund, the Vanguard Total International Stock Fund, the Vanguard Total Bond Index Fund and the S&P 500 Index is for illustrative purposes only and the volatility of the indices used for comparison may be materially different from the volatility of the TABR Model Portfolios due to varying degrees of diversification and/or other factors.
Past performance of the TABR Model Portfolios may not be indicative of future results and the performance of a specific individual client account may vary substantially from the composite results above in part because client accounts may be allocated among several portfolios. Different types of investments involve varying degrees of risk, and there can be no assurance that any specific investment will be profitable.
For additional information about TABR, including fees and services, send for our disclosure statement as set forth on Form ADV from us using the contact information herein. Please read the disclosure statement carefully before you invest or send money.
A list of all recommendations made by TABR within the immediately preceding one year is available upon request at no charge. The sample client experiences described herein are included for illustrative purposes and there can be no assurance that TABR will be able to achieve similar results in comparable situations. No portion of this writing is to be interpreted as a testimonial or endorsement of TABR’s investment advisory services and it is not known whether the clients referenced approve of TABR or its services.