The Best Time To Buy Insurance Is When You Don’t Need It
It’s easy to have a higher tolerance for risk when the market does really well, as it has for the past 16 years. In data going back 75 years, stocks as a percentage of household assets are now at record highs.
That’s not necessarily good news, if past data is meaningful. We’ll look at some conflicting evidence as we enter 2026, the Decennial Cycle data for years ending in 6, new rules for 401 (k) participants over 50, and try to answer the question “can someone steal your IRA right out from under you?” Read on.
Not Many See The Need To Insure Stocks Right Now
Barring a catastrophe in the next 24 days, stocks are primed to conclude a third consecutive strong year with double-digit gains. All is mostly calm, including credit markets, with the VIX, Wall Street’s “fear gauge,” which measures the expected 30-day volatility of the U.S. stock market, trading near the 15 level.
If you’ve ever purchased life insurance, you’ll know that the premiums are far cheaper if you’re relatively healthy and don’t smoke compared to someone who has multiple health issues and does smoke. Simply put, the latter has a higher probability of dying, so they are more costly to insure.
It’s no different with auto insurance or homeowner’s insurance. Got a couple of speeding tickets plus an accident that’s your fault on your driving record the last few years? You’re going to pay a lot more to insure your car than those who don’t, because the insurance companies view you as “higher risk.”
Live in a fire zone like we do in Yorba Linda, CA? As I’ve chronicled in the past two years, you’re going to pay up for homeowners insurance, which has more than doubled, because the risk is deemed higher. Can we afford not to have insurance? No. Our home is one of our largest assets. But for many investors, including us, our investment portfolios (plural, as in both retirement assets and after-tax savings), are even more significant than our homes.
Is there insurance on your portfolio, and is it necessary? Ah, that is the $64 million question. As financial writer Jared Dillian recently wrote, “the point is that nobody sees the need to insure stocks right now, which probably means that it’s a great time to insure stocks. If the market goes down 30%, everyone will think it is a great time to insure stocks, which probably means it would be a bad time to insure a portfolio of stocks.” Given the long-term evidence below, it’s probably a good time to have what I call a defensive game plan.
Below is a chart from Ned Davis Research (www.ndr.com), that shows Stocks as a Percentage of Household Financial Assets, going back to 1951.
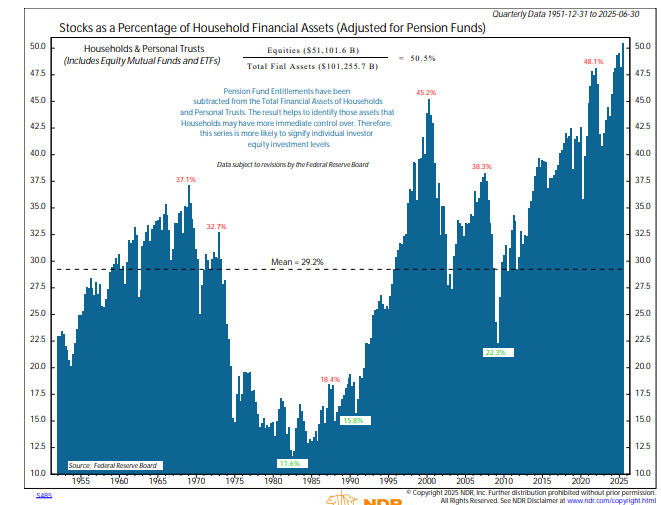
The average equity allocation now stands just above 50%, an all-time high. For some perspective, near the bottom of the 2007-2009 bear market, this allocation percentage was at 22.3%. That’s what 16 years of double-digit compound annual returns will do. Investors now believe in stocks like never before. And if one is looking out 20 to 50 years, it’s hard to argue with “buy stocks for the long run.” The worst 20-year period for the S&P 500 is a 4.1% compound return.
If the correlation of the data from the chart below holds up going forward for the next 10 years, that may prove to be quite optimistic. Below, NDR has taken the average equity allocation from the chart above, and then plotted the subsequent rolling 10-year total returns for the S&P 500.
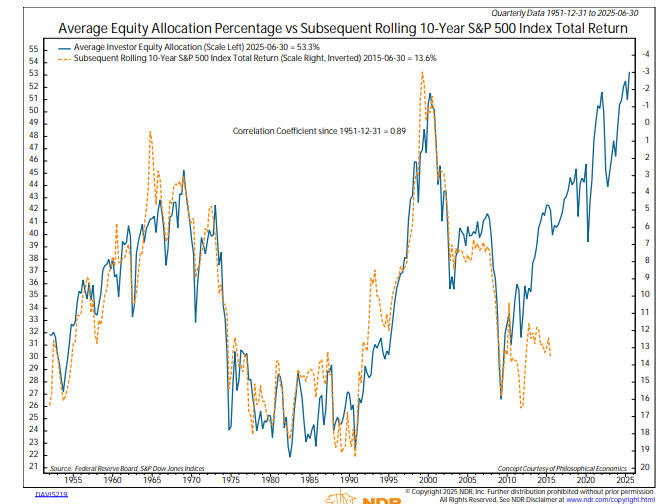
The correlation coefficient is an extremely high 0.89. Correlations can change over time. Models stop working. And right now, this one is a bit out of sync with actual returns the last 10 years coming in at around 13% per annum against the “expected” return of about 5%. When things get out of whack, they tend to converge, and the worry and message from this data is this—the methodology is currently expecting an estimated (-3%) per annum compound return for the next 10 years.
How does one insure their portfolio? There are a few ways. Options offer many different ways to hedge both portfolios and individual stocks, but their complexity is beyond that of most investors. Wall Street has invented “buffer” funds, which cap the downside of an index (typically the S&P 500), and these have become hugely popular in the past couple of years. We may dig into these in more detail in a future monthly update, but suffice to say that these funds use options to insure the downside, where losses are usually capped at a particular number, such as no more than -15%, for example.
Again, these products can be complex and are not typically suitable for the average investor. In our case at TABR, we simply think the best way to have insurance is to reduce one’s equity allocation in line with the evidence of the indicators. In other words, we raise cash. And we do that in a systematic, disciplined manner. Our process is not designed to sell at tops and buy at bottoms, but rather to capture as much in the middle as possible, either of a bull market uptrend, or to mostly avoid a bear market downtrend.
We may come across at times as overly concerned, or even negative, when things look good (perhaps like now). That’s our risk management mantra taking over, since we are responsible for people’s treasure. But, we don’t take action on our thoughts or feelings, but rather follow our process. And right now, we’re fully invested in stocks. Below is some evidence that recently emerged that may counter the negative outlook I’m expecting for 2026 based on the mid-term election cycle.
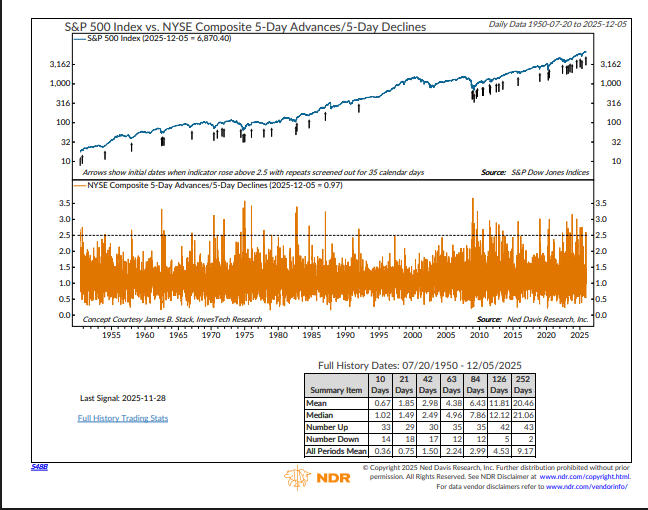
The chart above and data are also courtesy of Ned Davis Research, and plots the ratio of 5-day advances divided by 5-day declines using NYSE Composite Data back to 1950 (the chart shown goes back to 2015). The concept of the indicator originated with money manager Jim Stack. The most recent “Buy” signal just fired a few days ago.
Going back 75 years, there have been 45 prior cases, and on average, one year later, the mean return was 20.4%, with 95% of the outcomes positive (43 of 45). I even threw out 8 of the cases that I deemed to be “repeat” signals within 3 months of a prior signal, but that still leaves 35 data points, which is statistically significant.
There would be more confidence if other “thrust” models were to confirm this one, but one cannot argue with the evidence at present. The tape is bullish overall, but momentum suggests we’re in the late phases of an uptrend which is now 3 years old. It would be foolish to ignore the excessive valuations that currently exist in stocks, coupled with unprecedented speculation through various means, but credit markets aren’t suggesting danger at present, either. Regardless, it’s time to be aware, and vigilant.
The Decennial Cycle—Years Ending In 6
We’ll likely present the Ned Davis 2026 Cycle Chart in January for the S&P 500, which combines the elements of the one-year Cycle, the four-year Presidential Cycle and the Decennial Cycle, the latter of which is shown below. The Decennial Cycle is simply the total return of the market in every year ending in 2, or 3, or 4 and so on. See below the total returns of the S&P 500 for every year ending in 6 back to 1926. This is my pet peeve, but I don’t trust data prior to that time period.
1926 11.62%
1936 33.92%
1946 -8.07%
1956 6.56%
1966 -10.06%
1976 23.84%
1986 18.67%
1996 22.96%
2006 15.79%
2016 11.96%
This sounds like hocus pocus, doesn’t it. Invest based on the calendar? Yep. In this case we only have 10 data points, so from my statistical standpoint, this is useless. For what it’s worth, though, stocks gained in 8 of 10 years, pretty much in line with historical standards (76% of the time for calendar years back to 1926), with an average gain of 12.71%.
Is it possible that stocks could gain for the fourth year in a row in 2026? Absolutely. It’s happened before. I just don’t think it’s likely, given the late stage of momentum indicators, along with valuations and the mid-term election cycle, which in contrast to the above has averaged about 3% per annum gains historically.
New Rules For 401 (k) Participants Who Are Over 50
Have you ever heard of government simplicity? Nope. Me neither. That’s an oxymoron. Leave it to Congress and the lawyers who write the tax code to make simple stuff more complex. In 2026, the new maximum contribution to a 401 (k) for workers in those plans will be $24,500. If you are 50 and over, the “catch-up” contribution is $8,000, for a max total of $32,500, unless you happen to be 60 to 63, where you can “catch-up” $11,250. If you’re above 63, the “catch-up” reverts to $8,000.
Why 60 to 63 year-olds are special, I have no idea. But here’s the new twist. If you’re 50 and over and making “catch-up” contributions and your income in 2025 is above $150,000, your “catch-up” contributions must be deposited into a post-tax Roth account. Beware.
Can Someone Steal My IRA Funds?
Given today’s world of cyber attacks, phishing scams, and targeting of seniors with financial fraud, a long-time client recently emailed us a legitimate article in the New York Times detailing the experience of an investor with an IRA at Vanguard who discovered (luckily in time) that some of the assets in their IRA account had been transferred to Merrill Lynch, without their permission or knowledge.
And the question was, could this happen at Fidelity? Or Schwab? Or Bank of America? Yes, it could. Here’s the gist of what happened in the story outlined in the article. A client had gone onto the Vanguard platform to enter some trades in his wife’s Roth IRA and noticed that about $120,000 of securities were missing, and had been transferred out to Merrill Lynch a few days before. How could this have happened?
One first has to know how the back office systems on Wall Street work. When we transfer a clients’ account from another platform, the process normally goes through what is known as an ACATS transfer, which stands for Automated Customer Account Transfer Service. It’s how Wall Street firms “talk” to one another, and is actually pretty efficient.
There’s a verification process that goes on, but once verified, assets typically get moved within a couple of days. How could this have happened? Well, it’s probable that criminals somehow had acquired the wife’s personal information, including her name, email address, phone numbers and account number at Vanguard, not to mention the details of the holdings in the account. Who knows how, but they did. They then used that information to easily create a new account at Merrill Edge, which is the discount brokerage arm at Bank of America/Merrill Lynch.
When everything matched up, the securities were transferred. In this case, the client was very lucky that the securities were still in the account and hadn’t been sold and cashed out. Had the client not logged in very frequently to look at their holdings, the likelihood is that all the securities and money would have been gone.
With the following statement, I’m not tooting our own horn here, but rather stating the obvious. If you run all your accounts yourself, you’re the only one looking at them. If you don’t log in and look for weeks or months, could this happen to you if someone had stolen your data? Absolutely.
In our case as an advisor (and this goes for other advisors as well), whenever assets are transferred either into one of our clients accounts or out of their account, we are notified that morning via email. If something like the above were to take place, we would get notified and knowing that we had not done anything, we’d immediately be on the phone that morning with our Fidelity contacts asking them what was going on. We’d also be on the phone calling the client. And once Fidelity was notified that the transfer was not legitimate, there would be immediate action taken by them to stop things. The bottom line is, somebody needs to be paying attention at all times.
Portfolio Allocations
As noted above, our tactical equity allocations are 100% invested in stocks, with all five of our stock market risk management models currently in positive mode. Our high yield bond risk model also remains bullish, still on its May BUY signal. From a very short term perspective, December seasonality is typically weak until December 15, while the second half of the month is strong. In the next three weeks, we’ll see if Fed Chairman Powell takes away the punch bowl, only to have Santa bring it back.
Material Of A Less Serious Nature
A hillbilly went hunting one day in West Virginia and bagged three ducks. He put them in the bed of his pickup truck and was about to drive home where he was confronted by an ornery game warden who didn’t like hillbillies. The game warden ordered the hillbilly to show his hunting license, and the hillbilly pulled out a valid West Virginia hunting license.
The game warden looked at the license, then reached over and picked up one of the ducks, sniffed its butt, and said, “This duck ain’t from West Virginia. This is a Kentucky duck. You got a Kentucky huntin’ license, boy?” The hillbilly reached into his wallet and produced a Kentucky hunting license.
The game warden looked at, then reached over and grabbed the second duck, sniffed its butt, and said, “This ain’t no Kentucky duck. This duck’s from Tennessee. You got a Tennessee license?” The hillbilly reached into his wallet and produced a Tennessee license. The warden then reached over and picked up the third duck, sniffed its butt and said, “This ain’t no Tennessee duck. This here duck’s from Virginia. You got a Virginia huntin’ license?”
Again, the hillbilly reached into his wallet and brought out a Virginia hunting license. The game warden was extremely frustrated at this point, and he yelled at the hillbilly, “Just where the hell are you from?”
The hillbilly turned around, bent over, dropped his pants and said, “You tell me, you’re the expert.”
Speaking of game wardens, I’m on an unconventional fiction path for me, on the 3rd novel of 25 about a character named Joe Pickett, from a writer named C. J. Box who was featured in the Wall Street Journal several months ago. Pickett is a game warden in Wyoming and I have to say, it’s pretty interesting stuff that I normally wouldn’t read. If you love to read and have never heard of C. J. Box, check him out.
We’re in the holiday season, and it’s always appropriate to express our gratitude to you, our clients, for allowing us to serve you. May you, your friends and loved ones be blessed with good cheer, good health and good luck.
Best wishes,

Bob Kargenian, CMT
President
TABR Capital Management
TABR Capital Management, LLC (“TABR”) is an SEC registered investment advisor with its principal place of business in the state of California. TABR and its representatives are in compliance with the current notice filing and registration requirements imposed upon registered investment advisors by those states in which TABR maintains clients. TABR may only transact business in those states in which it is notice filed, or qualifies for an exemption or exclusion from notice filing requirements.
This newsletter is limited to the dissemination of general information pertaining to our investment advisory/management services. Any subsequent, direct communication by TABR with a prospective client shall be conducted by a representative that is either registered or qualifies for an exemption or exclusion from registration in the state where the prospective client resides. For information pertaining to the registration status of TABR, please contact TABR or refer to the Investment Advisor Disclosure web site (www.adviserinfo.sec.gov).
The TABR Model Portfolios are allocated in a range of investments according to TABR’s proprietary investment strategies. TABR’s proprietary investment strategies are allocated amongst individual stocks, bonds, mutual funds, ETFs and other instruments with a view towards income and/or capital appreciation depending on the specific allocation employed by each Model Portfolio. TABR tracks the performance of each Model Portfolio in an actual account that is charged TABR’s investment management fees in the exact manner as would an actual client account. Therefore the performance shown is net of TABR’s investment management fees, and also reflect the deduction of transaction and custodial charges, if any.
Comparison of the TABR Model Portfolios to the Vanguard Total Stock Index Fund, the Vanguard Total International Stock Fund, the Vanguard Total Bond Index Fund and the S&P 500 Index is for illustrative purposes only and the volatility of the indices used for comparison may be materially different from the volatility of the TABR Model Portfolios due to varying degrees of diversification and/or other factors.
Past performance of the TABR Model Portfolios may not be indicative of future results and the performance of a specific individual client account may vary substantially from the composite results above in part because client accounts may be allocated among several portfolios. Different types of investments involve varying degrees of risk, and there can be no assurance that any specific investment will be profitable.
For additional information about TABR, including fees and services, send for our disclosure statement as set forth on Form ADV from us using the contact information herein. Please read the disclosure statement carefully before you invest or send money.
A list of all recommendations made by TABR within the immediately preceding one year is available upon request at no charge. The sample client experiences described herein are included for illustrative purposes and there can be no assurance that TABR will be able to achieve similar results in comparable situations. No portion of this writing is to be interpreted as a testimonial or endorsement of TABR’s investment advisory services and it is not known whether the clients referenced approve of TABR or its services.