Pancake Inflation, And War Implications For Stocks
This month, we’re revisiting the topic of inflation and updating data we published in 2017, using our favorite breakfast joint as the guinea pig. A current look at REAL, or inflation-adjusted returns.
And given the hostilities that have broken out between the U.S. and Israel and Iran, we’d be remiss not to address the implications of war on the stock market. Finally, we’ll touch on the importance of keeping good records related to selling your home. Read on.
Pancake Inflation
On any given Saturday morning, there’s a good chance you’ll find me having breakfast at The Original Pancake House in Placentia, combined with reading five newspapers which are delivered on Saturday mornings (LA Times, OC Register, Wall Street Journal, Barron’s and Investor’s Business Daily). This habit began nearly 25 years ago in Yorba Linda, first with son Adam, then daughter Caroline along with countless family outings.
The owner of the Yorba Linda location lost their lease with the city in 2016 and subsequently re-opened in Placentia almost two years later, but the Anaheim location is connected through family that goes back to 1957.
In 2007, the Yorba Linda location for one day rolled their prices back to 1957. I reproduced their menu in our December 2007 newsletter and compared them. I did the same thing back in 2017, and am doing so again now, some 8 plus years later. In the table below, I’ve computed the overall inflation rate since 1957, along with the 10-year change from 2007 to 2017, as well as for the last 8 plus years.
Though obviously not perfect and only representing one restaurant, it’s a good (and nostalgic) representation of the cost of eating out, and is just one area of price inflation. We’ll touch on a few others later in a different table below.
| Entree/Item | 1957 | 2007 | 2017 | 2026 | Overall Inflation Rate | Last 8 years |
| Blueberry Pancakes | 0.90 | 6.40 | 7.60 | 14.00 | 4.12% | 7.93% |
| Buttermilk Pancakes | 0.50 | 4.95 | 6.45 | 12.00 | 4.78 | 8.06 |
| 10 Dollar Cakes | 0.65 | 4.75 | 5.85 | 10.00 | 4.10 | 6.93 |
| Ham & Eggs | 1.25 | 7.25 | 9.50 | 17.25 | 3.93 | 7.74 |
| Golden Waffle | 0.50 | 4.90 | 6.45 | 11.00 | 4.65 | 6.90 |
| Side of Bacon | 0.45 | 3.40 | 4.50 | 7.75 | 4.27 | 7.03 |
| Side of Ham | 0.65 | 4.15 | 5.50 | 9.25 | 3.98 | 6.71 |
| Lg Orange Juice | 0.45 | 3.20 | 3.50 | 5.20 | 3.66 | 5.07 |
| Coffee | 0.10 | 2.00 | 2.75 | 4.00 | 5.57 |
4.7 |
| Average | 4.34% |
6.79% |
For some additional perspective, the annualized inflation rate from 1957 to 2025 was approximately 3.65%, and for the time period from 2017 to 2025, it ran at 3.19%. In contrast, this group of breakfast items has increased the last 8 years plus at over double that rate. From 2007 to 2017, these same breakfast items had compound growth of just 2.39%, reflecting the low inflation rates of that time period.
Below is a table that looks at several other areas that affect all of us, such as auto insurance, gasoline and electricity, to name a few. The data is from the U.S. Bureau of Labor Statistics and the information is courtesy of Jim Stack and his great publication, InvesTech Research (www.investech.com).
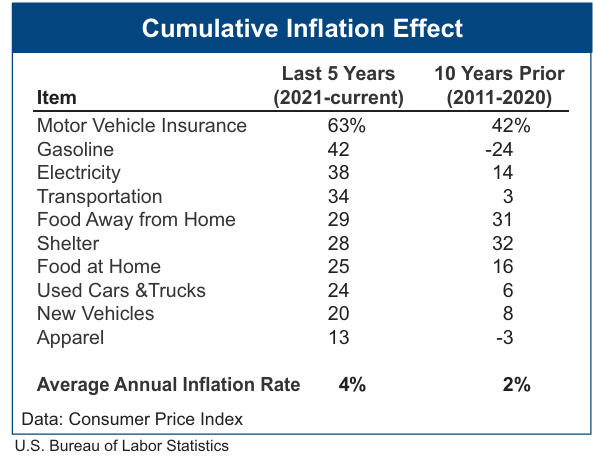
With this data, food away from home has increased 29% the past 5 years, which is approximately 5.22% per annum. There are several categories not in the table which have had significant jumps in the last 8 years, which would include college tuition costs, medical insurance and homeowner’s insurance. I can personally attest that just in the last three years, our own medical insurance premiums have increased about 40%, while the combined premiums on our homeowner’s insurance policy have more than doubled.
From an investment perspective, this is why you’ll hear the data from the financial community that if you want to stay ahead of inflation over the long run, the best way to do that is to invest in the stock market. For nearly 100 years now, going back to 1926, stocks provide the best inflation-adjusted return of any asset class (stocks, bonds, gold, real estate and cash), and it’s not even close.
Below is an update on yearly nominal and real return data for stocks and bonds from 2017 to 2025.
| Year | Stocks | Bonds | Inflation | Stock Real Return | Bond Real Return |
| 2017 | 21.67% | 3.46% | 2.1% | 19.57 | 1.36 |
| 2018 | -4.52 | -0.13 | 2.4 | -6.92 | -2.53 |
| 2019 | 31.33 | 8.61 | 1.8 | 29.53 | 6.81 |
| 2020 | 18.25 | 7.61 | 1.2 | 17.05 | 6.41 |
| 2021 | 28.53 | -1.77 | 4.7 | 23.83 | -6.47 |
| 2022 | -18.23 | -13.25 | 8.0 | -26.23 | -21.25 |
| 2023 | 26.11 | 5.60 | 4.1 | 22.01 | 1.5 |
| 2024 | 24.84 | 1.14 | 2.9 | 21.94 | -1.76 |
| 2025 | 17.71 | 7.03 | 2.6 | 15.11 | 4.43 |
| Average | 16.18% | 2.03 | 3.31 | 12.87 | -1.27 |
The first thing that should be apparent is that during the last 9 years, the stock market, as measured by the S&P 500 (the table uses VFINX Vanguard S&P 500 and VBMFX Vanguard Total Bond as proxies) has performed way above its nearly 100 year average, and bonds have substantially underperformed, thanks to the Federal Reserve Board keeping short rates almost at zero for several years, then rapidly increasing them to over 5% in an 18-month time span.
To get a longer term perspective on nominal and real returns, look at the chart below courtesy of Ned Davis Research (www.ndr.com).
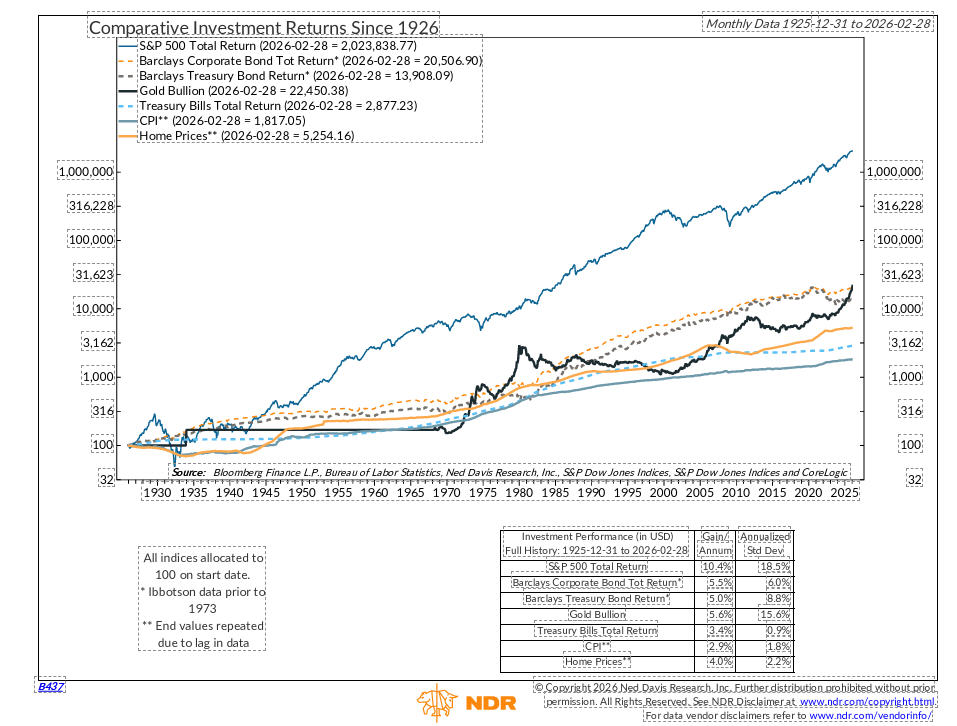
For basically the past 100 years, stocks as measured by the S&P 500, have returned 10.4% per annum, with a 7.5% per annum “real” return. That’s computed by taking 10.4% and subtracting the inflation rate of 2.9% during the same period. Corporate bonds were about 50% of the total return of stocks, but still beat inflation by 2.6% per annum. The recent 9-year period is not likely to continue with stocks beating inflation by nearly 13% per annum while bonds have actually lost ground to inflation. An important note about gold. Look at the dark black line which shows gold flat from about 1933 to around 1974. That’s because the price of gold was fixed, so I don’t think one can readily compute a return for the entire period. Importantly, from 1971 to the present, gold has compounded at just over 9% with stocks at 11% with the rate of inflation at about 3.86%.
Given the historical valuations of the stock market at current levels and the performance of the last 16 years which we’ve written about in past months, which has been about 50% above its long term average, don’t be surprised by an extended period of time going forward where stocks give up their edge on inflation. The period of 2000 to 2009 wasn’t that long ago. If all of this math has you a bit dizzy and you’re wondering what to make of this, just remember this—LIFE IS SHORT. EAT THE BACON!
War Implications For Stocks
Unless you’ve been on a news blackout (not necessarily a bad thing, unless you’re a sports fan!), the United States and Israel launched an attack on Iran just over one week ago, and financial markets have been in turmoil since then. One’s first instinct is that this is bad news for stocks. SELL! But the long term data doesn’t support that knee-jerk reaction. Ned Davis Research has been tracking “crisis events” back to 1907, and a summary of that data is shown below.
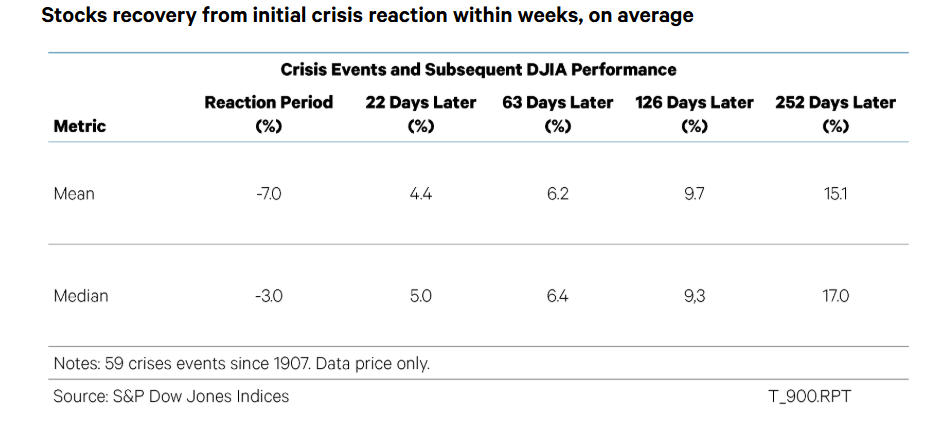
There have been 59 crisis events since 1907, and thus far, of the 57 where at least one year has passed from the beginning of the event, stocks based on the Dow Jones Industrials have posted gains 43 times, or 75% of the time, with mean gains of 15.1%. First of all, the 75% win rate is right in line with calendar year performance of stocks going back 100 years—mainly that stocks tend to go up 3 of every 4 years. As I write this, we are only 6 trading days into the mix, and below is what has happened thus far, through mid-morning of March 9.
S&P 500 -2.39%
NDX 100 -1.28%
S&P 600 (small caps) -4.85%
Vanguard Total Int’l Stock (VXUS) -7.39%
Gold -2.98%
Oil +38.5%
Thus far, with the exception of the disruption in oil markets, the reaction has been fairly muted, though I would note that the performance of international stocks has been significantly worse than U.S. large stocks. In addition, small stocks as measured by the S&P 600 Small Cap Index (IJR) are down twice as much as the S&P 500. Since late November, small caps and international have been leading the market.
The NDR study noted above is too long to publish, but InvestTech Research, who I also noted above, published a more abbreviated table of war and political events since 1940. It is reproduced below.
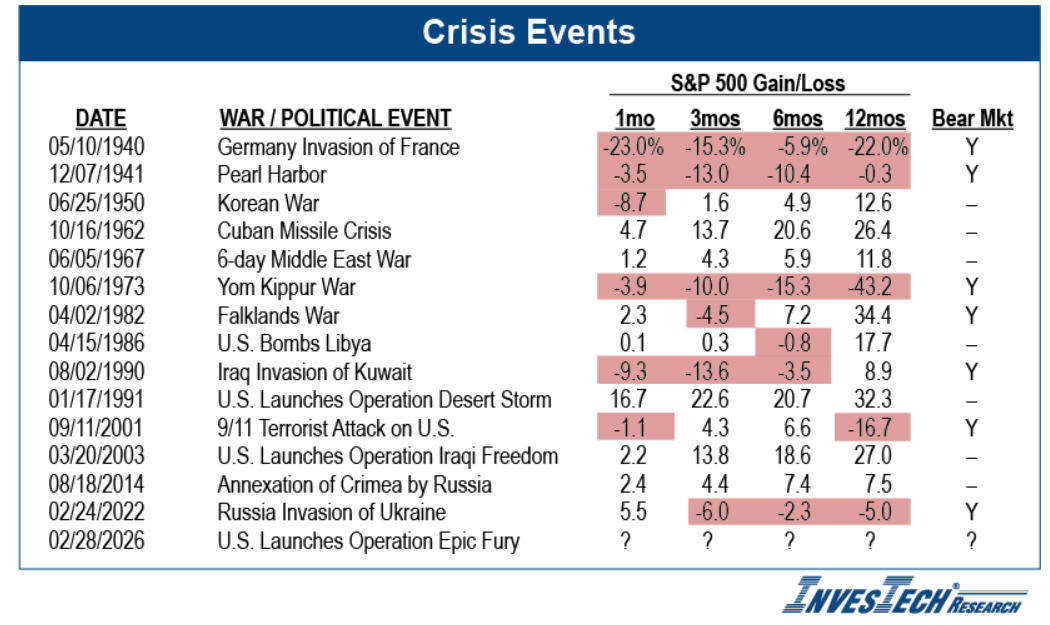
Of the five negative outcomes 1 year later, by far the worst was the Yom Kippur war which broke out in October of 1973 and was associated with the Arab oil embargo. Today, stocks are way more overvalued than they were in 1973, which was at the forefront of a two-year bear market which dropped the S&P 500 down about -45%.
Here are the takeaways from the past. The shorter the conflict, the better. We’re already seeing disruptions to the energy market with the Strait of Hormuz effectively closed. The price of gasoline nationwide has already increased 17% since the conflict began. If this turns into a prolonged military conflict, the odds will significantly increase for an economic recession and significant stock market losses. Given the stubbornness of President Trump as well as Iran’s leadership, a long-term conflict should not be ruled out.
Portfolio Allocations
No one can predict how this war will evolve. Thus far, there has been little impact on our various trading models, with four of our five stock market risk models still in a positive mode, giving our tactical accounts 80% exposure to stocks. We typically do not see deterioration in our models until prices have backed off at least -8% to -10% from a peak and as I write this, the S&P 500 is still less than -3% from its high. We did see some drop in our high yield bond risk model last week, which has been on a BUY signal since last May, but that will have to continue further to generate a SELL. Risk has definitely risen, but we have no evidence to cut back exposure significantly at this time.
Keep Those Records Home Sellers!
Since the late 1990s, homeowners have been allowed an exemption of $250,000 for single filers and $500,000 for joint filers on the sale of their principal residence. Here’s a past real example. My wife and I purchased a new home in Placentia in 1996 for $296,000 and sold it in 2006 for $870,000. When deducting realtor fees, I believe our net proceeds were around $820,000, for a gross gain of $524,000. With the $500,000 exclusion, we would still owe tax on $24,000.
However, during the first few years of living in the home, we spent about $50,000 on landscaping and another $50,000 for a pool, both expenses which can be added to your cost basis. As a result, our basis was actually about $396,000, making our net gain about $424,000, and therefore owing no tax. Did I get questioned on this from the IRS? Yes, we did. We did not get audited, but rather received a letter asking for the documentation for the landscaping and the pool. Being the financial guy, we had that and submitted it. We never heard from the IRS again.
If you think you can get by without documentation, think again. A recent story in the Wall Street Journal detailed a story about a real estate manager who sold two houses in Boston and New Hampshire for $743,000, after having bought the properties for $424,000. He claimed he owed no tax on the sales because of the tax code. The Tax Court Chief Judge disagreed, showing that even though the man owned the home in the Boston area, he didn’t file income-tax returns in Massachusetts or even have an in-state driver’s license. In other words, he didn’t even live in the home and therefore didn’t satisfy one of the requirements of living in the home for two of the five years preceding the sale.
In addition, the man claimed improvements on the second property, but those claims were disallowed because he could not produce adequate records verifying the claims. Credit card records were disallowed because they provided no detail (think purchases at Home Depot and Lowe’s) and a spreadsheet that was submitted was useless. Anybody can produce a spreadsheet. That doesn’t prove a thing.
I know we have clients who have lived in their home for 10, 20 or even 30 years or longer. Purchase and sale data is fairly easy to find because that is public data. But not improvements. And remember that certain things we do to maintain our homes don’t qualify as improvements. New carpet doesn’t count. A new roof doesn’t count. That’s considered maintenance. A new pool. That’s different. The tax code has a listing of what is considered, and what is not. Bottom line—keep your records, and don’t lie, cheat or steal!
Optimism as Preparation for Life
The following goes along with the thought that it’s not always what happens to you, but rather how we react to what happens to you. Our attitude. The following was in the January issue of Nick Murray’s excellent coaching newsletter, Nick Murray Interactive, and is a quote from the late Daniel Kahneman, author of Thinking Fast and Slow. There’s always something to worry about. This seems to be a pretty good antidote.
“If you are allowed one wish for your child, seriously consider wishing him or her optimism. Optimists are normally cheerful and happy, and therefore popular; they are resilient in adapting to failures and hardships, their chances of clinical depression are reduced, their immune system is stronger, they take better care of their health, they feel healthier than others and are in fact likely to live longer.
“Optimistic individuals play a disproportionate role in shaping our lives. Their decisions make a difference; they are the inventors, the entrepreneurs, the political and military leaders—not average people. They got to where they are by seeking challenges and taking risks. They are talented and they have been lucky, almost certainly luckier than they acknowledge…the people who have the greatest influence on the lives of others are likely to be optimistic and overconfident, and to take more risks than they realize.”
Material Of A Less Serious Nature
A city girl named Amy marries a Colorado rancher. One morning, on his way to check on the cows, the rancher says to Amy, “The insemination man is coming to impregnate one of our cows. So, I drove a nail into the 2 x 4 just above where the cows stall is in the barn. Please show him where the cow is when he gets here, OK?” The rancher then leaves for the field.
The artificial insemination man arrives and knocks on the front door. “I came to inseminate the cow,” he said. Amy takes him down to the barn.
They walk along the row of cows, and when Amy sees the nail, she tells him “This is the one right here,” she says. The man, assuming he is dealing with an airhead city girl, asks, “Tell me lady, cause I’m dying to know, how would YOU know that this is the right cow to be bred?” Amy replies, “That’s simple. By the nail over it’s stall.”
Laughing rudely at her, the man says “And please tell me, what is the nail for?”
The city girl turns to walk away and says sweetly over her shoulder, “I guess it’s to hang your pants on.”
It’s early March. College baseball has started conference play, and pro baseball is enmeshed in both spring training and the World Baseball Classic, NFL free agency started today and hockey is just about 20 games away from the most grueling post season of all, the NHL playoffs. What’s not to like, especially the crazy warm weather in Southern California in February/March (apologies to those of you on the East Coast!)?
As always, we truly appreciate the trust and confidence you place in all of us at TABR. Thank you.
Best wishes,

Bob Kargenian, CMT
President
TABR Capital Management
TABR Capital Management, LLC (“TABR”) is an SEC registered investment advisor with its principal place of business in the state of California. TABR and its representatives are in compliance with the current notice filing and registration requirements imposed upon registered investment advisors by those states in which TABR maintains clients. TABR may only transact business in those states in which it is notice filed, or qualifies for an exemption or exclusion from notice filing requirements.
This newsletter is limited to the dissemination of general information pertaining to our investment advisory/management services. Any subsequent, direct communication by TABR with a prospective client shall be conducted by a representative that is either registered or qualifies for an exemption or exclusion from registration in the state where the prospective client resides. For information pertaining to the registration status of TABR, please contact TABR or refer to the Investment Advisor Disclosure web site (www.adviserinfo.sec.gov).
The TABR Model Portfolios are allocated in a range of investments according to TABR’s proprietary investment strategies. TABR’s proprietary investment strategies are allocated amongst individual stocks, bonds, mutual funds, ETFs and other instruments with a view towards income and/or capital appreciation depending on the specific allocation employed by each Model Portfolio. TABR tracks the performance of each Model Portfolio in an actual account that is charged TABR’s investment management fees in the exact manner as would an actual client account. Therefore the performance shown is net of TABR’s investment management fees, and also reflects the deduction of transaction and custodial charges, if any.
Comparison of the TABR Model Portfolios to the Vanguard Total Stock Index Fund, the Vanguard Total International Stock Fund, the Vanguard Total Bond Index Fund and the S&P 500 Index is for illustrative purposes only and the volatility of the indices used for comparison may be materially different from the volatility of the TABR Model Portfolios due to varying degrees of diversification and/or other factors.
Past performance of the TABR Model Portfolios may not be indicative of future results and the performance of a specific individual client account may vary substantially from the composite results above in part because client accounts may be allocated among several portfolios. Different types of investments involve varying degrees of risk, and there can be no assurance that any specific investment will be profitable.
For additional information about TABR, including fees and services, send for our disclosure statement as set forth on Form ADV from us using the contact information herein. Please read the disclosure statement carefully before you invest or send money.
A list of all recommendations made by TABR within the immediately preceding one year is available upon request at no charge. The sample client experiences described herein are included for illustrative purposes and there can be no assurance that TABR will be able to achieve similar results in comparable situations. No portion of this writing is to be interpreted as a testimonial or endorsement of TABR’s investment advisory services and it is not known whether the clients referenced approve of TABR or its services.