A Bottom, But Not THE Bottom, And What To Expect From Here
Given the almost unprecedented decline this month in equity markets, I thought it would be timely to talk about the technical condition of the stock market—what has transpired, and what we are likely to see as we enter the new year.
So, here goes.
From the December 3 close of 2790 to the December 24 close of 2351, the S&P 500 Index dropped -15.73% in only 14 trading days. It was a near vertical decline, as shown in the chart below, courtesy of www.stockcharts.com. The decline generated new extremes in downside momentum on a variety of technical breadth indicators. One common one is the number of stocks making new 52 week lows in price, as shown on the bottom clip below.
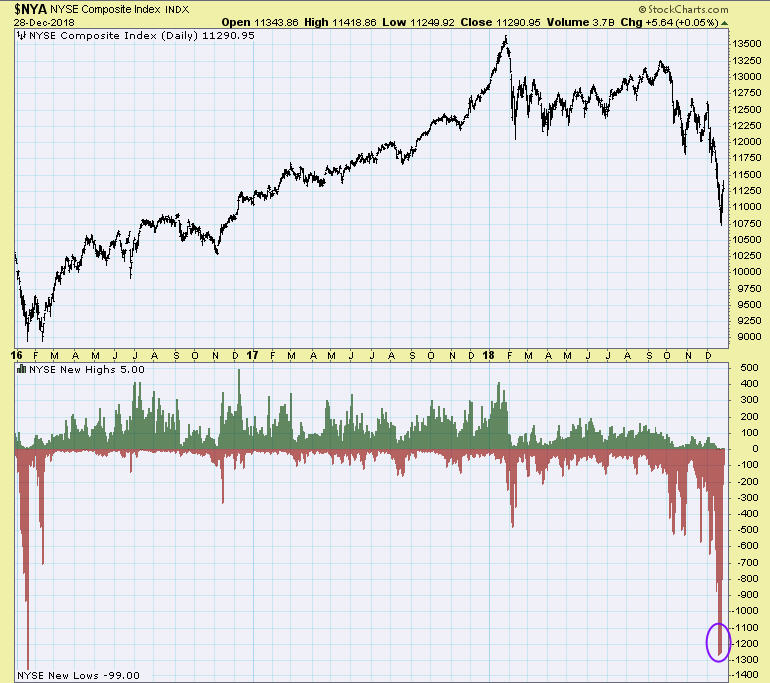
There were 1270 new lows on December 20, and 1256 new lows on December 24. Rarely do bear markets make a final price low coincident with momentum lows, so the first message I want to clearly convey is that it is highly probable that in the coming weeks, prices are going lower, and perhaps, much lower.
You can see on the lower left corner of the chart the behavior during the last decent price decline in stocks, which ended in February 2016. There was a double bottom in price (top clip), with a significant reduction in the number of new lows at the second bottom, going from about -1300 to -700. This conveys a lessening of selling pressure, and is one of the things we will be looking for in coming weeks.
Not all declines will be as mild as the one in 2016. Back in 2008, the first momentum low was made in mid-October. There were then three subsequent lows made in late October, mid-November and finally, in March of 2009, before stocks bottomed for good. That was an extreme decline, the biggest since 1931, and one shouldn’t assume that the current decline will resemble the 2008 version.
But, there is an absolute lesson in the way markets are acting. There are extreme price moves in each direction, such as last Wednesday’s 1000 point plus gain in the Dow Jones Industrial Average, but was only about a 5% gain in the S&P 500 Index. For some quick history, investors should recall this.
On October 13, 2008, the NY Composite Index gained 12.2% in ONE day. The Index then lost -18.8% in the next 10 days. It rose again 10.3% on October 28, 2008, only to plunge -26.6% from November 4 to November 20. Big one day gains in bear markets are quite common, only to be followed by more selling and lower price lows.
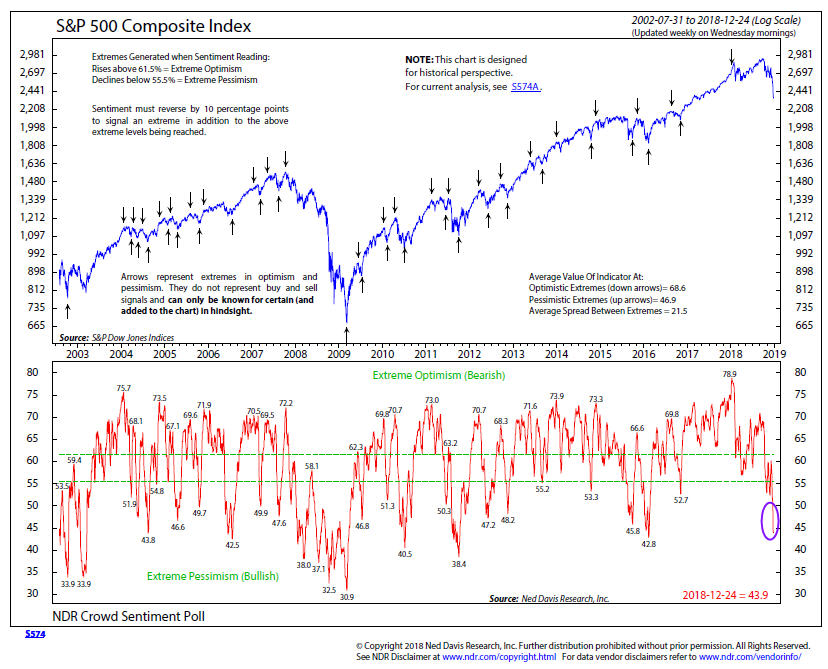
The next area to examine is sentiment. Needless to say, after a 15% decline in 14 days, traders have become quite pessimistic. The chart above, courtesy of Ned Davis Research, is their Crowd Sentiment Poll. This past week, this indicator reached its lowest level in three years. Unfortunately, extremes are only known in hindsight, and going back to 2002, one can see there is a lot of room to go lower.
A shorter term version of the above indicator from Ned Davis Research went below the 10 level on December 24, only the 10th such time in the history of the indicator back to 1995. In 8 of the 9 prior instances, the S&P 500 was higher three months later, with gains ranging from 5% to 16%. However, the lone loss was a big drop of -15%.
The message here is that stocks were very compressed to the downside after last Monday’s drop, so a relief rally was overdue and not surprising. What was surprising, though, is that on Friday, the put-call ratio dropped considerably after only two days of recovery, indicating a sense of complacency that would likely not be present if the rally was for real.
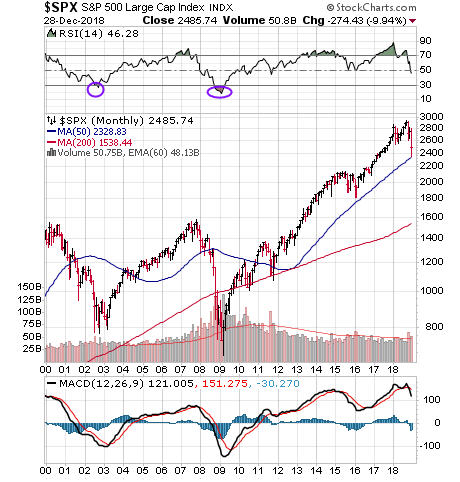
The chart above will give us some longer term context. It is a monthly chart of the S&P 500 Index, also courtesy of www.stockcharts.com. The main thing I would focus on is the RSI indicator in the top clip. This indicator, called the Relative Strength Index, is a measure of momentum. Like the last two bull market peaks in 2000 and 2007, the indicator peaked above the 70 level at the end of 2017, then gave off a glaring negative divergence at the price highs in September.
Notice that the RSI never declined below the 50 level during the 2015-16 decline, but went all the way below the oversold 30 zone in both 2002-03 and 2009, which marked the final bottoms and wonderful buying opportunities. Since the RSI is already at 46, we think the current decline is going to turn out more like 2000-2002 and 2007-2009 than the milder decline of 2015-16.
We noted major chart breakdowns in the last update, with major uptrend lines being broken back to the 2009 bottom. If the 2330 level on the S&P 500 gives way in coming weeks (the vicinity of the December 24 low), the next support levels are the 2100 zone and then, 1800. From the current level around 2490, those would represent additional declines ranging from -15% to -27%.
Above, we’ve focused on stock market technicals, which are the primary ingredients in our various stock market risk models (although interest rates and the bond market do represent some of the mix). I want to update a fundamental indicator that we track, which has a history going back to about 1965, and which we’ve featured before.
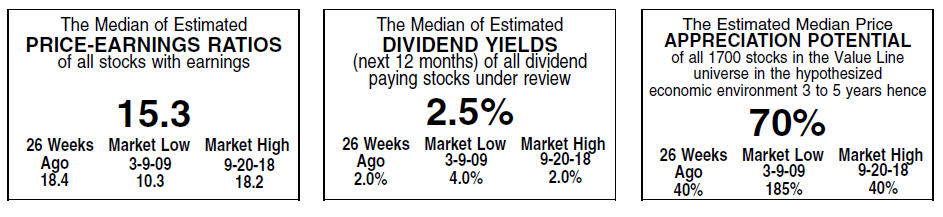
It is called the VLMAP, or Value Line Median Appreciation Potential, from the long standing Value Line research firm. Historically, the indicator has ranged from 20% on the low end, to 180% on the high end. The higher the number, the better future 3 to 5 year returns are expected to be, and vice versa. As with virtually all valuation type indicators, it is not necessarily a good timing tool. How low is low, and how high is high?
In January of this year, the indicator reached 25%, one of the lowest readings on record, and that presently looks like a really good time to have sold stocks. With the so far -19% drop in the S&P 500 (much worse in mid cap, small cap and the NASDAQ and International), the indicator is now up to 70%. The sweet spot seems to be in the 90% to 110% range (obviously, with certain exceptions), and we’re not there yet, but are likely to get there if the above price targets are met. It would be the best buying opportunity for stocks in 10 years, and something we’ve been patiently waiting for as a trigger to add capital to TABR’s Dividend Stock strategy.
Portfolio Allocations
Our equity allocations were 50% as of December 3, certainly quite defensive for many in our industry, but three more of our stock market risk models have flipped negative since then, with 2 of the 3 exiting above the 2500 level on the S&P 500. At present, equity allocations are about 88% in cash, and there is a high probability we’ll be at 100% cash sometime next week, as we expect all 8 of our models to be negative at that point.
I should convey a reminder at this juncture about our process. It is not forecasting, but rather disciplined and unemotional. The fact that we are 88% in cash does not mean that stocks will decline significantly from here. But, I can tell you this. Every major decline in stocks has taken place when the majority of our models are negative, as they are now. We are preparing to win, by not losing (much). The cash we are holding is earning 2.23% as of this writing, better than almost any bank any of you can put money in.
Just as importantly, our process will tell us when to begin adding exposure, something most humans will not be able to do when the time comes, because they will likely be scared out of their minds, and relating the recent past to the future. There is a certain amount of uncertainty and risk that comes with the territory of investing in the financial markets.
We see part of our job as minimizing that risk so that our clients can achieve their financial planning goals while being able to sleep at night, and not abandoning the process. We also feel having skin in the game is vitally important. Everything we do with client money, we do with our own money, period. And though we do run some passive buy and hold portfolios for clients who wish to be more aggressive, they are not representative of who we are.
Whether one is 35, 61 (like us), or even 75 or 80 or older, we’re simply not interested in sitting through a stock market decline of -30% to -50% or more, and then hoping that stocks recover. Would you drive a car, or own a home in Southern or Northern California, and not carry auto insurance or homeowners insurance? I would hope not. But that’s what passive, buy and hold strategies are. And it takes just one accident, or horrific fire or earthquake, to completely destroy one’s plans. We tend to forget mentioning this much, but remember, TABR stands for Technical Analysis Based Risk-Management.
Enough preaching. I forgot to add that our high yield bond risk model remains decidedly in negative territory, also making a new low this week. The average yield on junk bonds has risen to around the 7% level, but we’re hoping for at least a return to the 9-10% zone before our model turns positive. As always, though, we’ll let the market tell us.
In sum, risk for the stock market and junk bonds in the present environment is quite high, and that is reflected in the position of our various models. Surprises are likely to come to the downside until values become more apparent, but how low is low is anybody’s guess. The second half of 2019 is likely to be more productive than the first half, but that is pure conjecture.
We hope you have a Happy New Year, but most importantly, a healthy one, because without good health, life isn’t so fun. We’ll have a full recap of the year and our strategies in a few weeks, but wanted to get this out while it is timely. And don’t worry, Material Of A Less Serious Nature will be there too!
Sincerely,

Bob Kargenian, CMT
President
TABR Capital Management, LLC (“TABR”) is an SEC registered investment advisor with its principal place of business in the state of California. TABR and its representatives are in compliance with the current notice filing and registration requirements imposed upon registered investment advisors by those states in which TABR maintains clients. TABR may only transact business in those states in which it is notice filed, or qualifies for an exemption or exclusion from notice filing requirements.
This newsletter is limited to the dissemination of general information pertaining to our investment advisory/management services. Any subsequent, direct communication by TABR with a prospective client shall be conducted by a representative that is either registered or qualifies for an exemption or exclusion from registration in the state where the prospective client resides. For information pertaining to the registration status of TABR, please contact TABR or refer to the Investment Advisor Disclosure web site (www.adviserinfo.sec.gov).
The TABR Model Portfolios are allocated in a range of investments according to TABR’s proprietary investment strategies. TABR’s proprietary investment strategies are allocated amongst individual stocks, bonds, mutual funds, ETFs and other instruments with a view towards income and/or capital appreciation depending on the specific allocation employed by each Model Portfolio. TABR tracks the performance of each Model Portfolio in an actual account that is charged TABR’s investment management fees in the exact manner as would an actual client account. Therefore the performance shown is net of TABR’s investment management fees, and also reflect the deduction of transaction and custodial charges, if any.
Comparison of the TABR Model Portfolios to the Vanguard Total Stock Index Fund, the Vanguard Total International Stock Fund and the Vanguard Total Bond Index Fund is for illustrative purposes only and the volatility of the indices used for comparison may be materially different from the volatility of the TABR Model Portfolios due to varying degrees of diversification and/or other factors.
Past performance of the TABR Model Portfolios may not be indicative of future results and the performance of a specific individual client account may vary substantially from the composite results above in part because client accounts may be allocated among several portfolios. Different types of investments involve varying degrees of risk, and there can be no assurance that any specific investment will be profitable.
The TABR Dividend Strategy presented herein represents back-tested performance results. TABR did not offer the Dividend Strategy as an investment strategy for actual client accounts until September/October 2014. Back-tested performance results are provided solely for informational purposes and are not to be considered investment advice. These figures are hypothetical, prepared with the benefit of hindsight, and have inherent limitations as to their use and relevance. For example, they ignore certain factors such as trade timing, security liquidity, and the fact that economic and market conditions in the future may differ significantly from those in the past. Back-tested performance results reflect prices that are fully adjusted for dividends and other such distributions. The strategy may involve above average portfolio turnover which could negatively impact upon the net after-tax gain experienced by an individual client. Past performance is no indication or guarantee of future results and there can be no assurance the strategy will achieve results similar to those depicted herein.
Inverse ETFs
An investment in an Inverse ETF involves risk, including loss of investment. Inverse ETFs or “short funds” track an index or benchmark and seek to deliver returns that are the opposite of the returns of the index or benchmark. If an index goes up, then the inverse ETF goes down, and vice versa. Inverse ETFs are a means to profit from and hedge exposure to a downward moving market.
Inverse ETF shareholders are subject to the risks stemming from an upward market, as inverse ETFs are designed to benefit from a downward market. Most inverse ETFs reset daily and are designed to achieve their stated objectives on a daily basis. The performance over longer periods of time, including weeks or months, can differ significantly from the underlying benchmark or index. Therefore, inverse ETFs may pose a risk of loss for buy-and-hold investors with intermediate or long-term horizons and significant losses are possible even if the long-term performance of an index or benchmark shows a loss or gain. Inverse ETFs may be less tax-efficient than traditional ETFs because daily resets can cause the inverse ETF to realize significant short-term capital gains that may not be offset by a loss.
For additional information about TABR, including fees and services, send for our disclosure statement as set forth on Form ADV from us using the contact information herein. Please read the disclosure statement carefully before you invest or send money.
A list of all recommendations made by TABR within the immediately preceding one year is available upon request at no charge. The sample client experiences described herein are included for illustrative purposes and there can be no assurance that TABR will be able to achieve similar results in comparable situations. No portion of this writing is to be interpreted as a testimonial or endorsement of TABR’s investment advisory services and it is not known whether the clients referenced approve of TABR or its services.