A Change In Tone?
A little over two weeks ago, the S&P 500 closed at its lowest level of the year, at 3900, down over -18% from year-end. Other indexes, such as the S&P 600 (small caps), S&P 400 (mid caps), and the EFA (international), made higher lows that day, and the number of stocks making new lows diminished, establishing a positive divergence.
This was the backdrop for a nearly 7% rally in several indexes the following week, and there was some other positive evidence that had not been present during a similar rally in March. One such thing was a BUY signal from our high yield bond risk model.
As a result, some things are different, and we’ll examine that inside. This is an example of following our discipline, even though our opinion is stocks have not made an important bottom here.
Improving Market Breadth
As mentioned above, when market indexes made new lows a couple of weeks back, fewer stocks went along for the ride. That’s best displayed visually, with the chart below courtesy of www.decisionpoint.com.
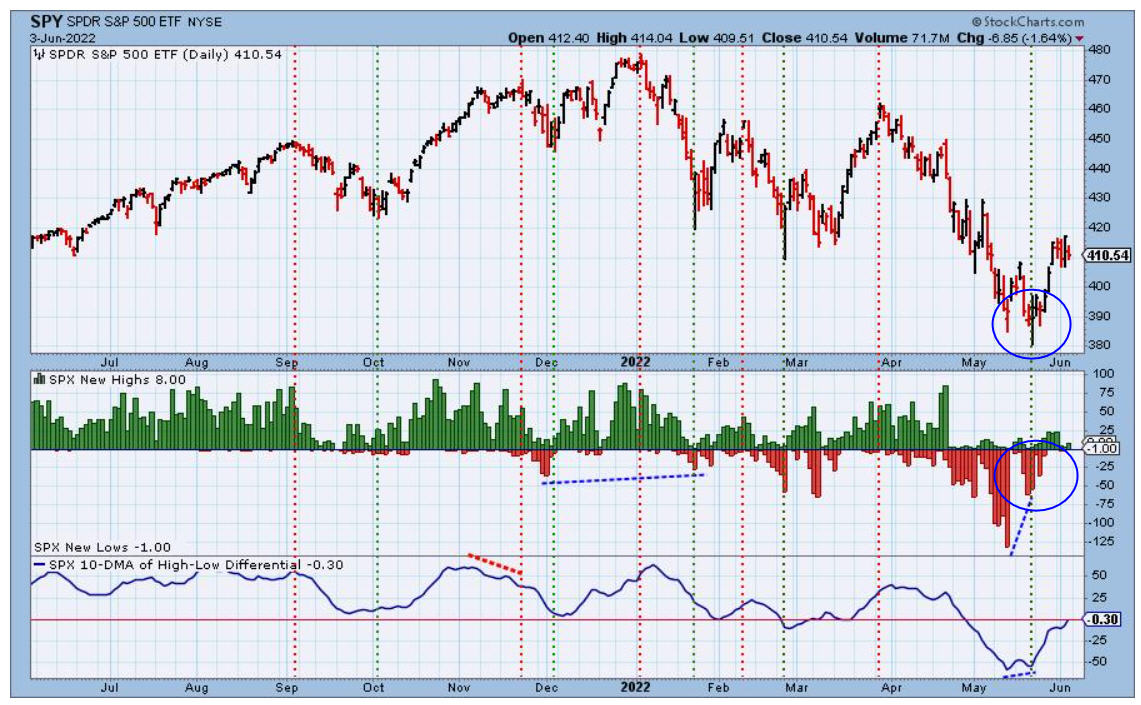
As the index made a new price low on May 19 and 20, the number of stocks in the S&P 500 Index making new 52-week price lows declined, indicating fewer stocks were participating in the decline. In other words, a slowing of the downside momentum. That’s usually at least short term bullish. Coupling with that indication was that the NYSE High Low Index had moved below 10% earlier in the month. This indicator measures the percentage of stocks making new 52-week highs versus the total number of stocks making new highs plus lows. So, if one had a day when 40 stocks made new highs, but there were also 70 stocks making new lows, you would divide 40 by (40 +70), and get 36.3%. You then smooth the daily readings with a 10-day moving average, and plot it on a chart, which is what our friends at Dorsey Wright do. Their research can be found at www.dorseywright.com.
When this indicator moves below 10%, it’s an indication that stocks are quite oversold, and washed out. Historically, reversals from below 10% have been good places to re-enter the market. This doesn’t happen very often. According to Dorsey Wright, as the table below shows, there have only been 26 prior cases since 1980 in 42 years. Five of these cases overlapped, taking place within 2 months of each other, so you could argue this has only happened about once every two years.
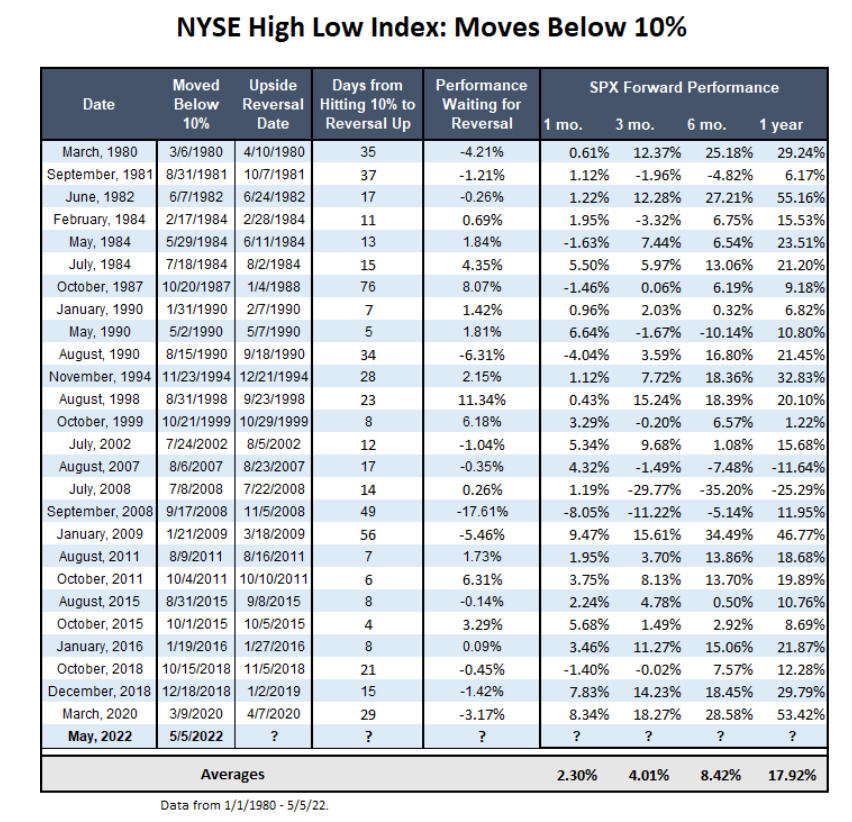
In 26 prior cases, looking six months out after a reversal up, there have only been 5 losses, with average gains at nearly 8.5%. When extending the time period to one year, average gains increase to nearly 18%, way above the approximate 10% norm, with only two negative outcomes. The big caveat, of course, is that one of those losses was over -35% for six months, and over -25% for one year. Alas, there is no perfect indicator or set of rules. All I’m saying is, this is an indication of something positive that has taken place, and it has shifted the odds a bit.
Adding to this positive evidence is the improvement in short term market breadth. Two weeks ago, we had three consecutive days when the percentage of stocks that moved up (advanced) divided by the total number of stocks exceeded 80%. Again, according to our friends at Dorsey Wright, this has only occurred 12 prior times in the past 52 years. Pretty rare. See the table below.

Historical results have been most impressive. Median gains have been nearly 15% after six months, and nearly 26% after one year, with no losers. Unfortunately, with only 12 occurrences, there’s no statistical significance in the data. Still, this is nothing but a positive, as is another breadth thrust from a chart that Ned Davis Research maintains. They maintain a database of multi-cap equities, and when the percentage of stocks above their 10-day moving averages breaks above 90%, it is considered a “breadth” thrust. There have been 37 prior cases since 1982, including one in March and another on May 27. In this case, though, the numbers are anything special, implying only average returns going forward.
The above data has focused on stocks advancing versus declining. On the same three days noted above, there were three consecutive 80% Upside Days, where at least 80% of NYSE Volume and Points were to the upside. One would think this would also be bullish. Here’s the cold water. According to our friends at Lowry Research Corporation, since 1940, there have only been 10 such occurrences. They produced below-average outcomes, with six-month gains averaging 6.89%, and one-year gains at 4.78%. More importantly, seven of the ten instances took place during bear markets and did not mark the bottom. Pick your bias.
Why A Recession Call Is Such A Big Deal
The risk of slower economic growth has increased. On May 18, Target, where many of us shop, had a bad earnings report and outlook, indicating their profit margins were shrinking because of increased costs, and the stock price dropped -25% in one day. Just prior to that, Walmart had similar warnings, and its stock fell -17% over two days. Forecasting a recession is no different than predicting what stocks will do 6 or 12 months out–it is very difficult to do. And, we’re certainly not going to try. But, below is an illustration from Ned Davis Research which shows the difference between a bear market which takes place during a non-recessionary period and one that takes place during a recession.
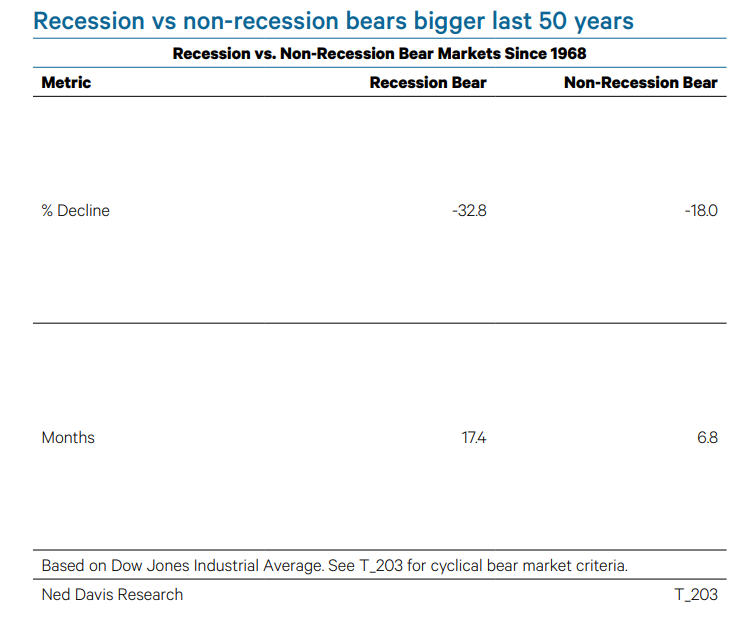
You can see why the implications are so relevant. If the U.S. economy avoids recession, it’s possible the stock market, at least as measured by the S&P 500, has seen its worst already. But, if a recession is ahead of us, it’s likely that stock market losses have only reflected about half the eventual pain. Given that none of the indicators we outlined last month (The Trinity) have reached their thresholds, my opinion is such that after this current rally runs its course, there will be lower lows ahead. We’ve retraced the minimum of the two year rally, a 38% retracement that on an intraday basis, reached the low 3800 level on the S&P 500. But I eventually expect we’re headed to the 3200 to 3500 range, minimum, where there would be a 50% or 62% retracement. As usual, we’ll let the market tell us.
Portfolio Allocations At Present
There have been no changes in our stock market risk models, all five of which remain negative since January 31. Our equity exposure remains at its minimum floor of 20%, most of that being in sector funds. The Value Line MAPS indicator we track, part of the Trinity mentioned last month, was at 60% this week, still pretty far below the 90% level that historically would be a minimum level to think about adding capital.
What has changed, though, is our high yield bond risk model flipped to a BUY signal last week. This is significant, because though we don’t use this model to change allocations in the stock market, it’s actually worked better than almost all of our stock market models since the 2008 bear market.
To try and minimize future whipsaws, we’ve broken our model into two signal levels. The first generated a SELL on November 29, and we sold all remaining positions on January 31, then went fully invested last week on May 31. In the chart below, we’ve circled the approximate areas when we sold and repurchased, using a chart of the Blackrock High Yield Fund (BHYIX) as a real example. The chart is courtesy of www.stockcharts.com.
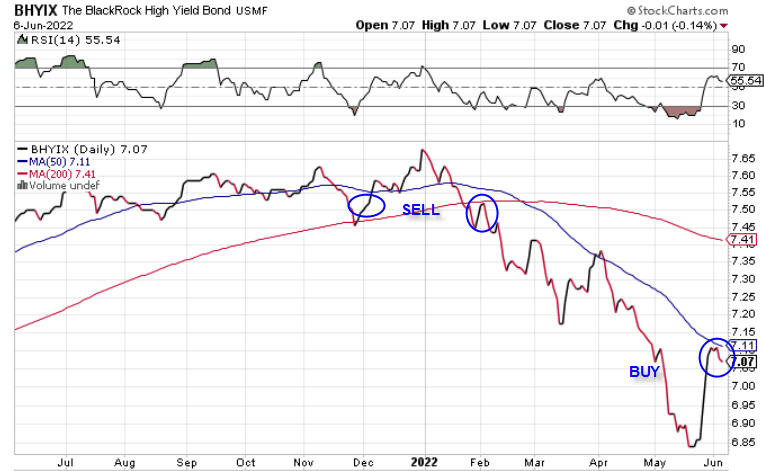
On May 20, the average high yield bond fund was down about -10% for the year, and most have rallied about 3% off the bottom since then. We were able to buy back the various funds we use at prices that were some -5% cheaper than what we sold for. In the bond market, that is a big deal. Our model is very good, but no model is perfect.
What is disconcerting is that even after such a decline, the approximate yield for most high yield funds is still only in the 5% plus range. That’s not exactly bargain territory. Spreads versus Treasuries have hardly expanded at all, mostly because Treasuries have lost just as much ground, if not more, than high yield.
I would normally be very excited by such a BUY signal from our model. Significant rallies in stocks are almost always preceded by BUY signals from our high yield model. Conversely, virtually every significant decline in stocks, including the one that started in early January, is preceded by a SELL from our high yield model. Something has to give from here. It is strange that our bond model has given a BUY with no support (yet) from any of our stock market models. Usually, good signals from the high yield model show positive price action right from the beginning. It’s only been 5 days thus far, but that’s not happening at present, and may be a warning that stocks aren’t going anywhere, and neither are high yield bonds.
Material Of A Less Serious Nature
An eight-year-old girl went to the office with her father on “Take Your Kid To Work Day.”
As they were walking around the office, the young girl started crying and getting very cranky. Her father asked what was wrong with her. As the staff gathered round, she sobbed loudly: “Daddy, where are all the clowns that you said you worked with?”
School’s out for summer, the Angels are on an 12-game losing streak, and Top Gun Maverick is one helluva movie. I loved it. If you need a treat, there’s always ice cream, most notably Rich Farms in Placentia. You’ll find me there many times during the summer, and winter, and fall. . .which is why I try to still run 5 days a week. That activity has been interrupted by a baseball injury (no, it’s not cup related!), but my badly pulled right calf is just about ready for full time training again. Yes.
Thanks for getting this far, and your continued trust and confidence in all of us at TABR.
Sincerely,

Bob Kargenian, CMT
President
TABR Capital Management, LLC (“TABR”) is an SEC registered investment advisor with its principal place of business in the state of California. TABR and its representatives are in compliance with the current notice filing and registration requirements imposed upon registered investment advisors by those states in which TABR maintains clients. TABR may only transact business in those states in which it is notice filed, or qualifies for an exemption or exclusion from notice filing requirements.
This newsletter is limited to the dissemination of general information pertaining to our investment advisory/management services. Any subsequent, direct communication by TABR with a prospective client shall be conducted by a representative that is either registered or qualifies for an exemption or exclusion from registration in the state where the prospective client resides. For information pertaining to the registration status of TABR, please contact TABR or refer to the Investment Advisor Disclosure web site (www.adviserinfo.sec.gov).
The TABR Model Portfolios are allocated in a range of investments according to TABR’s proprietary investment strategies. TABR’s proprietary investment strategies are allocated amongst individual stocks, bonds, mutual funds, ETFs and other instruments with a view towards income and/or capital appreciation depending on the specific allocation employed by each Model Portfolio. TABR tracks the performance of each Model Portfolio in an actual account that is charged TABR’s investment management fees in the exact manner as would an actual client account. Therefore the performance shown is net of TABR’s investment management fees, and also reflect the deduction of transaction and custodial charges, if any.
Comparison of the TABR Model Portfolios to the Vanguard Total Stock Index Fund, the Vanguard Total International Stock Fund, the Vanguard Total Bond Index Fund and the S&P 500 Index is for illustrative purposes only and the volatility of the indices used for comparison may be materially different from the volatility of the TABR Model Portfolios due to varying degrees of diversification and/or other factors.
Past performance of the TABR Model Portfolios may not be indicative of future results and the performance of a specific individual client account may vary substantially from the composite results above in part because client accounts may be allocated among several portfolios. Different types of investments involve varying degrees of risk, and there can be no assurance that any specific investment will be profitable
For additional information about TABR, including fees and services, send for our disclosure statement as set forth on Form ADV from us using the contact information herein. Please read the disclosure statement carefully before you invest or send money.
A list of all recommendations made by TABR within the immediately preceding one year is available upon request at no charge. The sample client experiences described herein are included for illustrative purposes and there can be no assurance that TABR will be able to achieve similar results in comparable situations. No portion of this writing is to be interpreted as a testimonial or endorsement of TABR’s investment advisory services and it is not known whether the clients referenced approve of TABR or its services.