A Great 2019, Higher Highs Likely, And The Not So SECURE Act
When international equities lag U.S. stock indexes by over 10 percentage points, and still post gains of over 20%, you know it’s been a great year for stocks. When interest rates drop by 75 basis points, and the average high yield bond fund gains over 13%, you know it’s been a great year for bonds. That about sums up the year that is almost done. So, enjoy it while it’s here. This isn’t putting coal in your stocking, but a repeat of this performance in 2020 is highly unlikely. That doesn’t mean, though, that next year will be a negative year. No one knows. Don’t waste your time reading the 2020 outlooks. How many “forecasters” predicted last December that the S&P 500 would be up nearly 30% this year? Instead, we prefer to look at the data.
How about if I told you that there was a 75% chance that stocks would be up in 2020? Pretty decent odds, huh? Until I give you more context. That’s because since 1926, stocks do in fact go up about 3 of every 4 years. But, you say, isn’t next year an election year? Yes. On average, stocks do gain ground during election years, but not nearly as much as Pre-Election years (like 2019). And, what if President Trump is impeached? Won’t that matter? Likely not. If it mattered, stocks wouldn’t be making all-time highs as I write this. In our view, the most important thing one can do is to pay attention to what the market is saying, by observing what it is doing.
It is going up. Period. And pretty strongly in recent weeks, having risen over 10% in the last 50 days. And, high yield bond funds are making new highs. The advance/decline line for the NYSE is making new highs. Finally, the weekly Relative Strength Index (RSI) for the S&P 500 Index just exceeded the 70 level for only the 28th time in 87 years (since 1933). None of these conditions guarantee that stocks will advance in 2020. But, given history, these indications suggest prices will be higher several months from now than they are now. That’s about as far as the crystal ball can see. As we get closer to summer, pay attention to the July to October period. Forget your politics. Just watch what stocks do. If they are going up in the 3 to 4 months prior to the election, history suggests Donald Trump will be re-elected. If stocks instead are down, the odds would favor the Democratic nominee. Keep it simple. Yes, stocks are expensive by many valuation standards. Someday, they will pay the piper. But, fighting the market when the Fed is loosening monetary policy and governments worldwide are providing fiscal stimulus is a losing game.
Finally, last week, Congress passed what is known as the SECURE Act, the biggest retirement-oriented legislation to pass in over a decade. We’ll touch on the highlights, and perhaps revisit it early next year. We can’t change it, so we have to live with it, and figure out how it will impact various clients, and perhaps alter some of the planning we had been doing. I’ll tell you this, though. It’s a crappy bill, and in my view, will be more harmful to investors than it will help them. Should we expect anything less from Congress?
Why We Should Expect Higher Stock Prices Before A Peak
The RSI, or Relative Strength Index, invented by Welles Wilder, is a measure of momentum. See the top clip in the chart below of the S&P 500 Index, using a weekly chart. The chart is courtesy of www.stockcharts.com.

In general, when the 14-week RSI goes below 30, the index is oversold, and when it goes above 70, it is overbought. Neither of these happens very often. According to Doug Ramsey, chief investment officer at the Leuthold Group, going above 70 has only happened 27 times in the past 86 years, going back to 1933. As you can see above, occurrence number 28 has recently taken place. The table below, courtesy of the Leuthold Group, shows that most of the time, the stock market has gone on to further gains.
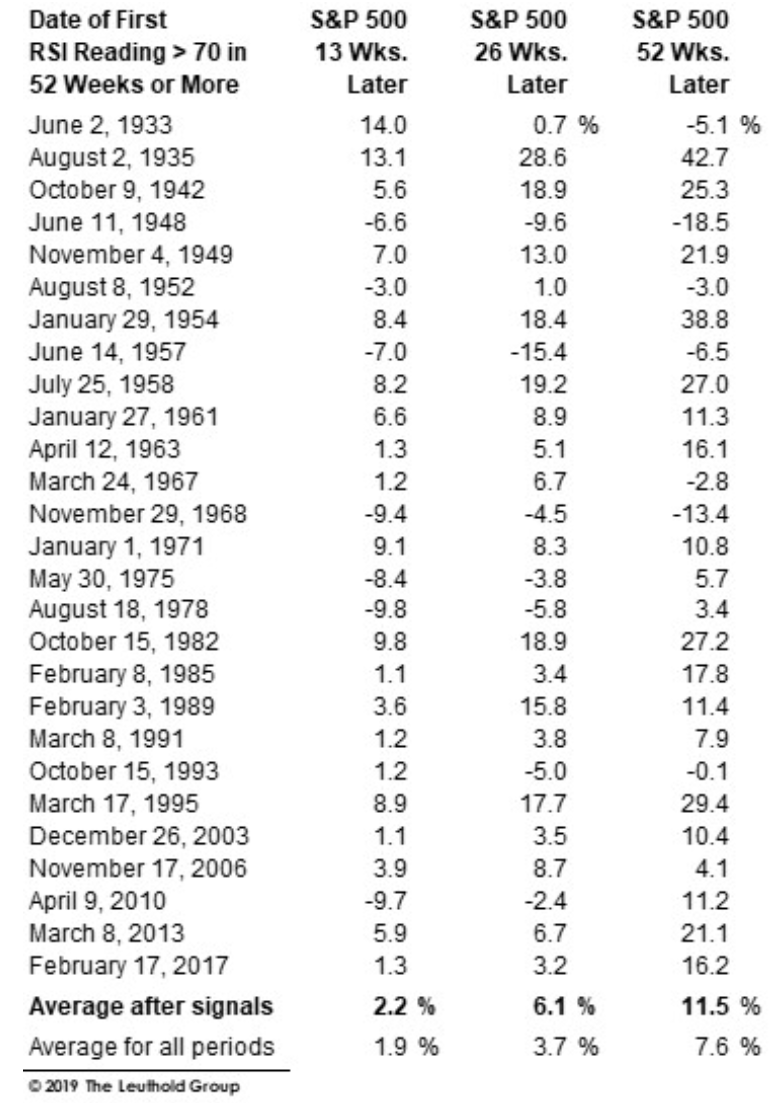
The S&P 500 has averaged a 6.1% gain over the 26 weeks following such readings, and an 11.5% rise over the next 52 weeks. These are decently above the averages for all periods of similar lengths. Importantly, there were gains in 20 of the prior 27 cases for both 6 months and 1 year, or 74% of the time. So, much like the annual calendar year results, based on this data, the odds are about 75% that stocks will be higher in June and December of next year than they are now. Strong momentum begets higher prices, much like a rocket being propelled by its boosters. There are few guarantees in the stock market, but these are pretty decent odds.
High Yield Bonds Break Out
Another encouraging sign for stocks is the behavior of the corporate high yield bond market. As noted above, the average gain for junk bond funds year-to-date is over 13%. That is composed of about 5-6% in yield, and another 7-8% in capital appreciation. It’s been said that the most bullish thing prices can do is go up, and that’s certainly happening, with a strong breakout recently. Below is a chart of the Blackrock High Yield Fund, one of about 10 funds we own in this category in client accounts. This chart is also courtesy of www.stockcharts.com.
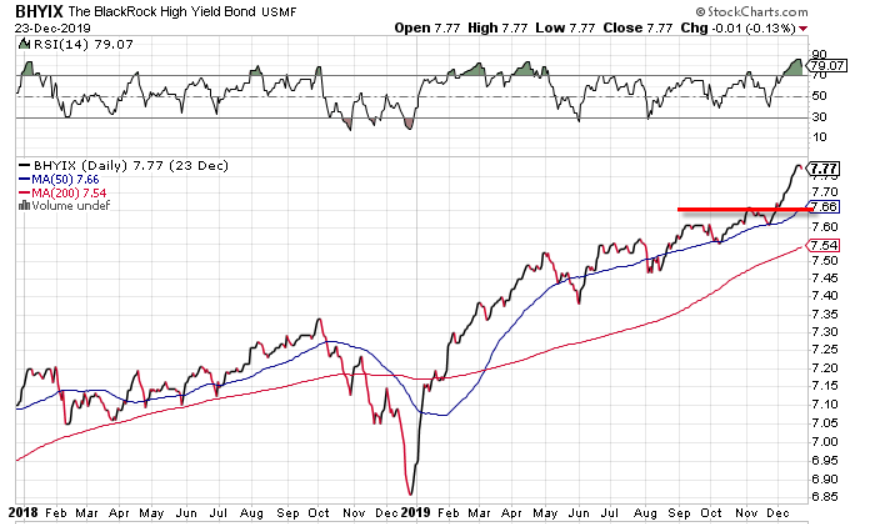
High yield bonds normally, but not always, top out before stocks do, so it’s an encouraging sign that they are making new highs along with stocks. With yields now down in the 5% range, upside from current levels is likely limited. I certainly don’t expect 13% gains in 2020. Apparently, though, compared to the 1.93% yield on the 10-year Treasury Note, investors are still finding high yield bonds attractive. Our high yield bond risk model has been on a BUY signal since January 14, and shows no signs of weakening.
The Not So SECURE Act
When there is more time to write, we’ll try to dive into this legislation a bit more. One of the biggest changes which now is law is the Required Minimum Distribution (RMD) age is being increased from 70 1/2 to age 72. This helps mostly people with lots of money, who don’t need to take payouts from their IRA accounts.
Second, now employers can offer annuities in 401 (k) plans. Given the reputation of insurance companies and the excessive fees that many annuity contracts charge, we think this is a terrible idea, not to mention the complexity of many of the products offered that most investors don’t understand.
Finally, the “stretch” IRA has been eliminated, and this is the most damaging part of the legislation. Other than spouses and a couple of exceptions, no longer can a non-spouse beneficiary who inherits an IRA “stretch out” distributions over their remaining life when liquidating the account. Instead, the new law requires that all distributions take place within 10 years of the newly inherited account, thereby diminishing the value of the inheritance.
I don’t know how the financial press is going to portray the legislation, but I believe it to be a net negative. But, we have to live with it, and make adjustments where possible.
Material Of A Less Serious Nature
A guy walks into a saloon with a dog under his arm and sets the pup on the bar. He announces to the patrons, “This here dog can talk and I’m willing to bet anyone a hundred dollars who says he can’t.”
The bartender ambles over, inspects the dog and accepts the bet.
The owner looks his dog in the eyes and asks, “What’s on top of this building?”
The dog answers, “ROOF.”
The bartender says, “Are you kidding me? What a crock, I’m not paying!”
The owner says, “OK, how about double or nothing and I ask him a different question?” The bartender rolls his eyes and nods. “OK, boy, who was the greatest Yankee to ever live?”
The dog answers with a muffled, “RUTH.”
With that, the bartender picks them both up and throws them out on the street. As the pair get up off the curb and dust themselves off, the dog turns to his owner and says, “DiMaggio?”
Here’s wishing you a Merry Christmas, Happy Hanukkah and a terrific New Year. Thank you for the trust and confidence you place in all of us at TABR. It is greatly appreciated.
Sincerely,

Bob Kargenian, CMT
President
TABR Capital Management, LLC (“TABR”) is an SEC registered investment advisor with its principal place of business in the state of California. TABR and its representatives are in compliance with the current notice filing and registration requirements imposed upon registered investment advisors by those states in which TABR maintains clients. TABR may only transact business in those states in which it is notice filed, or qualifies for an exemption or exclusion from notice filing requirements.
This newsletter is limited to the dissemination of general information pertaining to our investment advisory/management services. Any subsequent, direct communication by TABR with a prospective client shall be conducted by a representative that is either registered or qualifies for an exemption or exclusion from registration in the state where the prospective client resides. For information pertaining to the registration status of TABR, please contact TABR or refer to the Investment Advisor Disclosure web site (www.adviserinfo.sec.gov).
The TABR Model Portfolios are allocated in a range of investments according to TABR’s proprietary investment strategies. TABR’s proprietary investment strategies are allocated amongst individual stocks, bonds, mutual funds, ETFs and other instruments with a view towards income and/or capital appreciation depending on the specific allocation employed by each Model Portfolio. TABR tracks the performance of each Model Portfolio in an actual account that is charged TABR’s investment management fees in the exact manner as would an actual client account. Therefore the performance shown is net of TABR’s investment management fees, and also reflect the deduction of transaction and custodial charges, if any.
Comparison of the TABR Model Portfolios to the Vanguard Total Stock Index Fund, the Vanguard Total International Stock Fund and the Vanguard Total Bond Index Fund is for illustrative purposes only and the volatility of the indices used for comparison may be materially different from the volatility of the TABR Model Portfolios due to varying degrees of diversification and/or other factors.
Past performance of the TABR Model Portfolios may not be indicative of future results and the performance of a specific individual client account may vary substantially from the composite results above in part because client accounts may be allocated among several portfolios. Different types of investments involve varying degrees of risk, and there can be no assurance that any specific investment will be profitable.
The TABR Dividend Strategy presented herein represents back-tested performance results. TABR did not offer the Dividend Strategy as an investment strategy for actual client accounts until September/October 2014. Back-tested performance results are provided solely for informational purposes and are not to be considered investment advice. These figures are hypothetical, prepared with the benefit of hindsight, and have inherent limitations as to their use and relevance. For example, they ignore certain factors such as trade timing, security liquidity, and the fact that economic and market conditions in the future may differ significantly from those in the past. Back-tested performance results reflect prices that are fully adjusted for dividends and other such distributions. The strategy may involve above average portfolio turnover which could negatively impact upon the net after-tax gain experienced by an individual client. Past performance is no indication or guarantee of future results and there can be no assurance the strategy will achieve results similar to those depicted herein.
Inverse ETFs
An investment in an Inverse ETF involves risk, including loss of investment. Inverse ETFs or “short funds” track an index or benchmark and seek to deliver returns that are the opposite of the returns of the index or benchmark. If an index goes up, then the inverse ETF goes down, and vice versa. Inverse ETFs are a means to profit from and hedge exposure to a downward moving market.
Inverse ETF shareholders are subject to the risks stemming from an upward market, as inverse ETFs are designed to benefit from a downward market. Most inverse ETFs reset daily and are designed to achieve their stated objectives on a daily basis. The performance over longer periods of time, including weeks or months, can differ significantly from the underlying benchmark or index. Therefore, inverse ETFs may pose a risk of loss for buy-and-hold investors with intermediate or long-term horizons and significant losses are possible even if the long-term performance of an index or benchmark shows a loss or gain. Inverse ETFs may be less tax-efficient than traditional ETFs because daily resets can cause the inverse ETF to realize significant short-term capital gains that may not be offset by a loss.
For additional information about TABR, including fees and services, send for our disclosure statement as set forth on Form ADV from us using the contact information herein. Please read the disclosure statement carefully before you invest or send money.
A list of all recommendations made by TABR within the immediately preceding one year is available upon request at no charge. The sample client experiences described herein are included for illustrative purposes and there can be no assurance that TABR will be able to achieve similar results in comparable situations. No portion of this writing is to be interpreted as a testimonial or endorsement of TABR’s investment advisory services and it is not known whether the clients referenced approve of TABR or its services.