All The Bad Stuff Happens Below The 200-Day Moving Average
Since mid-January, there’s been a significant shift in the tone of stock markets worldwide, with foreign equities surging, and U.S. stocks mostly getting pummeled. Our tactical stock exposure has gone from 86% to 40% in just 7 weeks, yet fixed income is doing quite well (thus far).
We’ll have more technical details on this, including the significance of the 200-day moving average, along with context on sentiment, both short and intermediate term, high yield bonds and spreads, and talking with your kids about your money which can tie into the demands of being an executor of an estate.
There’s already been more volatility (in English, that means down!) in less than 3 months than the entirety of 2024, and there’s probably much more ahead. Read on.
A Change In Tone
I knew 2024 couldn’t last forever. Perfect for trend following and relative strength. Hardly any down volatility. Well, the market has announced rather quickly, things are going to be quite different this year, and beyond. Most broad stock indexes are lower in the last 12 weeks, but not all. There’s been a tremendous surge in foreign stocks, with almost all U.S. stocks going the opposite direction, with the exception of more value-oriented dividend stocks. Look at the relative strength matrix below, which we maintain with the help of our friends at Ned Davis Research (www.ndr.com).
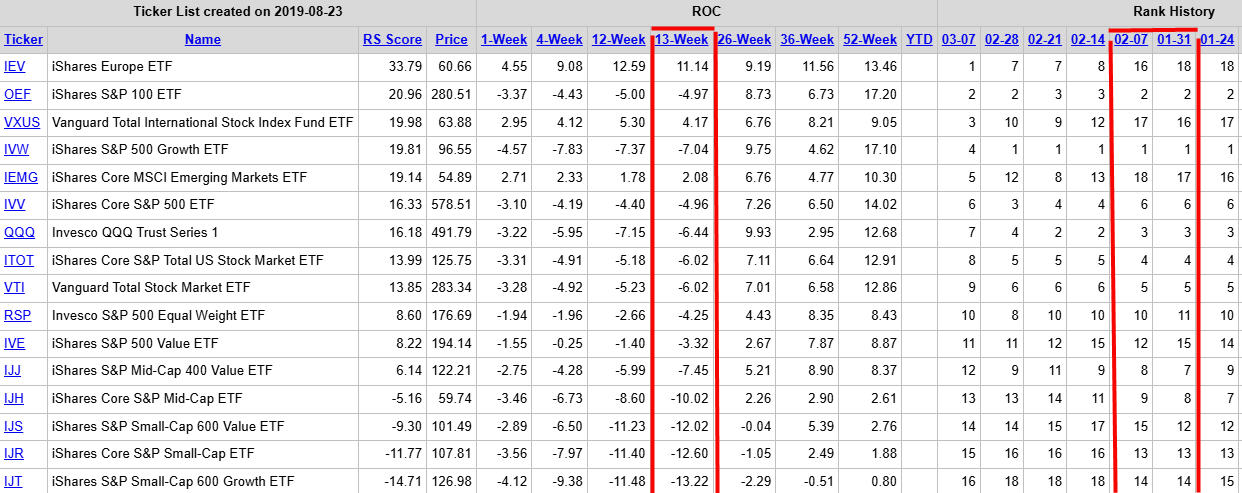
In just five weeks, the iShares Europe ETF has gone from the worst ranked fund, # 18, to the top ranked fund. In that period, it has outperformed the S&P 500 Index by over 1600 basis points (16%) and the QQQ, also known as the Nasdaq 100 and home of all of the Magnificent 7 stocks (Apple, Tesla, Nvidia, Google, Microsoft, Amazon and Tesla) by over 1700 basis points.
Just as importantly, only international stock indexes have gained ground in the last 13 weeks, as shown in the table above. But, there is one area of U.S. stocks that have held up, and that is the dividend-oriented area, such as NOBL (up 4.99% ytd), VYM(up 2.85%) and SCHD (up 4.17%) for example.
Basically, what had been doing the worst in 2024 is now doing the best, and vice versa. Since we look at our rankings monthly, the above has not been reflected in any changes to our mix yet, because as recently as February 28, all three of our core holdings (QQQ, IVW and OEF) had continued to be top-ranked. This is an example of the dynamic process we use. Nothing can call a top or bottom in relative strength, but once funds fall out of the top, they eventually get replaced with what has taken over leadership. In other words, you don’t stay wrong for long.
Below, we’ll take a look at short and intermediate term sentiment, uptrends, and the importance of the 200-day moving average.
Sentiment
As a result of the recent decline, short-term traders have turned excessively pessimistic. In a bull market, that’s bullish and typically marks bottoms. Look at the chart below, courtesy of Ned Davis Research once again. This is their daily sentiment composite, with data going back to 1994.
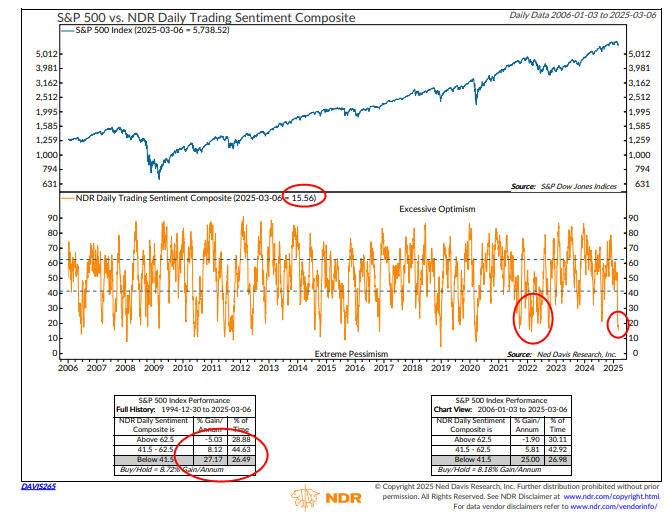
Last week’s reading was 15.56, the lowest since late 2022, which marked the bottom of that cyclical bear market. NDR noted last week that in all of the cases since 1994 with readings below 20, the S&P 500 has been higher 80% of the time looking out 3 months, with average gains of 4%. So, a bottom could be taking place right now.
However, if we are transitioning from a bull market to a bear market, the current low will only be temporary, as the cluster of signals I circled in late 2021 and 2022 ended up lasting nearly a year and led to the bear market of that time period.
Intermediate sentiment is not nearly as positive, as shown below in the other sentiment chart from NDR, which is taken weekly rather than daily.
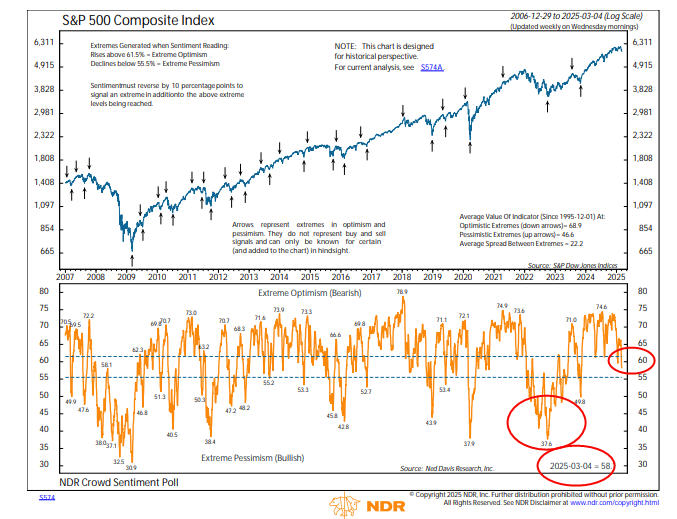
At the current reading of 58, this indicator has a long way to go to match the bottom in 2022 which was below 38. Whatever bottom the market may or may not be making in the current time period, I believe it will be temporary because of this chart.
Uptrends Mostly Broken Or At Critical Junctures
Stocks last bottomed in October 2022, so trendlines going back to that time period are now over 2 years intact, but they are being threatened with the current decline in the NDX 100 and the S&P 500, while already having been broken in mid cap and small cap indexes. An illustration is below of the NDX 100, courtesy of www.elliottwave.com.
Maybe we bounce off of the uptrend line, maybe we don’t. It will be broken eventually, and it’s only a matter of time.
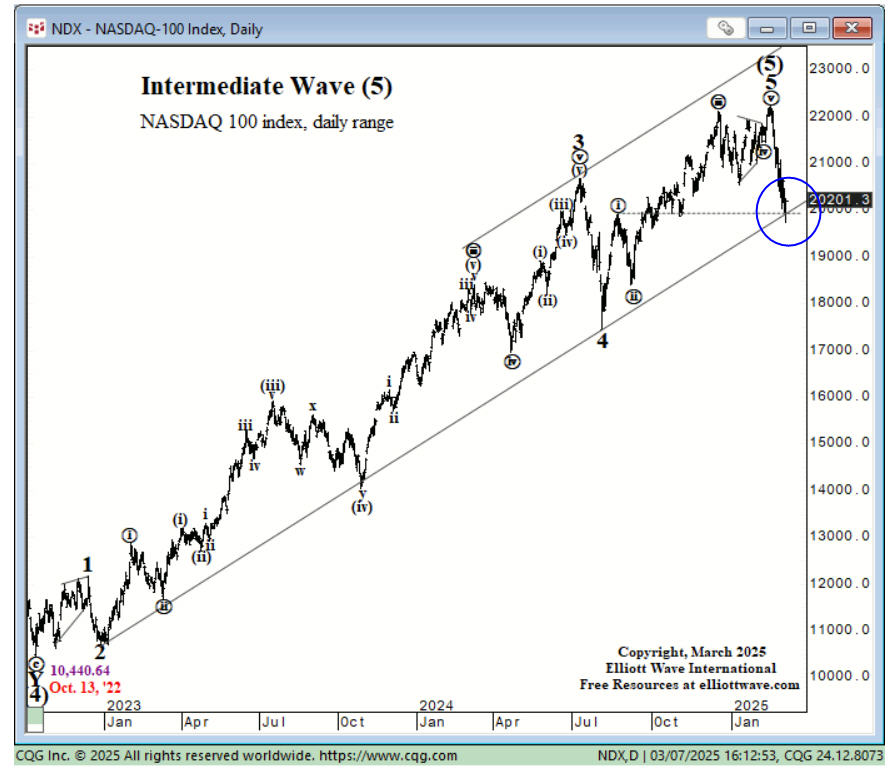
The majority of this update was written on the weekend, before today’s decline. My “only a matter of time” quip above didn’t need much, as today (March 10), the NDX is down nearly -4%, clearly breaking the uptrend line. At present, the index is trading around the 19,400 level, and the next chart support is around the 18,000 level, which is another -7% lower.
The Importance Of The 200-Day Moving Average
Though not a perfect indicator, the 200-day moving average for stock indexes has been widely considered the barometer to gauge if the market is in a bull mode or bear mode. Timing systems have been built around simple crossings of the moving average, which pretty much guarantee one to be on the right side of the trend (eventually).
Below is the chart of the S&P 500 going back about four years. Other than for a couple of weeks in November of 2023, the index has been above its 200-day moving average since around March of 2023, and this has coincided with a strong uptrend, until the last several weeks. As of last Friday, the S&P 500 traded below its 200-day MA intra-day, but managed to close above it. Though not shown, the NASDAQ Composite has already closed below its 200-day MA, as have stock indexes for midcaps and small caps.
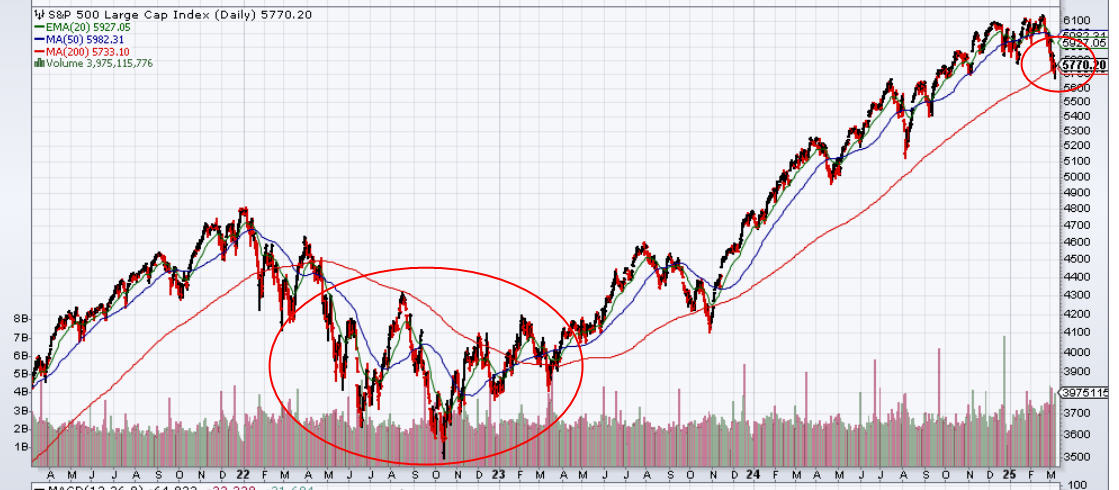
As one can see on the chart where I’ve circled the time period from around March of 2022 to March of 2023, markets were in a downtrend until the bottom in October 2022, and then began to rise. As the title of this month’s update implies, all the bad stuff happens below the 200-day MA. By definition, all the good stuff happens above the 200-day MA.
Simply put, markets are transitioning from above to below, and as a result, risk is rising significantly. Coupled with the potential break in long-term trendlines, the character of the market is in flux. It’s possible the market could fluctuate above and below the MA for many months, and frustrate investors and trend-followers. You never know. There’s also no way to know how low or high a market may move after crossing its 200-day MA. That’s why one simply has to trust the process.
I should add that this indicator by itself is not part of any of our stock market risk models (there are much better alternatives), but it’s widely followed and quite easy to understand. The current message is that most stock indexes are at a critical juncture.
High Yield Bonds And Credit Spreads
One of the most effective external indicators for the stock market we’ve found is the performance of high yield bonds. This sector of the fixed income market has tended to lead significant stock market declines and confirm the existence of new uptrends in stocks.
As a result, I’m a little reticent to get too bearish at this moment, because thus far, our high yield bond risk model has managed to remain on its November 2023 BUY signal. Below is a chart of the Blackrock High Yield Fund (BHYIX), one of several funds we own in client accounts. The chart is courtesy of www.stockcharts.com.
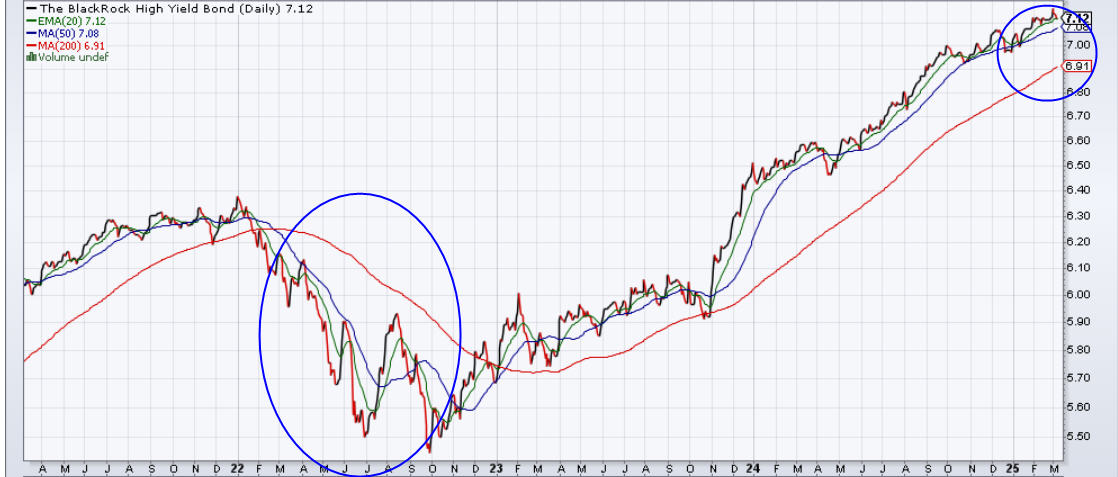
One can see the fund has been trading above its 200-day MA since early 2023, with just a blip below it in October of that year. Normally, high yield bonds break down before stocks do, but that has not been the case thus far. Credit spreads, which are typically referred to as the difference between the yields of government bonds and high yield bonds (bonds with different credit ratings) are currently around their lowest levels in about 17 years.
This suggests one is not getting paid much to take on the extra credit risk of owning high yield bonds versus government bonds. Our model, though, was at an all-time high just one week ago and is not really close to a SELL at this writing. That could change with one really bad week. The current example is also why we limit the amount of external indicators in our modeling process to make allocations for the stock market.
Based on the last six months of distributions of BHYIX, the current yield of the fund is 6.50%, and the fund has a relatively low duration of just over 3 years. Maybe investors are finding this attractive given the massive uncertainty coming out of Washington, and the asset class is acting differently than in the past. We’re watching this area closely for clues.
Should You Talk With Your Kids About Your Money? We Think So, And So Does Warren Buffett
For many people, talking about their money can be a highly personal thing. And it is. With many of the situations and circumstances Steve and I have encountered over the years in working with clients, I can tell you that certain aspects of the job of being entrusted with people’s “treasure” involve the skills of being a psychotherapist. Not all parents and children are in harmony and have unity. As a result, it comes as no surprise that according to a survey of 2,200 individuals last year conducted by financial advisory firm Edward Jones, consultant Next360 Partners and research firm Morning Consult, 35% said they have no plans to discuss the transfer of wealth from one generation of their family to another. Only 25% have had such a discussion.
That’s too bad. Providing clarity and transparency to your children is one of the best gifts you can give them, along with being organized and making their life easier after you’re gone (and even while you’re here). As I get older (now 67), we’re encountering more situations where our clients are needing to help take over financial and healthcare affairs for their parents, and are often named as successor trustees to handle the estates of their parents. Trust me, the job of being an Estate Executor is not easy, even when things ARE organized. I’ve written about that in the past, documenting the tribulations I went through in helping to handle my aunt’s financial affairs just a few years ago.
I was reminded of that when going through my reading pile. I came across an excellent piece from Ashlea Ebeling of the Wall Street Journal, titled “Grief, Then Paperwork: The Messy, Thankless Job of an Estate Executor.” I’d highly encourage you to read it. A link to the article is below.
Obviously, there are only a handful of people in the world who have the riches of Warren Buffett, but the principles of what he outlined in recent comments to shareholders of Berkshire Hathaway apply to everyone. Among other things communicated in his comments, one was “Be sure each child understands both the logic for your decisions and the responsibilities they will encounter upon your death.” As you can imagine, this process might be quite easy for parents who have children, and all of them are being treated equally. We can tell you, though, that not all situations are that “easy.” Some have estranged relationships with one or more of their children. Or, some of their children are better off than others, and some parents feel compelled to leave “more” to the child who is less well off. There are numerous possibilities. In our view, though, the best thing parents can do is to be transparent. And organized! You will help your spouse and children so much if you make it easier on them to take care of things after you’re gone.
Below is a link to the article with Buffett’s comments, from Anne Tergesen also of the Wall Street Journal. It’s entitled “Warren Buffett Talks to His Kids About His Will. You Should Too.
https://www.wsj.com/personal-finance/warren-buffett-will-63bec46f
TABR Portfolio Allocations Update
As mentioned in the beginning paragraphs of this update, our tactical equity allocations are down to 40%, as of March 5, meaning they are 60% in cash. Three of our five stock market risk models are negative. Depending on the rest of this week and the closing levels this Friday, another model is poised to turn negative, which would take us to 20% invested tactically and 80% in cash. Even when all five are negative, our floor for equity exposure is 20%, which is made up of 3 Fidelity sector funds and a style box ETF. Meanwhile, our high yield bond risk model is still on its November 2023 BUY signal. We would expect further deterioration this week if stocks continue their decline, but it’s nice that the bond market is acting as a buffer during this turbulence.
Material Of A Less Serious Nature
A professor of taxation delivered a highly detailed, brilliant lecture drawing the distinction between tax avoidance and tax evasion. He then asked his brightest student, “Tell us succinctly what the difference is between tax avoidance and tax evasion.” The student replied: “Jail.”
Mike’s barn burned down, and his wife Kathy called the insurance company. Kathy spoke to the insurance agent and said, “We had that barn insured for $50,000 and I want my money!” The agent replied, “Whoa, there just a minute. Insurance doesn’t quite work like that. An independent adjuster will assess the value of what’s insured, and then we will provide you with a new barn of similar value.”
After a long pause, Kathy replied, “If that’s how it works, then I want to cancel the life insurance policy on my husband.”
As March turns into April, that means one thing. Baseball season is here. College play is in full swing, with most Division 1 schools beginning conference play this past weekend. The big boys start in late March, so at this juncture, even Angels fans like myself are optimistic, since the team is 0-0. But my real focus is on hockey, and my Dallas Stars quest to hoist the Stanley Cup. We need some injury luck and some good puck bounces, starting with the playoffs in late April.
Meanwhile, thank you for your continued trust and confidence in all of us at TABR. We’re in a very different environment than the past 24 months, one where our tactical work is more important than ever.
Sincerely,

Bob Kargenian, CMT
President
TABR Capital Management, LLC (“TABR”) is an SEC registered investment advisor with its principal place of business in the state of California. TABR and its representatives are in compliance with the current notice filing and registration requirements imposed upon registered investment advisors by those states in which TABR maintains clients. TABR may only transact business in those states in which it is notice filed, or qualifies for an exemption or exclusion from notice filing requirements.
This newsletter is limited to the dissemination of general information pertaining to our investment advisory/management services. Any subsequent, direct communication by TABR with a prospective client shall be conducted by a representative that is either registered or qualifies for an exemption or exclusion from registration in the state where the prospective client resides. For information pertaining to the registration status of TABR, please contact TABR or refer to the Investment Advisor Disclosure web site (www.adviserinfo.sec.gov).
The TABR Model Portfolios are allocated in a range of investments according to TABR’s proprietary investment strategies. TABR’s proprietary investment strategies are allocated amongst individual stocks, bonds, mutual funds, ETFs and other instruments with a view towards income and/or capital appreciation depending on the specific allocation employed by each Model Portfolio. TABR tracks the performance of each Model Portfolio in an actual account that is charged TABR’s investment management fees in the exact manner as would an actual client account. Therefore the performance shown is net of TABR’s investment management fees, and also reflect the deduction of transaction and custodial charges, if any.
Comparison of the TABR Model Portfolios to the Vanguard Total Stock Index Fund, the Vanguard Total International Stock Fund, the Vanguard Total Bond Index Fund and the S&P 500 Index is for illustrative purposes only and the volatility of the indices used for comparison may be materially different from the volatility of the TABR Model Portfolios due to varying degrees of diversification and/or other factors.
Past performance of the TABR Model Portfolios may not be indicative of future results and the performance of a specific individual client account may vary substantially from the composite results above in part because client accounts may be allocated among several portfolios. Different types of investments involve varying degrees of risk, and there can be no assurance that any specific investment will be profitable
For additional information about TABR, including fees and services, send for our disclosure statement as set forth on Form ADV from us using the contact information herein. Please read the disclosure statement carefully before you invest or send money.
A list of all recommendations made by TABR within the immediately preceding one year is available upon request at no charge. The sample client experiences described herein are included for illustrative purposes and there can be no assurance that TABR will be able to achieve similar results in comparable situations. No portion of this writing is to be interpreted as a testimonial or endorsement of TABR’s investment advisory services and it is not known whether the clients referenced approve of TABR or its services.