Can You Sleep When The Wind Blows?
Years ago a farmer, whose fields stretched along the eastern seaboard, was looking for hired hands. It wasn’t easy to find help. People were reluctant to work on the Atlantic coast. They dreaded the regular raging storms that wreaked havoc on buildings and crops.
Interviewing applicants for the job, the farmer received a steady stream of refusals. Finally, a short, thin man, well past middle age, approached him. “Are you a good farmhand?” the farmer asked. “Well, I can sleep when the wind blows,” answered the little man. Although puzzled by this answer, the desperate farmer hired him.
The little man worked well around the farm, keeping himself busy from dawn to dusk, and the farmer was satisfied with his new hire. Then, late one night, the Atlantic wind began howling in from offshore. Jumping out of bed, the farmer grabbed a lantern and rushed next door to the hired hand’s sleeping quarters. He shook the little man, yelling, “Get up! A storm is coming! Tie things down before they blow away!” The little man rolled over in bed and said firmly, “No sir. I told you. I can sleep when the wind blows.”
Enraged, the farmer was tempted to fire the old man on the spot. Instead, he hurried outside to prepare for the storm. To his amazement, he discovered that all of the haystacks had been covered with tarpaulins. The cows were in the barn, the chickens in their coops, the doors barred, the shutters tightly secured. Everything was tied down; nothing would blow away. The farmer returned to his bed, and the sound of the storm wind lulled him to sleep.
Given the tremendous rebound in stock prices since last March, where major indexes have gained anywhere from 70% to 100% from the March 23 low, and the seemingly “easy money” experience that the Federal Reserve Board has created, I thought this would be a good time to share this story I came across, which aptly illustrates the importance of having a plan in advance to deal with the turbulence that markets inevitably experience from time to time.
It may be easy to say, “hey, the stock market is essentially at all-time highs, and it always comes back, so why do anything?” That is certainly the message from the buy and hold philosophy, and it certainly has been reinforced with the past 12 years since the major bottom which occurred in March 2009. From that bottom on March 9, 2009 to March 4, 2021, the S&P 500 Index as represented by the Vanguard 500 Index Fund has compounded at 17.6% annually. That rivals the gains that took place from 1980 to 1999, that were also in the mid-teens, compounded. I’d say most of us can sleep pretty well with those kinds of numbers (returns).
But, permit me to throw a bit of cold water into that hot shower. For the 10 years ended December 31, 2009, the same Vanguard 500 Index Fund lost -1% annually (with reinvested dividends). Furthermore, if you dice that analysis to the exact low of the decline on March 9, 2009, the numbers were much worse. How about -6.5% compounded annually for 9 years and a bit over two months? That sounds like a recipe of insomnia for investors. Point being, though stocks do go up over the long run, and on average show positive returns about 3 of every 4 years, the relevance of market cycles should not be lost on investors, let alone forgotten. Sometimes the long run, is well. . .long. And though investors in their 30s, 40s and 50s have plenty of time to accumulate funds and ride out downside volatility should they have the stomach, that’s not necessarily the case for investors near, or in, retirement.
So, what if the wonderful cycle of the last 12 years is ending, to be followed by below-average returns and increasing downside volatility? How does one sleep well when the wind blows?
A Reminder About The TABR Tactical Approach
Since the major bottom in 2009, there have been only two stock market declines of -20% or more—one during the fourth quarter of 2018 and the other encompassing February and March of last year. Below, we’ve chronicled that data using the S&P 500 (large stocks), the S&P 600 (small stocks) and the NDX 100 Index, which is comprised of the largest non-financial companies in the NASDAQ Composite.
| Maximum Drawdown (Returns From Peak To Trough) | Aug/Sept 2018 to December 24, 2018 | February 19 to March 23, 2020 |
| S&P 500 Index | -19.77% | -33.9% |
| S&P 600 Index | -27.87% | -42.5% |
| Nasdaq 100 Index | -22.98% | -27.9% |
| TABR Tactical Moderate Account | -6.10% | -13.29% |
| TABR Tactical Conservative Account | -4.53% | -11.02% |
| TABR Tactical Equity Account | -10.66% | -15.84% |
| TABR Passive Index Account | -12.34% | -24.58% |
For proper context, the only one of the four TABR strategies listed above which can be 100% invested in stocks is the Tactical Equity account. The Passive Index account is 40% in bonds, the Conservative account has been 60-65% in bonds and the Moderate account, 45-50% in bonds. Note the significant reduction in drawdown in the Tactical accounts. The most apt to apt comparisons are the stock indexes to the Tactical Equity account, and also comparing the Passive Index account to the Moderate account.
| Returns 3 months after the bottom | December 24, 2018 to March 24, 2018 | March 23, 2020 to June 23, 2020 |
| S&P 500 Index | 19.12% | 39.90% |
| S&P 600 Index | 15.64% | 38.40% |
| Nasdaq 100 Index | 24.18% | 45.71% |
| TABR Tactical Moderate Account | 4.11% | 6.40% |
| TABR Tactical Conservative Account | 3.77% | 5.35% |
| TABR Tactical Equity Account | 4.41% | 8.60% |
| TABR Passive Index Account | 12.73% | 24.93% |
A few highlights. The Moderate account lost just over -6% during the near -20% decline in 2018, and just over -13% during the -34% decline in 2020. That’s really good risk management. Likewise, the Tactical Equity account drawdowns were about 50% lower than being fully invested in the various stock indexes. This is what allows one to sleep when the wind is blowing. Playing defense when the environment changes. For balance, though, it’s important to note the weakness. Every strategy has a strength, and a weakness. In the last two significant declines, stocks have experienced what is called a “V” bottom, where stocks start going back up without any testing of the lows. It’s like “the train has left the station. Bye, bye.” Avoiding significant declines means you’re not likely going to be heavily invested near the bottom, until trends have confirmed that there is a more positive risk environment. That’s usually the tradeoff for playing defense. Historically, “V” bottoms have not happened often, but the reality is they have taken place after the last two declines, perhaps spurred by a growing confidence the Fed will backstop the market. Time will tell if this continues.
Ultimately, we believe clients should be exposed to only enough market fluctuations necessary to meet their goals. “Beating” the market is not our end goal in most cases, but rather helping clients meet their goals so they’ll have enough to lead the life they want. We do have and use strategies that have shown in the past a consistent ability to outperform the indexes, but they come with much stronger winds, and lots less sleep, if you know what I mean. We can’t tell you in advance when the next storm is coming, but we’re confident the tools we use will help you sleep when it’s here.
What You Own Is Just As Important As How Much You Own
There have been some significant changes in market leadership since early November, and it got me to thinking about the argument for diversification. There are a lot of nuances to this argument. Some we agree with, such as having some balance between stocks and fixed income, but with other areas, we think there’s a better way.
The conventional wisdom is to own a bit of everything, rebalance regularly, and leave it alone. That, in essence, is what we do within TABR’s Passive Index strategy. The four broad equity categories are domestic large stocks, mid-caps, small and international, plus a carve out for real estate, which I have my doubts about since I really believe it is a sector, much like energy is. In bonds, there is a broad bond market index fund, inflation-protected bonds, and high yield. Below, I’ve broken down the performance of these categories for the last two 10-year periods, ending in 2019.
| Fund (Category) | December 1999 to December 2009 | December 2009 to December 2019 |
| Vanguard 500 Fund (large stocks) | -1.0% | 13.4% |
| S&P 400 Midcap Index | 6.1% | 12.4% |
| Vanguard Small Cap Fund | 5.1%* | 12.8% |
| Vanguard Total International Stock | 2.3% | 5.0% |
| Cohen & Steers Realty Fund | 9.9% | 13.0% |
| Vanguard Total Bond Index Fund | 6.1% | 3.6% |
| Vanguard Inflation Protected Bond | 6.8* | 3.1% |
| Vanguard High Yield Fund | 5.1% | 7.1% |
*this represents the time period of 7-17-2000 to December 2009 for Inflation Protected Fund, and from 11-14-2000 to December 2009 for the Small Cap Fund, their respective inception dates.
Several things stand out, most notably when comparing equity performance. Small and Mid-cap stocks were the place to be in the so-called lost decade for large companies, ending in 2009. In the more recent 10 years, though, there’s been little difference between large, small and mid-cap, but one constant. International stocks have lagged badly. The standard defense is “Well, you couldn’t have known that, so you need to own some.” I agree that you couldn’t have known that in advance, but you don’t need to own any if you use relative strength work.
It will tell you what to own, and when to own it. And no matter how compelling the fundamentals may be from a number of Wall Street research firms who claim that international stocks and emerging market equities are forecasted to beat U.S. domestic returns handily in the next 10 years, right now, that is not showing up in the data. But, something else is. That is, the demise of large cap growth, which has led the market for most of the past 10 years. In the last three months, our rankings have changed dramatically, to the point of in November, our tactical equity allocations were all in large growth indexes—QQQ, OEF and IVW. Starting in December and culminating this past week, we are now exclusively in small caps—IJR, IWC and IJS.
Recent results have been stunning. On December 1, we sold OEF and bot IWC. Since then, OEF has gained 3.65%, while IWC is up 28.71%. On January 4, we sold IVW and bot IJR. Since then, IVW is unchanged, and IJR is up 17.97%. And just in the past week, we sold QQQ on March 1 and bot IJS. Since then, the former is down -4.38% and the latter is up 1.46%. Please know the results will not always be this dramatic and there will be periods when things lag. But, the process is dynamic and shows that you don’t need to diversify to add value, and you don’t need to know in advance what will be best (nobody can know that). You just need to have the discipline to follow the work.
Someday, I will not be surprised if all our equity exposure is in international stocks. Who knows? The premise of relative strength is that markets and cycles change, and one needs to have a process to change with it. As you’ll see below, large cap growth stocks are fading. They have been leading the market for some 11 years. That run may be over. We don’t know. We only know that the market is no longer treating that area as one where you want to be invested. It could be for 3 months, or it could be for 5 years. For those investors who think that the leaders of the pack will grow to infinity and beyond, I’d remind them of one thing—Toy Story was a fictional story.
Should You Be Worried About This Chart?
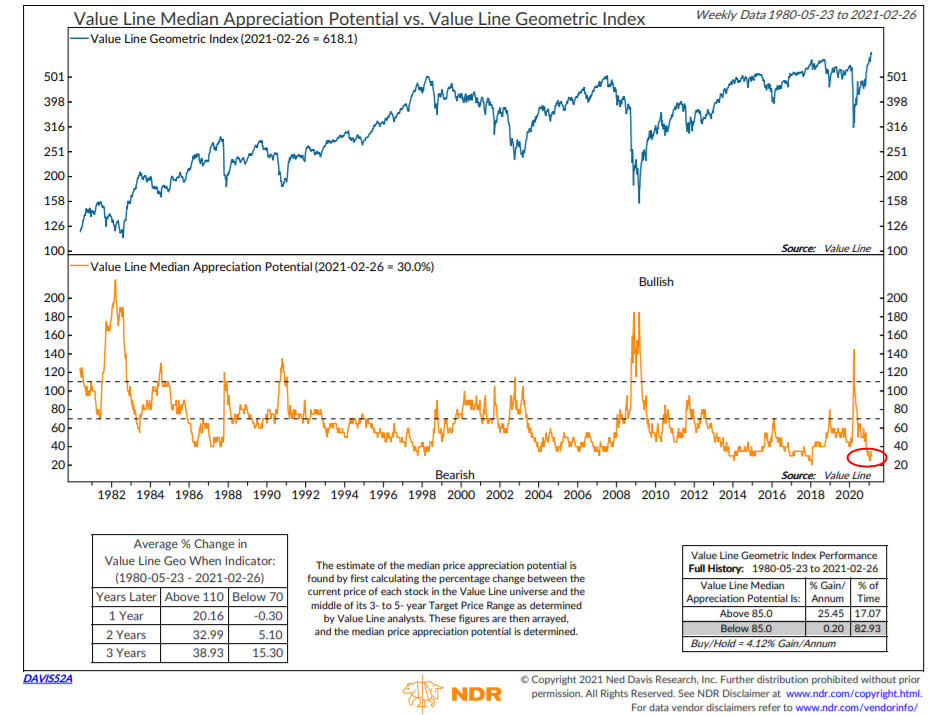
I’m not going to keep you in suspense. The answer to the above question is YES, you should be. We have featured this indicator in the past, including last March. It’s called the VLMAP, or Value Line Median Appreciation Potential, and is from the Value Line publishing research firm, which we’ve subscribed to for many years. We even purchased the weekly data on this indicator going back to its inception in the mid-1960s.
It’s a valuation indicator derived from Value Line’s target price range of the 1700 or so stocks in their universe, looking out 3 to 5 years. In the chart above, Ned Davis Research has put brackets on the past data to 1980, which shows that stocks as measured by the Value Line Geometric Index have gained virtually nothing when the indicator is below 85%, but have compounded at over 25% annually when it is over 85%. Recently, the indicator nearly matched its all-time low with a reading of 25%. The last time it was at that level was in early 2018, and stocks went nowhere for 9 months, and then plunged about -20% into the fourth quarter of 2018.
There was a tremendous buy signal last March when the indicator surged to 145%, one of the highest and most bullish readings of the last 40 years. We used that move to increase allocations to equities by 5%, for instance, moving Moderate accounts from 50% maximum to 55%. In hindsight, we were too conservative. Stocks have roared back, but are now as overpriced as ever by many historical measures. As you can see on the chart from the late 1990s and the period from around 2003 to 2007, this is not a great timing indicator for taking risk off the table. I look at it for context. It’s hard to know how much price damage will be done to get this indicator above 85%, but my educated guess is at least -20%. If history is any guide, the risk/reward from current levels is not so hot.
The Big Cats Are Beginning To Get Skinned
As mentioned above, markets move in cycles, and so does leadership, which often can last a long time. Much has been written in the past year about the concentration in the S&P 500 Index, where currently the top 10 companies account for about 25% of the index. Ironically, this is fairly common in history. If the leading stocks do well, the index does well, and vice versa.
A week ago, our friends at Dorsey Wright did a deep dive into the top 10 stocks, which is shown below. The index is actually up 2.5% for the year through March 5, but there is disparity under the surface.

The only leader in technology has been Google, which is up over 19% ytd, followed by JP Morgan and Berkshire Hathaway, up 18.76% and 9.17%, respectively. The losers are led by Tesla, Apple and Amazon, down -15.25%, -8.49% and -7.86%. These were the stocks that led the market out of the March 2020 bottom. Four of the 10 stocks have given Trend chart SELL signals, and only one has the strongest Technical Attribute rating of 5, that being JP Morgan Chase.
Should these trends continue, it will be difficult for the S&P 500 Index to make any headway on the upside. This is already showing itself in the relative strength rankings I’ve alluded to. In the OEX Relative Strength strategy we started last February, I find it of interest that at various times last year and this year, we have owned Apple, Microsoft, Amazon, Google and Tesla, but they have all been sold.
The market seems to be looking ahead, as each week more and more people are inoculated, and restrictions regarding dining at restaurants to attendance at theme parks and sporting events are being lifted, along with students going back to in-person classes. This is why I believe small cap stocks and financials and even energy have been taking over the leadership since early November. Why, could you imagine this? People all over the nation are going to have to get out of their sweatpants and drive to the office to actually work with people in person. What a novel thought. That’s not good for Amazon and the Zoom’s of the world, but I’ll tell you what. It sure will be good for America.
Current Positioning And Allocations
At present, 5 our 6 stock market risk models are in a positive mode, dictating equity allocations at 83%. Our risk model for high yield bond funds remains on its November 9 BUY signal, and though Treasury Yields have surged recently, junk bond spreads have not moved up much at all. When that happens, we expect risk in the stock market to be much greater than at present. Last Thursday, there were 154 stocks making new lows on the NYSE, the most since last April. I’m considering that a shot across the bow. Should new lows continue to be nearly as prevalent as new highs for the next several weeks, the market will be in a much more precarious position.
Material Of A Less Serious Nature
A preacher was explaining that he must move on to a larger congregation that will pay him more. There is a hush within the congregation, as no one wanted him to leave.
Joe Smith, who owns several car dealerships in the city, stood up and proclaimed, “If the preacher stays, I’ll give him a new Cadillac every year, and his wife a Honda mini-van to transport their children!”
The congregation sighed in relief, and applauded.
Sam Brown, a successful entrepreneur and investor, stood and said, “If the preacher will stay on here, I’ll personally double his salary, and also establish a foundation to guarantee the college education of all his children!”
More sighs and loud applause.
Sadie Jones, age 88, stood and announced with a smile, “If the preacher stays, I will give him sex!”
There was total silence.
The preacher, blushing, asked her, “Mrs. Jones, whatever possessed you to say that?”
Sadie’s 90-year-old husband Jake was now trying to hide, holding his forehead with the palm of his hand, and shaking his head from side to side, while his wife replied, “Well, I just asked my husband how we could help and he said, ‘Screw him!'”
About now, I’d say that’s how many Californians and New Yorkers feel about their respective Governors! But maybe there’s hope for both of them. I mean, you let people go to Disneyland and baseball games, and they just might forgive you.
Thanks for the trust and confidence you give all of us at TABR, in allowing us to serve you, and Happy Saint Patrick’s Day!
Sincerely,

Bob Kargenian, CMT
President
TABR Capital Management, LLC (“TABR”) is an SEC registered investment advisor with its principal place of business in the state of California. TABR and its representatives are in compliance with the current notice filing and registration requirements imposed upon registered investment advisors by those states in which TABR maintains clients. TABR may only transact business in those states in which it is notice filed, or qualifies for an exemption or exclusion from notice filing requirements.
This newsletter is limited to the dissemination of general information pertaining to our investment advisory/management services. Any subsequent, direct communication by TABR with a prospective client shall be conducted by a representative that is either registered or qualifies for an exemption or exclusion from registration in the state where the prospective client resides. For information pertaining to the registration status of TABR, please contact TABR or refer to the Investment Advisor Disclosure web site (www.adviserinfo.sec.gov).
The TABR Model Portfolios are allocated in a range of investments according to TABR’s proprietary investment strategies. TABR’s proprietary investment strategies are allocated amongst individual stocks, bonds, mutual funds, ETFs and other instruments with a view towards income and/or capital appreciation depending on the specific allocation employed by each Model Portfolio. TABR tracks the performance of each Model Portfolio in an actual account that is charged TABR’s investment management fees in the exact manner as would an actual client account. Therefore the performance shown is net of TABR’s investment management fees, and also reflect the deduction of transaction and custodial charges, if any.
Comparison of the TABR Model Portfolios to the Vanguard Total Stock Index Fund, the Vanguard Total International Stock Fund and the Vanguard Total Bond Index Fund is for illustrative purposes only and the volatility of the indices used for comparison may be materially different from the volatility of the TABR Model Portfolios due to varying degrees of diversification and/or other factors.
Past performance of the TABR Model Portfolios may not be indicative of future results and the performance of a specific individual client account may vary substantially from the composite results above in part because client accounts may be allocated among several portfolios. Different types of investments involve varying degrees of risk, and there can be no assurance that any specific investment will be profitable.
The TABR Dividend Strategy presented herein represents back-tested performance results. TABR did not offer the Dividend Strategy as an investment strategy for actual client accounts until September/October 2014. Back-tested performance results are provided solely for informational purposes and are not to be considered investment advice. These figures are hypothetical, prepared with the benefit of hindsight, and have inherent limitations as to their use and relevance. For example, they ignore certain factors such as trade timing, security liquidity, and the fact that economic and market conditions in the future may differ significantly from those in the past. Back-tested performance results reflect prices that are fully adjusted for dividends and other such distributions. The strategy may involve above average portfolio turnover which could negatively impact upon the net after-tax gain experienced by an individual client. Past performance is no indication or guarantee of future results and there can be no assurance the strategy will achieve results similar to those depicted herein.
Inverse ETFs
An investment in an Inverse ETF involves risk, including loss of investment. Inverse ETFs or “short funds” track an index or benchmark and seek to deliver returns that are the opposite of the returns of the index or benchmark. If an index goes up, then the inverse ETF goes down, and vice versa. Inverse ETFs are a means to profit from and hedge exposure to a downward moving market.
Inverse ETF shareholders are subject to the risks stemming from an upward market, as inverse ETFs are designed to benefit from a downward market. Most inverse ETFs reset daily and are designed to achieve their stated objectives on a daily basis. The performance over longer periods of time, including weeks or months, can differ significantly from the underlying benchmark or index. Therefore, inverse ETFs may pose a risk of loss for buy-and-hold investors with intermediate or long-term horizons and significant losses are possible even if the long-term performance of an index or benchmark shows a loss or gain. Inverse ETFs may be less tax-efficient than traditional ETFs because daily resets can cause the inverse ETF to realize significant short-term capital gains that may not be offset by a loss.
For additional information about TABR, including fees and services, send for our disclosure statement as set forth on Form ADV from us using the contact information herein. Please read the disclosure statement carefully before you invest or send money.
A list of all recommendations made by TABR within the immediately preceding one year is available upon request at no charge. The sample client experiences described herein are included for illustrative purposes and there can be no assurance that TABR will be able to achieve similar results in comparable situations. No portion of this writing is to be interpreted as a testimonial or endorsement of TABR’s investment advisory services and it is not known whether the clients referenced approve of TABR or its services.