Cutting Exposure, Another Leg Down And A Little Personal Finance
For all of 2017 and the first 26 days of 2018, the S&P 500 Index never declined more than 3% from a peak, one of, if not, the longest such streak in history. Everyone knew the CALM could not last forever, yet a large number of speculators were betting on it to the end.
Well, the END was a 10% drop in the S&P 500 Index in just 9 trading days, thus far stopping on February 8, but $billions of dollars vanished in one day for those dumb enough to think they could continue to make easy money with the Velocity Shares Daily Inverse VIX Short Term exchange-traded note (XIV), which ceremoniously dropped over 80% overnight, wiping out all of its shareholders.
The supposed trigger for this drop was a rise in bond yields, as the 10-year Treasury Note increased in yield from 2.40% to 2.90% in about six weeks. All of a sudden, RATES matter.
We’ve Reduced Risk
As a result of the selling, there has been a considerable amount of technical damage to both the stock and bond markets. This has started to show up in our risk models, as two of our 8 stock market models have flipped negative since early February. Since February 20, all tactical accounts are down to 74% stock exposure, and 26% cash, while the TABR Dividend Stock program is down to 70% invested and 30% cash.
In addition, our high yield bond risk model went negative for the first time in over 13 months. On February 12, we sold 90% of our positions in high yield funds and moved that capital to short term bond funds.
This is a great example of our tactical process. When the evidence changes, we change. Last year, our work was positive and heavily invested the entire year. But, things are beginning to change, and that is showing up in our models.
Below is a chart of the Blackrock High Yield Bond Fund, one of about 10 different high yield funds we own in client accounts. The chart is courtesy of www.stockcharts.com.
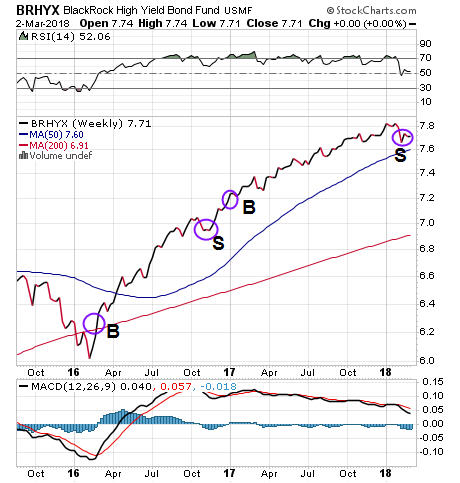
In the past two years, our high yield model has had two BUY and SELL signals, the first lasting from February 2016 to November 2016, and the second from January 2017 to February 2018. Based on the Lipper High Yield Fund Index, gains were over 14% for the trade in 2016 and were over 6.4% for the trade just concluded. However, spreads in this market are very low, suggesting there is little value in high yield at these prices.
We have no idea how long our model will be in a negative mode, but we are hoping it will be months rather than weeks, as we would love to buy back at much lower prices. We do know that when high yield is in a negative mode, it is not historically been good for the stock market. With the average yield of junk bond funds at about 5.5%, there’s nothing HIGH in high yield.
Another Leg Down Appears Likely
Pardon the pun, but this section is going to get a bit TECHNICAL, but I endeavor to simplify it as much as possible. The obvious question after the recent selling is—what does it mean? Is the bull market over? Are we going back to new highs?
First, please know that no one knows those answers. But, leaning on 35 years of watching markets, here’s my best guess.
At best, the decline into the February 8 low was a warning shot. It may mark the beginning of a topping process that will last several months, which is the norm in history at looking at major stock market peaks. There is an indicator I have followed daily since 1988 called the McClellan Oscillator, which is a breadth/momentum indicator which measures the difference between the number of stocks on a daily basis going up, versus the number of stocks going down. It is plotted below, in the chart, courtesy of www.stockcharts.com.
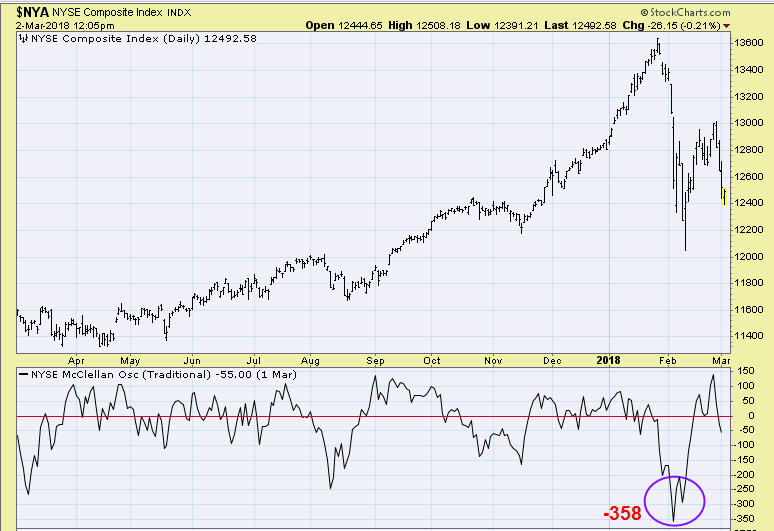
The decline a few weeks ago moved the Oscillator to a reading of -358 (circle on chart), which is extremely oversold. There are not many readings in history this low, though one has to adjust for the number of issues traded over time, and use a ratio-adjusted oscillator. Nevertheless, this was the lowest nominal reading since August 2011, when the McOsc reached -438. So, I simply went back to our data to see what happened in the aftermath of that reading. That summary is below.
8-8-2011 McOsc at -438 SPX at 1119.46 (SPX is the S&P 500)
8-31-2011 SPX recovers to 1218.89, a 8.88% gain
10-3-2011 McOsc at -166 SPX at 1099.23, a new low, which is 1.8% below the prior low and 9.8% below the rally high, which was a failure
Here’s how the current pattern is looking at present:
2-5-2018 McOsc at -358 SPX at 2648.94
2-8-2018 McOsc at -293 SPX at 2581, the low so far
2-26-2018 SPX at 2779.60, a 7.69% gain
So, if we are going to see a similar outcome, sometime in late March to early April, we should see stocks undercut the February 8 low in the low 2500 zone. It’s possible that process has already started, as stocks have dropped nearly 4% in the past four trading sessions.
One other method of analysis which lends credence to the outcome above is using what’s called the Elliott Wave Theory. From 1983 to 1988, I was really into using this method, which has been popularized by Robert Prechter. But, I soon learned that the method was too subjective for my taste, and switched entirely to more quantitative methods which could be tested.
Nevertheless, there are times when the “wave analysis” can be quite clear and helpful in understanding the context of where markets are. The Theory is built on the premise that bull markets have five waves, which break down into three upwaves (1,3,5) and are separated by two corrective waves (2, 4).
Below is a chart, also from www.stockcharts.com, which features the interpretation of analyst John Murphy on where he thinks we are.
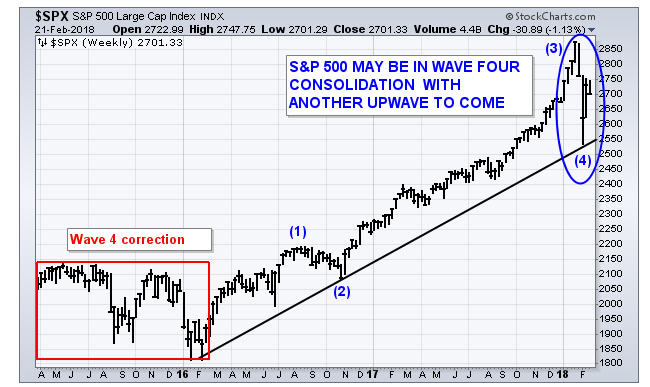
Murphy thinks that the decline that started in late January is part of 4th wave correction. Most, but not all, 4th waves have a down/up/down sequence. The chart below that I created shows there are clearly five waves down from the peak, which have thus far been followed by three waves up. If all is true to form, this should be followed at a minimum by another five waves down, which will eclipse the February 8 low.
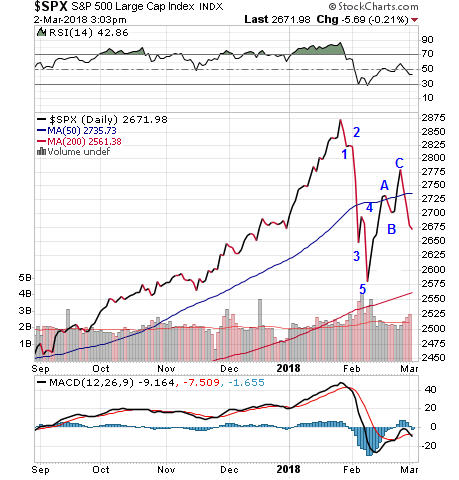
If this analysis is correct (and that is a Big IF), the good news is that the decline should be followed by one more move to new all-time highs above the January peak. The bad news is that would likely be the final peak, which will be followed by the biggest stock market decline since 2008.
For reasons that we’ve outlined for many months, the odds continue to favor that the recent decline is a corrective process within an on-going bull market. That is because major breadth indicators confirmed the high in January, and in only 2 of 19 prior major peaks since 1929 has that not been the case. A multi-month topping process with divergences is the norm, not the exception.
As we have all been seeing though, in life, in markets and in sports, unprecedented things are happening, so it’s possible stocks have already peaked. No one knows. For our part, it really does not matter. The evidence is changing, and some of our models have turned more defensive. Should there be more deterioration in the weeks ahead, we will likely see more of our models turn negative, which would cause us to raise more cash. That is how our process works. It does not predict, because no one can do that.
Overall, I believe the message is clear. Risk is rising in a very overvalued stock market, and sticking around trying to be aggressive and make a buck is like trying to pick up pennies in front of a steam roller. That is a fool’s game.
A Little Personal Finance (Class, That Is)
I have mentioned from time to time my on-going involvement with the Cal State Fullerton baseball team, which is where I got my start as in intern in 1978. My commitment there has grown in the last six years under Coach Rick Vanderhook.
I initiated a leadership committee several years ago which oversees our annual fundraising dinner and baseball finances in general, as I became concerned about the future of Titan Baseball when in 2011, UC Berkeley (Cal) nearly dropped their baseball program. For those of you who know, Cal competes in the Pac-12 conference with the likes of USC and UCLA, and benefits from a football TV package that gives each school about $36 million annually. For some perspective, Fullerton’s TOTAL athletic budget is around $14 million, of which about $1.4 million is spent on baseball.
Last summer, Fullerton made it to the College World Series for the second time in three years. Look at who the other seven schools were—Florida, Florida State, LSU, Oregon State, Louisville, TCU and Texas A&M. The Titans are like the Little Engine That Could. They will always be at a financial disadvantage, but that has never hampered their success on the field, for the past 42 years.
Where possible, and besides my involvement with the University’s Finance Department, I’ve always looked for different ways to give back, in addition to monetary gifts. In the fall of 2013, our family began its own journey of having a son or daughter in college, with son Adam starting a four-year stint at New York University.
I’m not sure I spent enough time transferring my personal finance expertise to him (and am still doing so!), but realized the 35 young men on our team have the same issues of learning how to handle their money. Frankly, ALL college students have these issues.
So, I went to Coach Vanderhook with the idea of teaching a 3-hour course to the team, trying to cover as many key areas that would be relevant to them. That started in 2014, and we then expanded it to include the Titans Women’s Softball Team. On January 20, we finished our fourth year of doing this (the 3rd combined with Softball), where I had over 60 student-athletes for the entire morning (we feed them a nice meal as well).
Since many of these students have never had a job, we literally start with a real paycheck example, and go into income taxes, Medicare, Social Security, disability taxes and the like to show them what happens to their money. We talk about debt, credit cards, debit cards, budgeting, car insurance, how to buy a car, and what a FICO score is and why it’s important.
We delve into amortization schedules and the power of compound interest along with the importance of saving and cyber security measures. In addition, we give each student a book that we think can be helpful for their own study, and this year we switched to “Why Didn’t They Teach Me This In School?” by Cary Siegel.
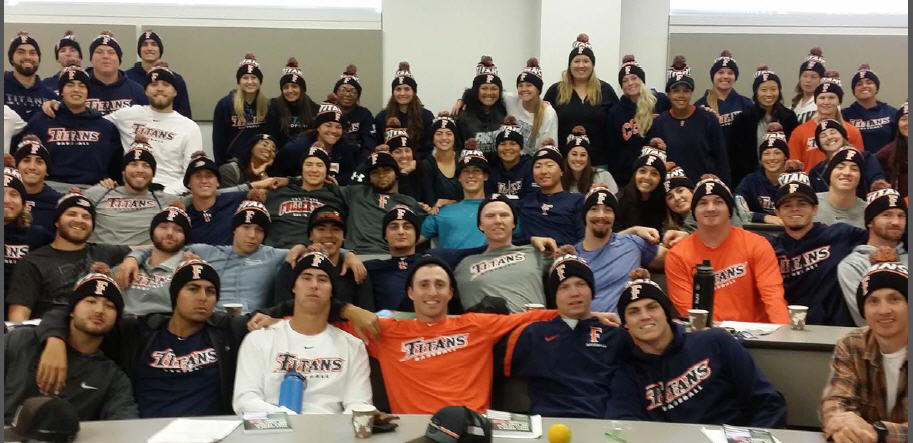
All in all, this is one of the most enjoyable things I do, and hopefully, we’ll get to continue on this path for many years to come. After all, we still have our 13-year-old daughter Caroline at home who has college ahead of her. Below is a photo of this year’s combined class, proudly wearing their combination Fullerton/Anaheim Ducks beanies that I was able to secure for them.
Material Of A Less Serious Nature
A guy stopped at a local gas station, and after filling his tank, he paid the bill and bought a soft drink. He stood by his car to drink his cola, and watched a couple of men working alongside the road. One man would dig a hole two or three-feet deep, and then moved on. The other man came along behind him and filled in the hole. The men worked right past the guy with the soft drink and continued on down the road.
“I can’t stand this,” said the man tossing the can into a trash container and heading down the road toward the men. “Hold it, hold it,” he said to the men. “Can you tell me what’s going on here with all this digging and refilling?”
“Well, we work for the government and we’re just doing our job,” one of the men said.
“But one of you is digging a hole and the other fills it up. You’re not accomplishing anything. Aren’t you wasting taxpayers money?”
“You don’t understand, mister,” one of the men said, leaning on his shovel and wiping his brow. “Normally, there’s three of us: me, Elmer and Leroy. I dig the hole, Elmer sticks in the tree and Leroy here puts in the dirt.”
“Elmer’s job’s been cut. . . .so now it’s just me an’ Leroy!”
Thanks as always for your continued trust and confidence in all of us at TABR.
Sincerely,

Bob Kargenian, CMT
President
TABR Capital Management, LLC (“TABR”) is an SEC registered investment advisor with its principal place of business in the state of California. TABR and its representatives are in compliance with the current notice filing and registration requirements imposed upon registered investment advisors by those states in which TABR maintains clients. TABR may only transact business in those states in which it is notice filed, or qualifies for an exemption or exclusion from notice filing requirements.
This newsletter is limited to the dissemination of general information pertaining to our investment advisory/management services. Any subsequent, direct communication by TABR with a prospective client shall be conducted by a representative that is either registered or qualifies for an exemption or exclusion from registration in the state where the prospective client resides. For information pertaining to the registration status of TABR, please contact TABR or refer to the Investment Advisor Disclosure web site (www.adviserinfo.sec.gov).
The TABR Model Portfolios are allocated in a range of investments according to TABR’s proprietary investment strategies. TABR’s proprietary investment strategies are allocated amongst individual stocks, bonds, mutual funds, ETFs and other instruments with a view towards income and/or capital appreciation depending on the specific allocation employed by each Model Portfolio. TABR tracks the performance of each Model Portfolio in an actual account that is charged TABR’s investment management fees in the exact manner as would an actual client account. Therefore the performance shown is net of TABR’s investment management fees, and also reflect the deduction of transaction and custodial charges, if any.
Comparison of the TABR Model Portfolios to the Vanguard Total Stock Index Fund, the Vanguard Total International Stock Fund and the Vanguard Total Bond Index Fund is for illustrative purposes only and the volatility of the indices used for comparison may be materially different from the volatility of the TABR Model Portfolios due to varying degrees of diversification and/or other factors.
Past performance of the TABR Model Portfolios may not be indicative of future results and the performance of a specific individual client account may vary substantially from the composite results above in part because client accounts may be allocated among several portfolios. Different types of investments involve varying degrees of risk, and there can be no assurance that any specific investment will be profitable.
The TABR Dividend Strategy presented herein represents back-tested performance results. TABR did not offer the Dividend Strategy as an investment strategy for actual client accounts until September/October 2014. Back-tested performance results are provided solely for informational purposes and are not to be considered investment advice. These figures are hypothetical, prepared with the benefit of hindsight, and have inherent limitations as to their use and relevance. For example, they ignore certain factors such as trade timing, security liquidity, and the fact that economic and market conditions in the future may differ significantly from those in the past. Back-tested performance results reflect prices that are fully adjusted for dividends and other such distributions. The strategy may involve above average portfolio turnover which could negatively impact upon the net after-tax gain experienced by an individual client. Past performance is no indication or guarantee of future results and there can be no assurance the strategy will achieve results similar to those depicted herein.
For additional information about TABR, including fees and services, send for our disclosure statement as set forth on Form ADV from us using the contact information herein. Please read the disclosure statement carefully before you invest or send money.
A list of all recommendations made by TABR within the immediately preceding one year is available upon request at no charge. The sample client experiences described herein are included for illustrative purposes and there can be no assurance that TABR will be able to achieve similar results in comparable situations. No portion of this writing is to be interpreted as a testimonial or endorsement of TABR’s investment advisory services and it is not known whether the clients referenced approve of TABR or its services.