Deja Vu. . . . . .All Over Again, And A Guaranteed 62% Jump In Income
The late Hall of Fame baseball player and manager Yogi Berra was also known for his many quirky quotes. Back in 1985, a sportswriter was describing the performance of golfer Payne Stewart, who had just lost a tournament on the first extra hole, just as he had done the prior year at Colonial. The writer wrote, “As Yogi said, it was deja vu all over again.”
Of course, deja vu is the feeling of having already experienced the present situation. Does that sound like today’s stock market? Wait until you see below the comparison between earnings per share and price of the S&P 500.
We’ll also touch on one of the biggest free lunches ever, along with a piece that complements our lead story, Should You Fear The CAPE? Finally, we close with it’s US (U.S.) Against The World.
Deja Vu All Over Again
Until the 1999-2000 Internet bubble, there had not been a more over-valued stock market using fundamental earnings metrics unless one went back to 1929. In the three-year period bottoming in 1932, the S&P 500 lost more than -80% of its value. At the end of 1999, Wall Street earnings forecasts were rising strongly, as a combination of exciting new technology and an attitude that the good times could just keep on rolling had expectations running high.
Peaking in March 2000, the NASDAQ went on to lose -83% during the next three years, while the S&P 500 fell -50%. In terms of a set-up, what happened then is happening now. Take a look at the two charts below, which are courtesy of Grantham Mayo and their research team, and can be found at www.gmo.com.

The chart on the left compares the EPS (earnings per share) forecasts with the S&P 500 Index in the 7-year period leading up to March 2000. Prices grew 69% faster than earnings forecasts, and the ending wasn’t pretty. Today, we’re seeing a similar story, with the chart on the right. Once again, earnings forecasts are rising strongly, but prices have grown 70% faster. There’s strong belief in many of the large growth companies for continued dominance (think Apple, Amazon, Google, etc.), with the top 10 companies in the S&P 500 Index comprising nearly 25% of its value. Coupled with a belief that the Fed always has the markets’ back, you can’t lose, right?
We don’t know how this will all end, but it should be remembered that one can pay too much for even great companies.
A 62% Guaranteed Bump. . . .From Social Security
It’s been said that patience is essential to daily life—-and might be key to a happy one. In fact, recent studies have found that, sure enough, good things really do come to those who wait. But, according to a recent survey by Schroders Investment Management of pre-and post-retirees 45 and older, most individuals haven’t learned that lesson, at least not in relation to their Social Security benefits.
If there was ever a free lunch in investing and planning (and there aren’t many), delaying benefits until age 70 is it. Yet, only 10% of those surveyed plan to wait to 70 to claim benefits, and even for the subset who are at or near retirement, from ages 60 to 67, the number was only 13%. Unfortunately, they are leaving guaranteed, inflation-adjusted money on the table, and in many cases, it’s not trivial.
I’m going to use my own estimated benefits as an example. See below. Before getting into the details, many of you may not know that about two months ago, the Social Security Administration (SSA) updated the graphical look of their statements. They did a really good job, and the information is now presented in a much more effective format. I’ve reproduced one of the pages below that is tailored to my personal work record. If you’ve not already seen the new statements, I’d encourage you to log in to your personal account at www.ssa.gov and take a look. The SSA policy is to only mail a hard copy to individuals once every five years if they are younger than 60 years old. If you have your own account, all you need to do is log in once a year and check that the data has been properly recorded and updated.
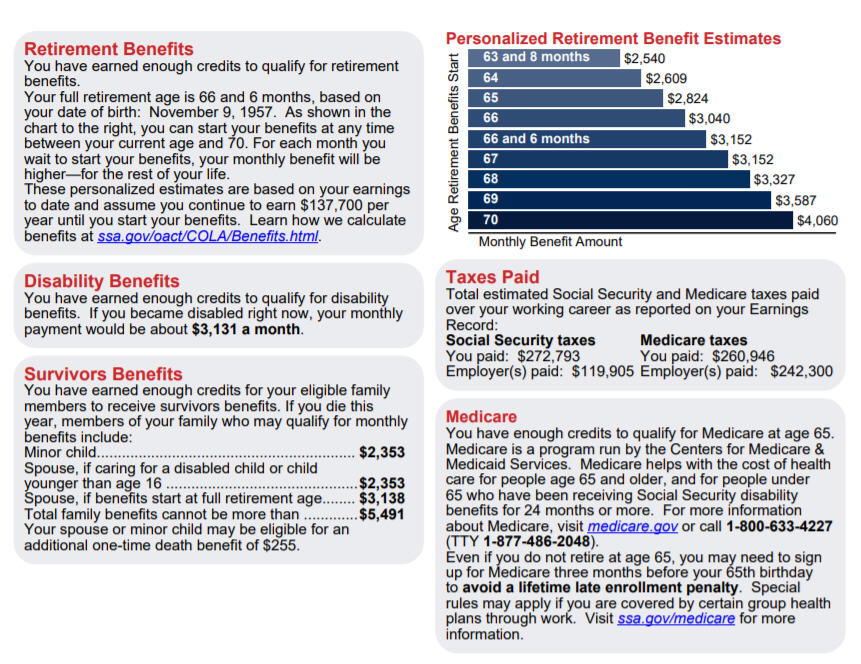
Now, to that free lunch I mentioned. Where’d I come up with the 62% guaranteed bump in income? Take a look at the section below labeled “Personalized Retirement Benefit Estimates.” The table illustrates the monthly benefit amount paid at each age ranging from 63 1/2 to 70, along with 66 1/2, which is considered my full retirement age (FRA). Two months ago, I was 63 1/2, and the benefit would have been $2505 per month had I started taking payments then. I’ll be 64 in November. But look at my benefit at age 70. It increases to $4060. Compared to 63 1/2, that’s over $1500 a month more, or $18,000 annually. And that’s a 62% bump, and it’s guaranteed. All I have to do is wait.
One caveat I do want to mention. See the box labeled “Retirement Benefits.” Make sure you understand the last paragraph. “These personalized estimates are based on your earnings to date and assume you continue to earn $137,700 per year until you start your benefits.” What does that mean?
First, by earnings, they are referring to Social Security earnings, not one’s total earnings. Each year, the federal government sets a limit on the amount of earnings subject to Social Security tax (which is 12.90%, 6.45% paid by the employee and 6.45% paid by the employer). In 2020, that limit was $137,700. It is increasing sharply to $142,800 in 2021, and likely will increase in future years as well.
So, the estimate of my monthly benefit of $4060 at age 70 is contingent on me continuing to work until age 70, and having earnings of at least $137,700 each year. If I retired right now, and still delayed my benefits until age 70, I wouldn’t be getting $4060 per month. It would be something less than that, but probably not much less. For those of you who want exact details of that kind of a scenario, you can go to learn how the benefits are calculated at ssa.gov/oact/COLA/Benefits.html.
Why do so many people ignore the evidence which clearly favors delaying benefits? I wish I had a definitive answer to that, but it appears to be a combination of a lack of understanding (education), headstrong thinking and misguided beliefs. I also suspect a large segment of the population simply can’t afford to wait, but I think that is directly linked to a lack of education on the subject.
In that vein, according to the website Statista, only 29% of Americans in 2020 worked with a financial advisor. Therefore, 71% of America is on their own to figure this out themselves. Good luck with that, especially given the total lack of personal finance training which exists in high schools and colleges. Even working with a financial advisor, though, doesn’t always help. According to the 8th Annual Social Security Consumer Survey conducted by Nationwide’s Retirement Institute, more than half (53%) of the respondents age 25+ who work with a financial professional say that person doesn’t provide advice about how and when to file for Social Security benefits.
Unfortunately, that’s a black eye for our industry, but the truth is, not all financial advisors have planning and tax expertise, and many are simply only interested in managing your money. That doesn’t cut it for us. And on the subject of headstrong and misguided beliefs, you’d be surprised at some of the thinking we’ve come across from investors.
It ranges from “I’m going to take it while I can get it,” to “I better take it before they take it away,” to “I won’t break even unless I live to age 80.” In some cases, there’s a general mistrust of government. Most of the arguments don’t hold up when examined with the cold, hard data, but hey, don’t confuse me with the facts. Who said us humans were rational?
We absolutely take into consideration one’s personal health situation when advising clients in this area, since if one has poor family historical longevity or personalized issues that suggest the probability is low they would live beyond 80, then the analysis might favor claiming early. Even then, though, one’s spouse and the estimated benefits for both (if married) come into play. It’s not just about you. A husband or wife whose earnings are much greater than their spouse would be doing a disservice to their spouse by claiming early, because when the first spouse dies, the second spouse keeps the greater of the two benefits and the lower one goes away.
The break-even analysis can also be flawed. We do, in fact, look at break-even analysis, and as a general rule, most situations show that one would need to live to at least 80 for the delayed strategy of waiting until age 70 to be more beneficial financially. Let me ask you this, though. When you purchase homeowners insurance, do you do break-even analysis, and hope your home burns down so you can collect? How about on your auto insurance? Do you hope to get in an accident so you can collect? I didn’t think so.
Bottom line, one should be thinking about Social Security benefits as longevity insurance. The longer you live, the better those delayed benefits will look, and may I remind you they come with a cost of living adjustment. Speaking of the COLA, current news reports are suggesting that the COLA for 2022 may exceed 6%, which would be the largest adjustment in over 20 years. The official number should be announced in September or October.
Should You Fear The CAPE?
The big speculative wildcard over the next decade for the stock market is what is going to happen to the change in valuation? As the charts above from Grantham Mayo show, prices have been rising much faster than earnings, and this results in multiple expansion. It’s very clear that multiple expansion has driven markets for the past 10 plus years, and as a result, many analysts on Wall Street have started to disdain valuation methods, arguing that things are different in today’s economy, and also, that with interest rates historically low, stocks SHOULD be more valuable, since they represent future discounted cash flow.
Some of these arguments may in fact have some validity to them. But when multiple methods come to the same conclusion—mainly, that stocks are VERY expensive using historical standards, it would be wise not to ignore that information.
One indicator of valuation that has become quite popular in the last 20 years is the CAPE Ratio, developed by Yale economist Robert Shiller. The CAPE stands for cyclically-adjusted price/earnings, where instead of just looking at the markets’ earnings for the past year, you take the earnings for each of the past 10 years and average them, so you get a cycle. Shiller took the data back to 1871 when he first published the work around 1999, but personally, I don’t feel that stock market data prior to around 1926 is very accurate.
Nevertheless, we don’t need to worry about that when examining what has happened in the last 50 years or so. Rob Arnott’s firm, Research Affiliates, published a table in January that summarizes the valuation change since 1975, using the CAPE Ratio. It is re-produced below. It’s a bit hard to read in the footnotes, but the far right column of Ending Percentile Rank illustrates the S&P 500 CAPE Ratio relative to its history back to 1871.

Some observations. The S&P 500 began 1980 with a CAPE ratio of 8.7, which put it in the 9th percentile historically (in hindsight, at that time). The market has never looked back. Think BUY LOW. That was 1980. It led to the best 20-year period in the markets’ history, with compound returns of around 16% from 1980 to 1999. During that time, the ratio expanded from 8.7 to its all-time high of 44.2. By then, stocks were so overvalued that for the next 10 years, 2000 to 2009, the S&P 500 actually lost money. It also resulted in a -54% reduction in the CAPE ratio. That’s called mean reversion.
At the end of 2009, and especially in March of 2009, stocks had once again become very cheap, and it resulted in a very strong 10 years of returns from 2010-2019, as the ratio expanded once again to 30.3. At the end of 2020, as shown on the chart below courtesy of Ned Davis Research, the ratio had grown to 33.2, and today it sits at 38.7. That level has only been surpassed by the era of the dot-com bubble.

Stock market forecasting methods to predict future returns are fraught with danger, because we assume the future will be like the past. But, it not always is. Yet, it’s all we have to go on. To measure the accuracy of a method, statisticians use the correlation coefficient to analyze methods side by side. One can see in the chart that the expected forward 10-year return for stocks as of December 31, 2020 was 2%. But, that was when the ratio was 33.2. With the CAPE above 38, the future return now is even lower, down to 0.80%, and this method has a correlation coefficient of around -0.81. That is very strong.
And, just to throw another log into the fire which arrives at similar conclusions, Doug Ramsey of the Leuthold Group shows the relationship between the S&P 500 P/E on Peak GAAP EPS (that’s Generally Accepted Accounting Principles and Earnings Per Share) and 10-year forward returns. That chart is shown below.
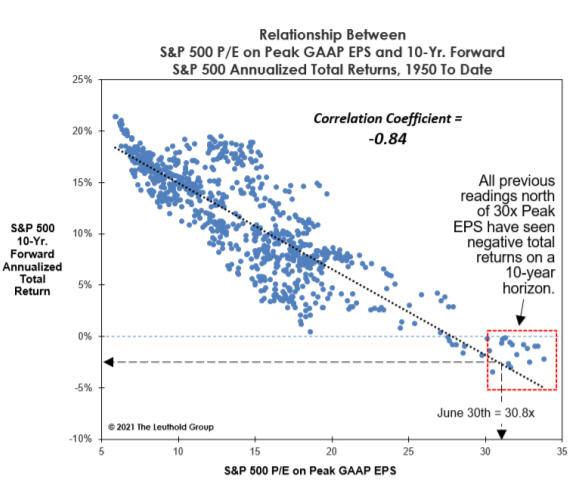
The correlation coefficient is even stronger at -0.84, and with Peak EPS at 30.8 on June 30, 2021, this method is suggesting forward 10-year returns of -2% compounded. These numbers may seem far-fetched, especially when you consider that since December of 2008, the S&P 500 has compounded at 15.7% for the past 12 1/2 years. Does this sound familiar to 1999? Stocks really can’t go down for a long time, can they? Not very often, but yes, they can. Will it happen again? Nobody knows. Anything is possible. Maybe for many years, earnings go up, and prices remain around current levels. That would be mean reversion without price damage, but it would still mean no gains. All we know is that history suggests valuations will eventually mean revert, and that path is usually not a smooth one. Though we all know this intuitively, we need to be cognizant that big returns don’t last forever.
US (U.S.) Against The World
Conventional wisdom on Wall Street advocates that diversified portfolios should always have exposure to international equities. Some strategists have even argued that since over 50% of the world’s market cap is outside the United States, one should maintain a 50% allocation to international stocks within one’s equity pie.
If you’ve followed this advice over the last 14 years, its cost you a lot of money. For three international equity indexes and funds, I went back and calculated their total return from October 31, 2007, which was in essence the top of the bull market that descended into the Great Financial Crisis, to July 23, 2021. The results were staggering, and are shown below. Every one of the international indexes/funds is below their nominal price level of nearly 14 years ago, but when one includes reinvested dividends, they eke out a small return.
| Fund/Index | Price 10-31-07 | Price 7-23-21 | Compound Return W/Div |
| EFA Index | 86.10 | 79.22 | 2.5% |
| EEM Index (EmergMkts) | 55.73 | 52.51 | 1.6% |
| Vanguard Total Int’l Fund | 21.89 | 20.87 | 2.5% |
| IVV (S&P 500) | 155.13 | 441.76 | 10.1% |
| no dividends | includes dividends |
You’ll hear arguments today that foreign stocks are cheap relative to their U.S. counterparts, and that you should load up on them. By valuation methods, I will agree they are cheap, but I wouldn’t load up on them. Valuation methods don’t seem to work very well on foreign companies and markets, and candidly, companies are run much better in the U.S.
Ultimately, we feel it’s best just to pay attention to the relative price movements of the markets, and make adjustments accordingly. One way to do this is the ratio of the Vanguard Total Stock Market Index (VTSMX) to the Vanguard Total International Stock Index (VGTSX). That is plotted on a point and figure chart below, courtesy of www.dorseywright.com.
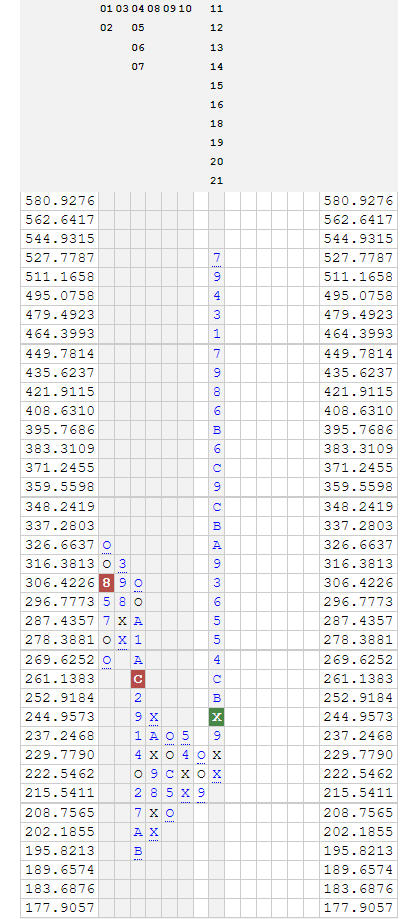
It helps to understand point and figure charting to understand the meaning of the chart, but the chart has been in a column of X’s, favoring U.S. stocks, since September 2011. It will not turn down into a column of O’s until the ratio declines in favor of international stocks by approximately 10%. This will happen at some point, and when it does, we will increase the international exposure in our Passive Index account. But, can you see why it makes little sense to have a static rule that says you should own some international all the time? It may be hypocritical that in fact we do this in the Passive Index account, but our ratio is 75% domestic, 25% international. In TABR’s tactical accounts, we will only own international ETFs when they go to the top of our rankings, and except for IEMG appearing briefly for parts of the past two years, we’ve owned almost nothing in foreign equity exposure.
Current Portfolio Allocations
This sounds like a broken record. We’ve had no allocation changes. Our stock allocations are 100% invested. Our high yield bond model remains on its November 9 BUY signal. Yawn. But, there is deterioration under the surface. Non-confirmations are beginning to add up, with the S&P 500, NASDAQ and Dow Industrials hitting all-time highs last Friday, and almost nothing else, including Transports, Utilities, small-caps, mid-caps, and international stocks.
The high yield bond market also did not confirm the new highs in stocks. The longer this goes on, the more dangerous the market will become. We are also in the worst seasonal period of the year, which extends through October, and the 2021 S&P 500 Cycle chart is forecasting a fairly big decline from about right now through October. We’ll see.
Material Of A Less Serious Nature
A college history professor reminds her class of tomorrow’s final exam. “Now class, I won’t tolerate any excuses for you not being here tomorrow.” She continues, “I might consider a nuclear attack or a serious personal injury or illness, but that’s it, no other excuses whatsoever!”
A smart-ass guy in the back of the room raises his hand and asks, “What would you say if tomorrow I said I was suffering from complete and utter sexual exhaustion?”
The entire class does its best to stifle their laughter and snickering.
When silence was restored, the teacher smiles sympathetically at the student and says, “Well, I guess you’d have to write the exam with your other hand.”
Summer seems like it is in full swing (it is), yet at least for our daughter (and many others), school starts again in just 4 weeks. Wow, that went fast. I just pray that every elementary, high school and college student in our nation will get to go back to school and see their teachers in person, even if they have to wear a mask. Teachers and students need one another, and I hope that happens starting next month.
Let’s face it. COVID is not going away, so let’s deal with the serious stuff. NFL training camps are about to open, and the league announced this past week that if a team cannot field enough healthy players because too many of them haven’t been vaccinated and they are testing positive, they may have to forfeit the game, the game will not be made up, and the players will not be paid. I will tell you what. If that happens to my 49ers, millions of us 49ers fans are going to be really pissed. But if it happens to the Rams or the Seattle Seahawks, I’m going to be really ecstatic! So, if you love football, call your favorite NFL team and tell them to get with it. Millions of young and old men (even some women!) who play fantasy football every week are counting on it.
Sincerely,

Bob Kargenian, CMT
President
TABR Capital Management, LLC (“TABR”) is an SEC registered investment advisor with its principal place of business in the state of California. TABR and its representatives are in compliance with the current notice filing and registration requirements imposed upon registered investment advisors by those states in which TABR maintains clients. TABR may only transact business in those states in which it is notice filed, or qualifies for an exemption or exclusion from notice filing requirements.
This newsletter is limited to the dissemination of general information pertaining to our investment advisory/management services. Any subsequent, direct communication by TABR with a prospective client shall be conducted by a representative that is either registered or qualifies for an exemption or exclusion from registration in the state where the prospective client resides. For information pertaining to the registration status of TABR, please contact TABR or refer to the Investment Advisor Disclosure web site (www.adviserinfo.sec.gov).
The TABR Model Portfolios are allocated in a range of investments according to TABR’s proprietary investment strategies. TABR’s proprietary investment strategies are allocated amongst individual stocks, bonds, mutual funds, ETFs and other instruments with a view towards income and/or capital appreciation depending on the specific allocation employed by each Model Portfolio. TABR tracks the performance of each Model Portfolio in an actual account that is charged TABR’s investment management fees in the exact manner as would an actual client account. Therefore the performance shown is net of TABR’s investment management fees, and also reflect the deduction of transaction and custodial charges, if any.
Comparison of the TABR Model Portfolios to the Vanguard Total Stock Index Fund, the Vanguard Total International Stock Fund and the Vanguard Total Bond Index Fund is for illustrative purposes only and the volatility of the indices used for comparison may be materially different from the volatility of the TABR Model Portfolios due to varying degrees of diversification and/or other factors.
Past performance of the TABR Model Portfolios may not be indicative of future results and the performance of a specific individual client account may vary substantially from the composite results above in part because client accounts may be allocated among several portfolios. Different types of investments involve varying degrees of risk, and there can be no assurance that any specific investment will be profitable.
The TABR Dividend Strategy presented herein represents back-tested performance results. TABR did not offer the Dividend Strategy as an investment strategy for actual client accounts until September/October 2014. Back-tested performance results are provided solely for informational purposes and are not to be considered investment advice. These figures are hypothetical, prepared with the benefit of hindsight, and have inherent limitations as to their use and relevance. For example, they ignore certain factors such as trade timing, security liquidity, and the fact that economic and market conditions in the future may differ significantly from those in the past. Back-tested performance results reflect prices that are fully adjusted for dividends and other such distributions. The strategy may involve above average portfolio turnover which could negatively impact upon the net after-tax gain experienced by an individual client. Past performance is no indication or guarantee of future results and there can be no assurance the strategy will achieve results similar to those depicted herein.
Inverse ETFs
An investment in an Inverse ETF involves risk, including loss of investment. Inverse ETFs or “short funds” track an index or benchmark and seek to deliver returns that are the opposite of the returns of the index or benchmark. If an index goes up, then the inverse ETF goes down, and vice versa. Inverse ETFs are a means to profit from and hedge exposure to a downward moving market.
Inverse ETF shareholders are subject to the risks stemming from an upward market, as inverse ETFs are designed to benefit from a downward market. Most inverse ETFs reset daily and are designed to achieve their stated objectives on a daily basis. The performance over longer periods of time, including weeks or months, can differ significantly from the underlying benchmark or index. Therefore, inverse ETFs may pose a risk of loss for buy-and-hold investors with intermediate or long-term horizons and significant losses are possible even if the long-term performance of an index or benchmark shows a loss or gain. Inverse ETFs may be less tax-efficient than traditional ETFs because daily resets can cause the inverse ETF to realize significant short-term capital gains that may not be offset by a loss.
For additional information about TABR, including fees and services, send for our disclosure statement as set forth on Form ADV from us using the contact information herein. Please read the disclosure statement carefully before you invest or send money.
A list of all recommendations made by TABR within the immediately preceding one year is available upon request at no charge. The sample client experiences described herein are included for illustrative purposes and there can be no assurance that TABR will be able to achieve similar results in comparable situations. No portion of this writing is to be interpreted as a testimonial or endorsement of TABR’s investment advisory services and it is not known whether the clients referenced approve of TABR or its services.