Do You Feel Like We Do?
Na Na Nuh Nuh Na Na, Na Na Nuh Nuh Na Na, Na Na Nuh Nuh Na Naaaaa
Woke up this morning with a wine glass in my hand
Whose wine? What wine?
Where the hell did I dine? (hint–The French Laundry)
Must have been a dream
I don’t believe where I’ve been
Come on, let’s do it again
Do you, you feel like I do?
Do you, you feel like I do?
Most of the time, the humor in this update has to wait until the very end. And that won’t disappoint you. But thanks to the lyrics from Peter Frampton’s smash 1976 classic rock hit, Do You Feel Like We Do, I figured it was a perfect chance to mock the Governor of California and his recent restaurant escapades. Just in case you were wondering what the heck the first line is, well, that is my best attempt to WRITE the guitar riff that starts the song. It’s also the perfect question as we close out a year most of us may want to forget.
I was so enamored with Frampton in junior college I went out and purchased a brand new acoustic guitar, and started taking lessons. I think I had this vision of someday playing Baby I Love Your Way to my future bride at my future wedding. Unfortunately, Michelle will testify that never happened. She probably also won’t admit that with a friend’s wife playing our piano, I pretty much nailed the first two stanzas of I Write The Songs and Copacabana, and sounded almost exactly like Barry Manilow. And to think, I hadn’t even consumed a glass of wine from the French Laundry.
All of this has very little to do with financial markets, and that’s sort of the point this month. Life is more important than money, though I can attest, without the latter, life can be much more difficult. In trying to answer the question, Do You Feel Like We Do, I came up with this list of adjectives that expresses my place:
Frustrated
Angry
Resigned
Persevering
Unbelievable (both in a good way and a bad way)
Empathetic
Disgusted
Grateful
Hopeful
Portfolio Allocations—Bullish, But Wary
Our stock market risk models have been 100% invested for 9 of the past 11 weeks, having been whipsawed the week of the election, while our high yield bond risk model also flipped to fully invested on November 9 as well. That day will live in infamy. Besides being my birthday (63 if you’re wondering), that day marked the announcement from Pfizer of successful vaccine trials. That created the biggest divergence between growth and value stocks nearly in history, with the S&P 600 Smallcap Index soaring 4.8% for the day while the Nasdaq 100 (think Amazon, Apple, Google, Tesla) dropped over -2%.
That proved to be a mere hiccup in the market’s rally. Since the close of November 9, the S&P 500 has been the laggard amongst major stock indexes, up a paltry 4.47% in 6 weeks. In the same period, the Nasdaq 100 gained over 7%, the Vanguard Total International Stock Index fund gained over 8% with the S&P 600 Smallcap soared nearly 14%.
The technical evidence remains positive, with no divergences to speak of. With small caps leading, that historically is very bullish, so our job is to sit back and follow our discipline, until the evidence changes. External indicators, mostly related to market sentiment, though, are suggesting a speculative atmosphere that mirrors the latter part of 1999 and early 2000.
In the past few weeks, the gains on several IPOs (initial public offerings) are approaching absurdity. DoorDash jumped 85% from its offering price, while Airbnb was up 135% its first day. These are not exactly business models that are life changing, unless you happen to think that getting chicken wings with french fries delivered to your door at midnight on Saturday to go with the beer you have is essential to happiness.
When sentiment gets to be too one-sided (in either direction), it usually means at least a pause in the trend, if not an outright reversal. But, sentiment indicators are much like valuation indicators—they aren’t that useful for timing. Sentiment can remain extremely bullish, or bearish, for long stretches of time.
Below is the NDR Daily Trading Sentiment Composite from Ned Davis Research. It’s designed to highlight short-term swings in investor psychology. It combines a number of individual indicators (18) to represent the psychology of a broad array of investors.
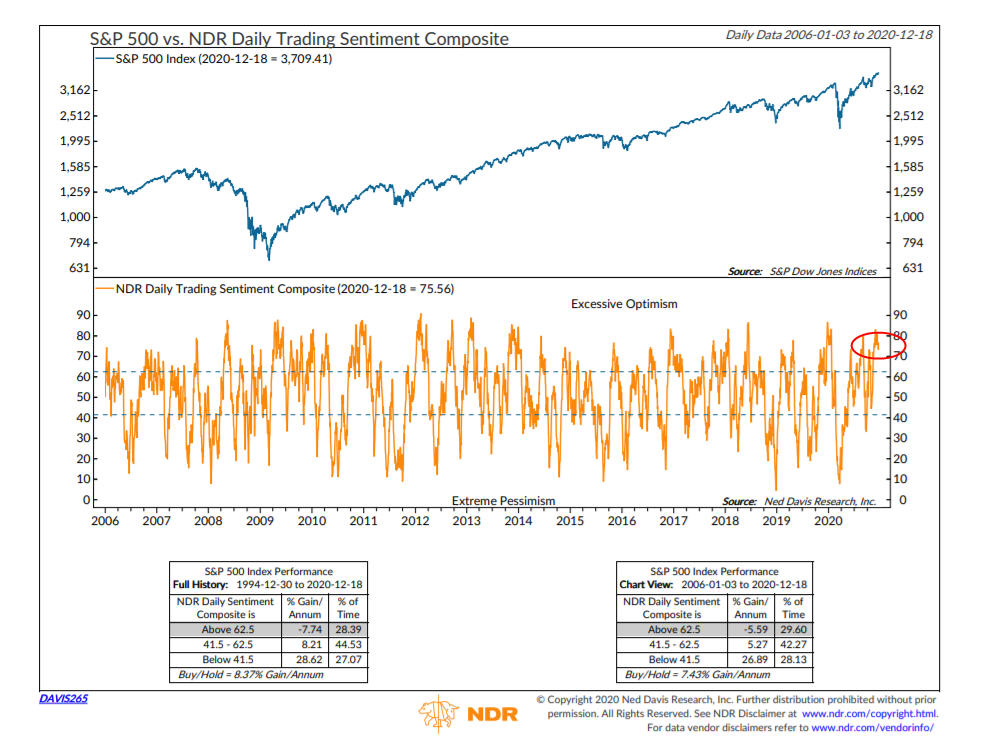
It recently peaked above 80, after having fallen below 10 during the selloff in March. Since 1994, in its current mode, the S&P 500 has hypothetically lost money at an -7.70% annual clip. In other words, this is not a time to be betting the ranch. The current level is similar to the peak in late 2019, which preceded the February/March 2020 plunge. Yet, a similar excessive level of optimism in the 2nd quarter of 2018 didn’t manifest itself into losses for several months. When everyone thinks stocks can’t go down, and it’s easy to make money, that’s the time to be on guard. That’s how it feels now.
Some Outside Voices For Context
I read a lot. Five newspapers a day, plus Barron’s on the weekend, along with several newsletters and research publications. There’s no shortage of opinions. We want to know what people are thinking, and doing, but ultimately, we need to follow our models and our process, which sometime can be flawed. Without some discipline, I’d feel lost. Below is a smattering of a few pieces we’ve seen during the last several weeks. A warning. They will come across as cautious. Just remember. Nobody can forecast accurately for long.
Vitaliy Katsenelson The Contrarian Edge
This is the most speculative behavior we’ve encountered since 1999, though it doesn’t mean that this is the peak of speculation. I don’t know how long this stage will last. It could be three months or three years. One thing I am sure about is that this is not the new normal or the forever-state of the market. Behavior that is driven by speculation and divorced from fundamentals is not sustainable and thus will end, usually in tears.
This begs another question. The Fed just announced three more years of near-zero interest rates. Does that mean this party will continue for another three years? Here is what I know: Every bubble has burst. Every single one! It is, however, much easier to spot “irrational exuberance” than its duration. Just ask Alan Greenspan, “the Maestro,” who used the term “irrational exuberance” to describe the enthusiasm that was already building in 1996 and burst four long years later.
In a speculative phase, everyone who is buying overvalued stocks is counting on a greater fool to buy even more overvalued stocks for higher prices in the future. At some point the stock market runs out of greater fools. It’s that simple.
Daniel Ivascyn, Portfolio Manager PIMCO Income Fund
The low yield environment and reach for investment returns may continue to support equity markets. But starting valuations should dim any excessive optimism. Indeed, the long-term history in Japan over decades and the shorter experience in Europe over the past few years show that there is no guarantee of outsize gains for equities over bonds, even in a very low-yield environment.
Randall Forsyth Barron’s Columnist
It’s painfully evident that generating high returns with limited losses will be vastly more complicated than simply investing in an ultralow-cost balanced fund. Will that mean lowering investors’ expectations to something more realistic, like 4% to 5% returns? Or will that drive day traders to chase the next big score with their app-driven accounts?
The surge in options trading and cryptocurrencies suggests that speculative fervor abounds—for now.
Louis-Vincent Gave Chief Executive Gavekal
Western policy makers have no choice but to embrace yield-curve controls; they can’t let interest rates go back up. You had Japan and Europe in the yield-curve control gang. The big change now is that the U.S. has joined them. Once the European Central Bank went down this path, the euro tanked. Once we are on the other side of Covid-19 and it becomes clear the U.S. has no other choice, the dollar will collapse.
Richard Thaler Professor of Behavioral Science & Economics University of Chicago
In response to the question of “which elements of behavioral economics do you find particularly relevant now?” he responded with the following.
Well, one of the most interesting things we observed in the past six months is a big increase in retail investing at the level of individual securities. My opinion, is, for individual investors to be doing that is a fool’s errand. The world has conspired to make them overconfident now, because the market’s been going up pretty steadily, and it has been going up fast in the segment of the market that retail investors have been most attracted to. So, it’s very easy to think that you’ve figured this stuff out. If you think you’ve figured it out right now, think again.
The other thing that we often point out is what we call loss aversion. People are much more sensitive to losing money than gaining. What that’s going to mean is when we do get to a correction in the stock market, we may see some overreaction. People should be wary of that, as well.
Howard Marks Oaktree Capital Management
When the pandemic hit in March, the markets went down, the risk-taking stopped, the prospective returns became high again, and very few assets were fully priced. So we turned aggressive at Oaktree. But the Fed and Treasury quickly ended that condition with monetary and fiscal stimulus. By the end of March, the markets were recovering, and now we are back to where we were a year ago—uncertainty, prospective returns that are even lower than they were a year ago, and higher asset prices than a year ago. People are back to having to take on more risk to get returns. At Oaktree, we are back to a cautious approach. This is not the kind of environment in which you would be buying with both hands.
Should You (We) Be Worried About This Chart?
With the caveat that valuation methods are terrible for timing, unless one thinks that history no longer matters because of zero to low interest rates, I can’t help but pay heed to the message from the chart below from Ned Davis Research. It displays the Price/Operating Earnings Ratio for the S&P 500 Index, going back to 1926. The 75-year average (and median) is basically 15. The current ratio is nearly double that, at 29.33.
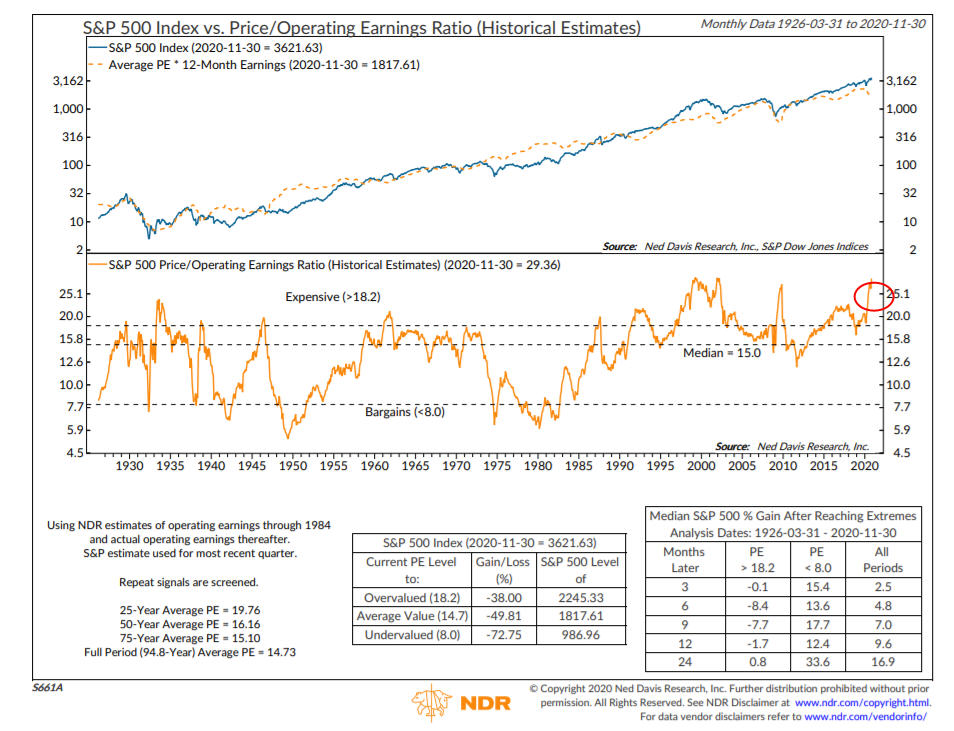
As the data in the lower left-corner shows, there’s been a definite upward trend in the ratio for the last 25 years, with that average at 19.76. Even with that elevation, though, the ratio is over 48% above that average. Or, another way of saying this is—in order for the ratio simply to revert to its average of the last 25 years, stocks would need to fall by nearly -50%. If one examines the peaks in this indicator going back in history, you’ll find that a return to the median happened EVERY time. So, yes, I expect this to happen again, but I can’t tell you when, nor why, and I’m very confident that pretty much no one else can either.
As writer and poker player Maria Konnikova recently said, “Your focus has to be on process, because that is the only think you can control. So your process has to be as good as it can possibly be. But you have to constantly revisit your process because you’re constantly growing as a person and the world is always changing.” Amen to that.
In sum, stocks are making higher highs and higher lows, and that’s the definition of a bull market. The weight of the evidence continues to support a healthy advance. But, stocks are not cheap like they were in late March. That doesn’t mean, though, that prices can’t go higher, perhaps much higher. The Federal Reserve is behind everything. A vaccine is being distributed, and perhaps by the end of May or June, as many as 200 million Americans may be inoculated. By then, maybe our economy is mostly open, and we are all doing the things we miss. Perhaps that is what the stock market foresees here. But that’s no guarantee it will go up. Perhaps the big surprise for 2021 is the economy goes berserk, and stocks go down, because they’ve already priced in the good news.
When all else fails and you are wondering how next year will be for stocks, hang your hat on this—since 1925, the stock market has gone up on a 1-year basis 73% of the time, or about 3 out of every 4 years.
Material Of A Less Serious Nature
Before I get to this month’s laugher, I want to share a link to a great video that a wonderful client recently shared with me (thank you Miss Susie!). I’m not going to give away the storyline, but will say that the older one gets, the more you’ll appreciate the message. It features none other than Clint Eastwood and Toby Keith. Enjoy it below.
A young family moved into a house, next to a vacant lot. One day, a construction crew turned up to start building a house on the empty lot. The young family’s 5-year-old daughter naturally took an interest in all the activity going on next door and spent much of each day observing the workers.
Eventually, the construction crew, all of them “gems-in-the-rough,” adopted her as a kind of project mascot. They chatted with her, let her sit with them while they had coffee and lunch breaks, and gave her little jobs to do here and there to make her feel important. At the end of the first week, they even presented her with a pay envelope containing ten dollars. The little girl took this home to her mother who suggested that she take her ten dollars “pay” she’d received to the bank the next day to start a savings account.
When the girl and her mom got to the bank, the teller was equally impressed and asked the little girl how she had come by her very own paycheck at such a young age. The little girl proudly replied, “I worked last week with a real construction crew building the new house next door to us.”
“Oh my goodness gracious,” said the teller, “and will you be working on the house again this week, too?”
The little girl replied, “I will, if those a$$holes at Home Depot ever deliver the ‘*=!@#’ sheet rock.”
Now, that’s what I call real world training!
This year has presented many challenges, hardships, and opportunities for all of us, and we are incredibly grateful for your loyalty and support. Without you, there is no TABR.
As we look to the new year, we see hope, faith and have much to be thankful for. May you and your loved ones enjoy a Merry Christmas, Happy Hanukkah and Happy New Year.
Sincerely,

Bob Kargenian, CMT
President
TABR Capital Management, LLC (“TABR”) is an SEC registered investment advisor with its principal place of business in the state of California. TABR and its representatives are in compliance with the current notice filing and registration requirements imposed upon registered investment advisors by those states in which TABR maintains clients. TABR may only transact business in those states in which it is notice filed, or qualifies for an exemption or exclusion from notice filing requirements.
This newsletter is limited to the dissemination of general information pertaining to our investment advisory/management services. Any subsequent, direct communication by TABR with a prospective client shall be conducted by a representative that is either registered or qualifies for an exemption or exclusion from registration in the state where the prospective client resides. For information pertaining to the registration status of TABR, please contact TABR or refer to the Investment Advisor Disclosure web site (www.adviserinfo.sec.gov).
The TABR Model Portfolios are allocated in a range of investments according to TABR’s proprietary investment strategies. TABR’s proprietary investment strategies are allocated amongst individual stocks, bonds, mutual funds, ETFs and other instruments with a view towards income and/or capital appreciation depending on the specific allocation employed by each Model Portfolio. TABR tracks the performance of each Model Portfolio in an actual account that is charged TABR’s investment management fees in the exact manner as would an actual client account. Therefore the performance shown is net of TABR’s investment management fees, and also reflect the deduction of transaction and custodial charges, if any.
Comparison of the TABR Model Portfolios to the Vanguard Total Stock Index Fund, the Vanguard Total International Stock Fund and the Vanguard Total Bond Index Fund is for illustrative purposes only and the volatility of the indices used for comparison may be materially different from the volatility of the TABR Model Portfolios due to varying degrees of diversification and/or other factors.
Past performance of the TABR Model Portfolios may not be indicative of future results and the performance of a specific individual client account may vary substantially from the composite results above in part because client accounts may be allocated among several portfolios. Different types of investments involve varying degrees of risk, and there can be no assurance that any specific investment will be profitable.
The TABR Dividend Strategy presented herein represents back-tested performance results. TABR did not offer the Dividend Strategy as an investment strategy for actual client accounts until September/October 2014. Back-tested performance results are provided solely for informational purposes and are not to be considered investment advice. These figures are hypothetical, prepared with the benefit of hindsight, and have inherent limitations as to their use and relevance. For example, they ignore certain factors such as trade timing, security liquidity, and the fact that economic and market conditions in the future may differ significantly from those in the past. Back-tested performance results reflect prices that are fully adjusted for dividends and other such distributions. The strategy may involve above average portfolio turnover which could negatively impact upon the net after-tax gain experienced by an individual client. Past performance is no indication or guarantee of future results and there can be no assurance the strategy will achieve results similar to those depicted herein.
Inverse ETFs
An investment in an Inverse ETF involves risk, including loss of investment. Inverse ETFs or “short funds” track an index or benchmark and seek to deliver returns that are the opposite of the returns of the index or benchmark. If an index goes up, then the inverse ETF goes down, and vice versa. Inverse ETFs are a means to profit from and hedge exposure to a downward moving market.
Inverse ETF shareholders are subject to the risks stemming from an upward market, as inverse ETFs are designed to benefit from a downward market. Most inverse ETFs reset daily and are designed to achieve their stated objectives on a daily basis. The performance over longer periods of time, including weeks or months, can differ significantly from the underlying benchmark or index. Therefore, inverse ETFs may pose a risk of loss for buy-and-hold investors with intermediate or long-term horizons and significant losses are possible even if the long-term performance of an index or benchmark shows a loss or gain. Inverse ETFs may be less tax-efficient than traditional ETFs because daily resets can cause the inverse ETF to realize significant short-term capital gains that may not be offset by a loss.
For additional information about TABR, including fees and services, send for our disclosure statement as set forth on Form ADV from us using the contact information herein. Please read the disclosure statement carefully before you invest or send money.
A list of all recommendations made by TABR within the immediately preceding one year is available upon request at no charge. The sample client experiences described herein are included for illustrative purposes and there can be no assurance that TABR will be able to achieve similar results in comparable situations. No portion of this writing is to be interpreted as a testimonial or endorsement of TABR’s investment advisory services and it is not known whether the clients referenced approve of TABR or its services.