Don’t Ignore The Inverted Yield Curve
Several months ago, the yields on shorter term debt instruments began to rise above the yields of longer term debt of the same credit profile. This is unusual, as the chart below will illustrate. This is known as an inverted yield curve, and is typically associated with recessions. Why does that matter?
Because bear markets in stocks associated with recessions inflict much more pain than bear markets that are not tied to recessions. And that is the question of the day, along with whether or not stocks are cheap enough, and if they’ve discounted most of the bad news (higher yields). We’ll tackle this and more in this month’s update, along with our take on the SEC’s new Investment Advisor Marketing Rule on testimonials.
The Treasury Yield Curve And Inversions
Normally, as one goes farther out in maturity, you are usually rewarded with higher yields, in theory partly to compensate one for tying your money up longer. The slope of a more normal curve goes from left to right, rising as you go out in maturity. But, that’s not what we have now. Below is an illustration of what we have now. The chart is courtesy of Investopedia.
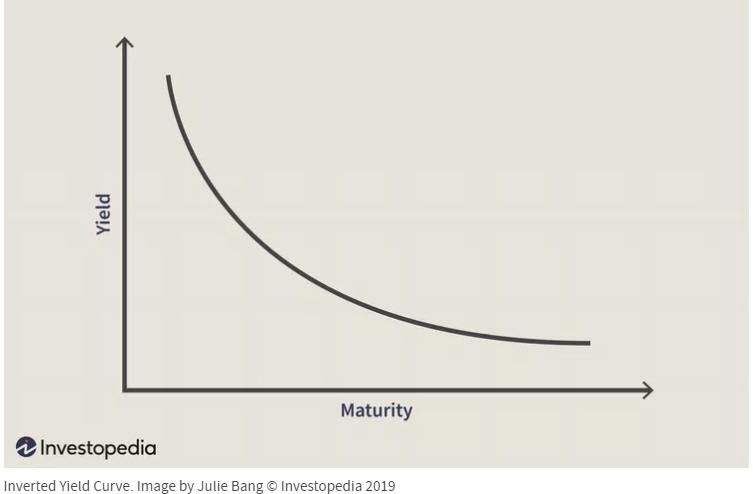
When long term bond yields drop below short term yields, it suggests that the market is becoming more negative about the economic backdrop, and inversions in the past have generally been reliable recession indicators. As a result, there is much media focus on current happenings in the bond market. There is some debate as to which combination of maturities is most effective in forecasting future economic growth and recessions. Historically, the most effective has been when the 10-year yield trades below that of the three-month Treasury rate, but many other market participants focus on the relationship between the 10-year yield and the 2-year yield. In a recent study, the Leuthold Group examined 15 different combinations going back to 1978, looking for the correlation of 4-quarter forward GDP growth, and found that the 5-year yield minus the 3-month yield was most effective. See the table below, courtesy of Leuthold Group.
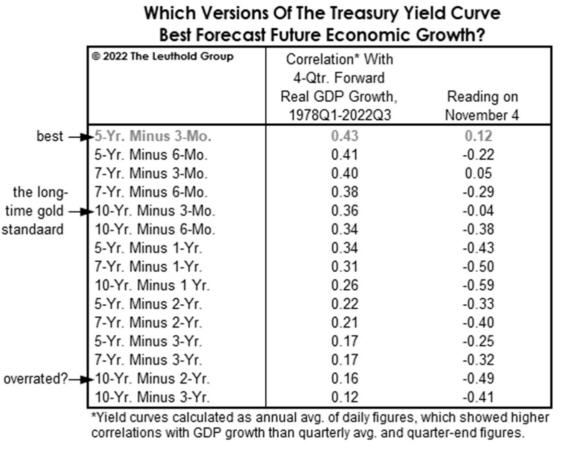
When the above table was produced, the 5-year minus the 3-month had not inverted, but that is no longer the case. Below are current yields on Treasury paper:
3 month Treasury 4.21%
6 month Treasury 4.55%
1 year Treasury 4.76%
2 year Treasury 4.42%
5 year Treasury 3.87%
10 year Treasury 3.69%
Below is a chart showing the median of the 15 measures of the Treasury Yield Curve that were analyzed above. This is also courtesy of Leuthold Group.
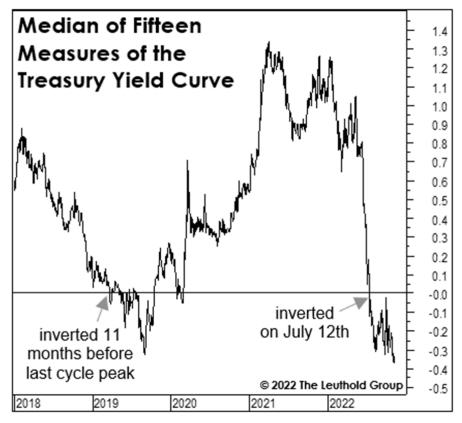
As you can see on the above chart, the majority of these measures inverted four months ago. Historically, recessions have followed ranging in time from 1 month to about 18 months. Usually, the longer the inversion, the more likely a recession. The current degree of inversions has never NOT led to a recession. With models and indicators, there is always a first time, but past history suggests betting against a recession at this point would be a low probability outcome.
Have Stocks Priced In A Recession?
On October 12, the S&P 500 closed at 3577, down over -25% from its peak on January 3. Other indexes, such as the Nasdaq 100, were down even more, off -34%. For the S&P 500, this has been the 18th worst bear market, of a total of 22, since 1929. Since the closing low of October 12, the S&P 500 has rallied 12%. Is it possible the worst is over?
The reason why the recession question is so relevant is because equity bear markets that have been associated with recessions have typically been worse in both price damage and time, according to Ed Clissold of Ned Davis Research. See the chart/table below, courtesy of www.ndr.com.
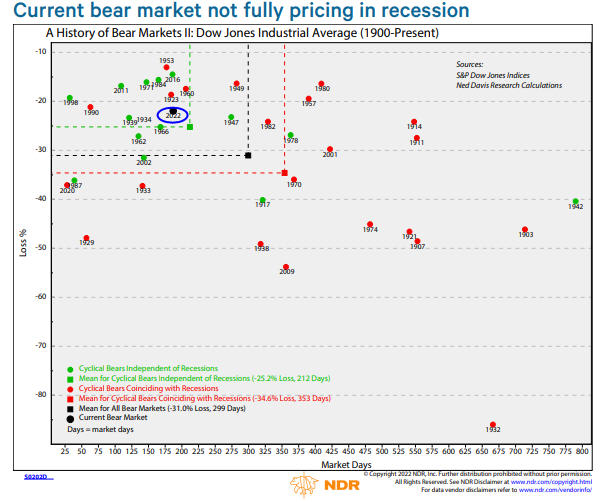
As shown above, bear markets without a recession have had mean declines of -25%, but those associated with recession have had average declines of -35%. Therefore, if there’s no recession, it’s possible the worst is behind us. With a recession though, the S&P 500 may be eventually headed to the 3000-3200 zone (it currently sits at 4026).
The stock market tends to be a leading indicator of the economy, which is why we pay more attention to the tape (how stocks are behaving) than to external indicators such as the yield curve, or rising or falling interest rates.
The Bright Side
On June 30, nearly five months ago, the yield on the 1-year Treasury Bill was 2.8%. Today, it sits nearly 200 basis points higher at 4.76%. If you knew that information in advance, you probably would have figured that stocks would have been hurt pretty bad. And, you’d be wrong. Since then, the S&P 500 has gained 6.36%, while the S&P 600 Smallcap Index is up 9.33%. The Nasdaq 100 has lagged, up 2.36%, and so have international stocks, using the Vanguard Total International Stock Index Fund, up 2.42%.
This tape action, though, suggests though that just maybe higher interest rates were already priced into the stock market. Another potentially bullish omen which I mentioned last month is the S&P 500 performance following Midterm election cycles since 1970. The forward 6 month performance has never lost money, with median gains of 18.07% compared to 4.88% median gains in all 6 month periods (data courtesy of BespokePremium.com). The big caveat with this data is there are only 13 data points, and that’s not statistically significant. But it sounds great.
Down, But Not Cheap
Since 1926, stocks have lost money in a calendar year basically once every four years. With 2019, 2020 and 2021 all up nicely, perhaps it’s not surprising that 2022 is looking to close down, potentially by double digits. Does that mean that all is good for next year, and beyond? Not necessarily. Stocks were quite expensive entering this year, by some measures more expensive than ever before. Candidly, a -25% drop doesn’t just fix everything.
For some perspective, take a look at the S&P 500 P/E Ratio using 5-year Normalized EPS (earnings per share). The chart below is also courtesy of our friends at Leuthold Group.
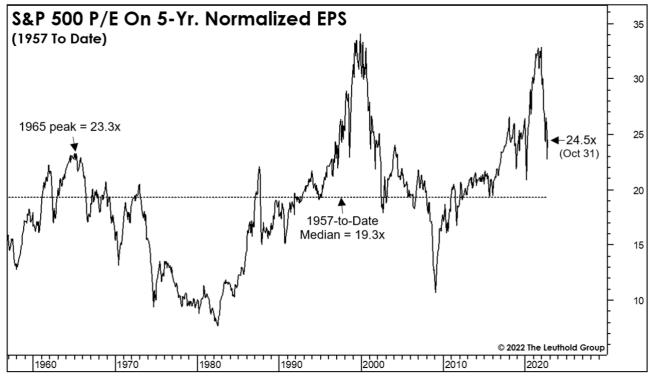
Many analysts covering companies will look at a firm’s trailing 12 months of earnings. Yale economist Robert Shiller took that idea and created his CAPE ratio (cyclically adjusted price earnings), arguing that using the past 10 years of data would more normalize readings over the business cycle. Leuthold has taken this concept and cut the 10 years in half.
Since 1957, this measure’s median has been 19.3. Last year, it reached its second-highest reading ever near 33, and has since fallen to 24.5. The approximate -25% drop is in line with the S&P 500 Index decline. Yet, just to decline to the median would be another -21% drop. And to think that in the 2007-2009 GFC (Global Financial Crisis), this ratio fell all the way to 11. This is one of several reasons we can’t get too excited about stocks for the long term from current levels. They’re just not cheap.
Coming Good News On Inflation? Did You Know Oil Is Down YTD?
On the Thursday after Election Day two weeks ago, stocks soared over 5% on the day, thanks to a better than expected monthly report on the Consumer Price Index (CPI). The next monthly report will be December 13. Though energy is only one component of the CPI, it certainly has an impact on the year-over-year comparisons. At least for those of us in California, where premium gas is still running about $5.50 a gallon, depending on where one buys, you may be surprised to know that crude oil is currently at its lowest level of the year. See the weekly chart below, courtesy of www.stockcharts.com.
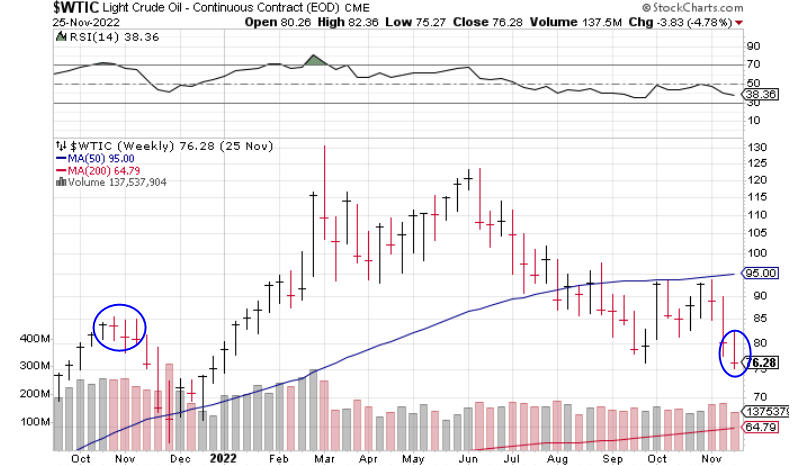
At present, crude oil is trading about -10% lower than early November 2021, and as we get into February of next year, the take-a-ways are going to be dramatic, with crude oil having traded up to the $115-130 level. Similar year-over-year comparisons for housing aren’t likely to flatten out until next June/July, when it appears that real estate peaked. The possibilities for some positive surprises on the inflation front during the next several months are very real—but the question begs—does the stock market already know this? I guess we’ll find out.
Current Portfolio Allocations And Comments
At present, our tactical portfolios are in a generally positive position. In the past several weeks, two of our five stock market risk models turned positive. Coupled with our permanent 20% floor, tactical equity exposure is up to about 55%. Plus, both our high yield bond risk model and the model we use for the PIMCO Income Fund (PIPNX) turned positive, so we’ve been fully invested in those areas for a few weeks as well. Overall, I’d call this high neutral.
There is no way to know how long this will last. There is one more inflation report this month, and on December 14, the Fed will announce its next decision, which is almost certainly a 50 basis point increase in the Fed Funds rate to the 4.25% to 4.50% level. But, the market already knows that. What the market does not know is what the monthly inflation number will be, nor how high the Fed will go.
Compared to the rally that took place this summer and peaked in mid-August, measures of market breadth have been weaker on this move from the October 12 low. The rally lacks broad participation. Unless that changes, it does not augur well for sustainability. My best guess is that stocks will hold up for a few more weeks, and then roll over to make new lows sometime in the first quarter of 2023. I give that about an 80% probability. Short-term sentiment has turned excessively optimistic, and that’s not good in a major downtrend. Remember, my guess is not necessarily better than all the forecasts out there, and importantly, has nothing to do with our process, but we know that many of you always want to know what we’re thinking.
The SEC’s Investment Adviser Marketing Rule
Back in May of this year, a new rule went into effect from the SEC that applies to registered investment advisors such as our firm. In essence, the new rule permits advisors in their marketing efforts to use testimonials from their clients, and to even pay for them, though that would have to be disclosed.
There are a number of prohibitions that govern these advertisements, and this rule has been pondered for a few years before finally being implemented. I was never in favor of the new rule, and still am not. We’re not indifferent to marketing, but paying clients for a review just seems inappropriate to me. In the early 1980s when I started in this business, I was taught that the best referrals are unsolicited. And I believe that today. Be prompt in your responsiveness, take care of the money, create an edge with your knowledge and wisdom and genuinely care about people, and you’ll always have people knocking on your door.
Retirement Plan And Gifting Limits Increased For 2023
Next year, you can give away more, and save more, than ever before. For 2023, you can give up to $17,000 per person, tax free. For retirement plans, contribution limits for traditional and Roth IRA accounts have been bumped to $6500, with the 50 years and over catch up at $1000, for a maximum of $7500. For 401 (k) and other similar plans, the new base limit is $22,500 while the catch up is bumped to $7,500, for a maximum of $30,000.
Material Of A Less Serious Nature
A journalist visiting Israel heard about a very old Jewish man who had been going to the Western Wall to pray, twice a day, every day, for a long, long time.
She watched him pray for about 45 minutes. When he turned to leave, using a cane and moving very slowly, she approached him for an interview. “Pardon me, sir, I’m Rebecca Smith, a journalist from the United States. How long have you been coming to the Western Wall and praying?”
“For about 60 years.”
“60 years! That’s amazing. What do you pray for?”
“I pray for peace between the Christians, Jews, and Muslims. I pray for all the wars and all the hatred to stop. I pray for all our children to grow up safely as responsible adults and to love their fellow man. I pray that politicians tell us the truth and put the interests of the people ahead of their own interests.”
“How do you feel after doing that for 60 years?”
“I feel like I’m talking to a f@*king wall!”
I don’t know if I’ve been naughty or nice, but as I write this, my San Francisco 49ers and Dallas Stars are sitting in first place, so I’m enjoying the journey while it lasts. I pray this finds you and your loved ones well, and wish you a Happy Hanukkah, Merry Christmas and Happy New Year. Thanks for the trust and confidence you place in all of us at TABR.
Sincerely,

Bob Kargenian, CMT
President
TABR Capital Management
TABR Capital Management, LLC (“TABR”) is an SEC registered investment advisor with its principal place of business in the state of California. TABR and its representatives are in compliance with the current notice filing and registration requirements imposed upon registered investment advisors by those states in which TABR maintains clients. TABR may only transact business in those states in which it is notice filed, or qualifies for an exemption or exclusion from notice filing requirements.
This newsletter is limited to the dissemination of general information pertaining to our investment advisory/management services. Any subsequent, direct communication by TABR with a prospective client shall be conducted by a representative that is either registered or qualifies for an exemption or exclusion from registration in the state where the prospective client resides. For information pertaining to the registration status of TABR, please contact TABR or refer to the Investment Advisor Disclosure web site (www.adviserinfo.sec.gov).
The TABR Model Portfolios are allocated in a range of investments according to TABR’s proprietary investment strategies. TABR’s proprietary investment strategies are allocated amongst individual stocks, bonds, mutual funds, ETFs and other instruments with a view towards income and/or capital appreciation depending on the specific allocation employed by each Model Portfolio. TABR tracks the performance of each Model Portfolio in an actual account that is charged TABR’s investment management fees in the exact manner as would an actual client account. Therefore the performance shown is net of TABR’s investment management fees, and also reflect the deduction of transaction and custodial charges, if any.
Comparison of the TABR Model Portfolios to the Vanguard Total Stock Index Fund, the Vanguard Total International Stock Fund, the Vanguard Total Bond Index Fund and the S&P 500 Index is for illustrative purposes only and the volatility of the indices used for comparison may be materially different from the volatility of the TABR Model Portfolios due to varying degrees of diversification and/or other factors.
Past performance of the TABR Model Portfolios may not be indicative of future results and the performance of a specific individual client account may vary substantially from the composite results above in part because client accounts may be allocated among several portfolios. Different types of investments involve varying degrees of risk, and there can be no assurance that any specific investment will be profitable
For additional information about TABR, including fees and services, send for our disclosure statement as set forth on Form ADV from us using the contact information herein. Please read the disclosure statement carefully before you invest or send money.
A list of all recommendations made by TABR within the immediately preceding one year is available upon request at no charge. The sample client experiences described herein are included for illustrative purposes and there can be no assurance that TABR will be able to achieve similar results in comparable situations. No portion of this writing is to be interpreted as a testimonial or endorsement of TABR’s investment advisory services and it is not known whether the clients referenced approve of TABR or its services.