Everything Is Different Now
I hate to tell you this, but I’m very, very happy
And I know that’s not what you’d expect from me at all
I’m not the kind to smile and bow out gracefully
I always wanted to take it to the wall
But I found somebody with a heart as big as Texas
I found an angel with the golden wings
She saw me down here in the dark somehow
And everything is different now
In the first two stanzas of Don Henley’s Everything Is Different Now, I suspect he was writing about a young lady who came along while he was in a bad place, and changed the direction of his life for the better. I’d be hard pressed to make the case that Covid-19 has made much of life better, but it’s the title that got my attention, as it’s certainly appropriate today. EVERYTHING IS DIFFERENT NOW.
In this update, we’ll be discussing what is different, election tendencies, why the overall Senate outcome is more important than the Presidential election, and we’ll revisit the old relic, gold.
What’s Different?
Back in 1993, Sir John Templeton wrote a book titled “16 Rules for Investment Success.” The most quoted passage of that tome is undoubtedly the following: “The investor who says, ‘This time is different,’ when in fact it’s virtually a repeat of an earlier situation, has uttered among the four most costly words in the annals of investing.”
In understanding financial markets, we lean on history for context, as it’s about all we have to go on. It can shape our thinking about the future. But it doesn’t mean the future will turn out like the past. As American novelist and humorist Mark Twain said, “History doesn’t repeat itself, but it often rhymes.”
Financial blogger Ben Carlson may have said it best back in a June 2017 column when he wrote, “You have to put things into perspective and realize that markets are a complex adaptive system. They’re not static and they don’t always follow preset rules.”
In the world of sports, unprecedented stuff happens seemingly every year. Remember the cheatin’ Houston Astros that nobody can boo this year because no one can attend games? Last October, they became the first team in history to lose all four home games in the World Series. So, why not financial markets?
What’s different now, that’s been part and parcel to the fastest stock market decline ever, and the subsequent fastest recovery? A few things come to mind, that I’ve summarized below:
Lowest interest rates ever
Lowest mortgage rates ever
Highest stock valuations ever (by some measures)
Unprecedented government intervention
With the Fed cutting interest rates to zero, what are the implications? That’s not actually different than the past, mind you, because they did this back in 2008/2009, and didn’t begin to raise rates until 2015. Money market yields at brokerage firms and banks are back to essentially zero, and some predict they will be there for as long as five years. What’s different this time, though, is that in 2008, the yield on the 10-year Treasury Note (see chart below courtesy of www.stockcharts.com) only declined to about 2.10%. That was still something.

This year, the yield collapsed to 0.40% and currently sits at 0.72%. That’s a big difference. And, it definitely has implications for investment portfolios. A year ago, one could earn 2% risk-free in a money market fund. That’s now zero. Interest rates in the entire bond market spectrum are lower than ever before, causing strategists to wonder if allocations to stocks and bonds will have to be forever changed?
Walk through this with me, a hypothetical exercise which isn’t really that hypothetical. Let’s say one’s target return is 4% using a balanced portfolio (50% stocks and 50% bonds). This is simplistic, as there is more to the bond market than government bonds, but let’s say all the bond exposure is in governments at 0.75%. If our target is 4%, how much does the stock portion need to earn in order to meet the goal? You’ll have to dust off your trusty math skills, but it’s 7.25%.
With even the most optimistic of stock valuation metrics suggesting 4% annual returns for the next 10 years, now you can see why investors are being forced to take risk in the bond market and the stock market to earn higher returns. If one can earn more in bonds, one can allocate less to stocks. But to earn more in bonds, you typically have to take more credit risk, such as corporate high yield (junk), and that involves greater downside risk, such as the -20% plunge in high yield bonds which took place in February/March of this year.
Likewise, if one increases the allocation to stocks in hopes of generating higher returns, you’ll have to deal with higher downside volatility, such as the -34% plunge in the S&P 500 earlier this year. This is the conundrum many are facing.
To hope that interest rates would go up from here is probably not a great bet. Certainly not the Fed Funds rate. Believe the Fed when they state they won’t be raising interest rates for a long time. That doesn’t mean that market forces can’t overwhelm the Fed. With unprecedented intervention and purchasing of bonds, many pundits think that inflation could get out of hand and the U.S. Dollar will collapse, resulting in massive gains in gold. Who knows, but keep in mind the Fed has an incentive to keep rates low. As the government borrows more and more money, the interest cost on this debt multiplies. But, one can borrow a lot more money at 0.25% than you can at 2.25%. The interest expense on multiple levels of debt can actually be lower than before, simply by financing the debt at lower and lower rates. And, that is what’s happening. And, there may be no limit to how low is low, as we’ve seen in other parts of the world.
What’s good for the government, therefore, is not necessarily good for investors (at least not debt holders). And though we’ve written about recently the lowest mortgage rates ever, and the refinancing boom, it’s important to recognize this phenomenon doesn’t help everybody either. Approximately 37% of homeowners have no mortgage. Renters certainly have no mortgage. When the cost of capital is low, it encourages behavior that otherwise would not take place when rates are higher (sort of a self-braking mechanism).
It’s important to recognize what’s different this time, more than at any time in history. Keeping the bull market going has in effect become a policy goal of the U.S. government. As investment strategist Vincent Deluard recently lamented, “the stock market, which used to be a measure of the economy, has become a policy target. As a result, it has lost its value as a measure of the real world.”
As a result, we’re now grappling with charts such as the one below, where revenues of the S&P 500 are being valued at historic levels. The chart is courtesy of Ned Davis Research (www.ndr.com).
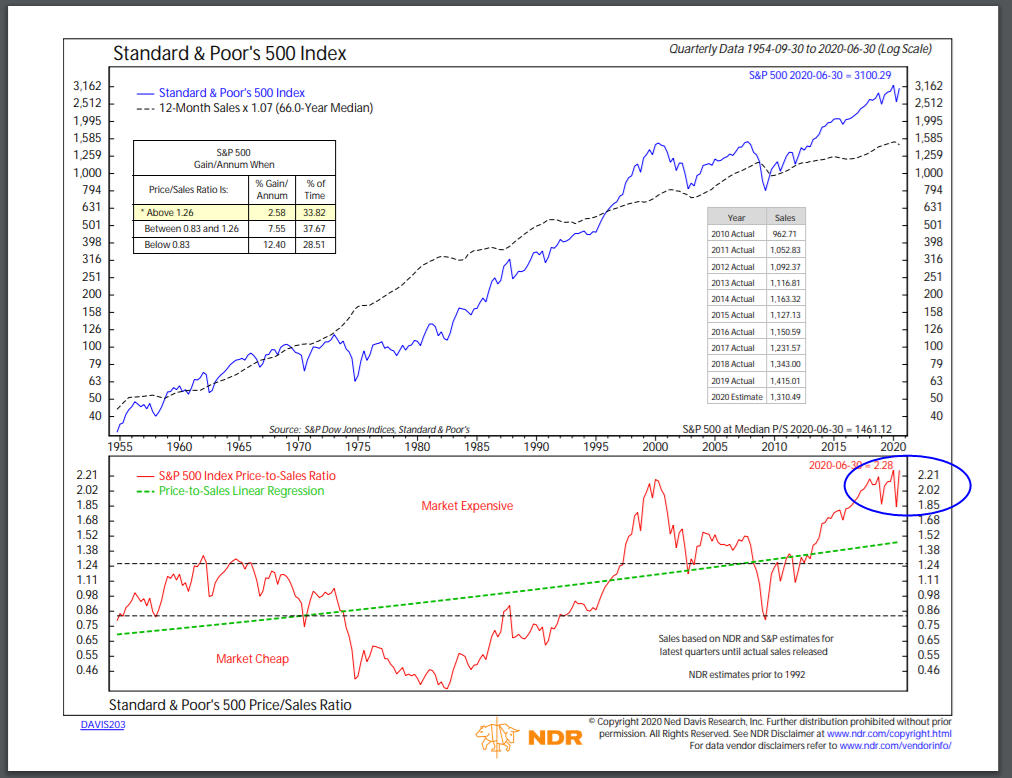
What do we make of this, though? Until about 1997, investors had never valued the index at more than about 1.26 times revenue (sales). Since then, though, that’s been the norm, with the time period 2008-2012 being the exception. Simply put, something has changed. I’m not one to defy nearly a century of market history, as I believe that all things are cyclical.
It’s very challenging, though, and important, to keep an open mind to everything. Past rules and blanket dismissals can be dangerous. I do try to remember one thing—markets may change, but people don’t. There will continue to be booms and busts, and this is why everyone should stick to an investment style that suits their own objectives and their own personality.
Election Tendencies And Why The Senate Is More Important Than Biden/Trump
Every four years, we vote to elect a President. I’m reminded of this every election year, because at least going back to 1992, it seems like we have several clients who will opine something like “if so and so gets elected, I think stocks will crash, and I don’t want to be in the market.” This has happened when Clinton won, when Obama won, and four years ago, when Trump won. And, we’re getting that same vibe now (pick your man!).
We can only combat this with data, and unfortunately, that data is not voluminous enough to be statistically significant. But, it’s all we have to go on. So, we’ll share the general conclusions we know to be true, and take it from there.
Number one, the dire predictions of disappointed voters tend not to come true. Clinton won, and stocks went up for 8 years. The same for Obama. And, as I write this with the S&P 500 trading at 3342, it has risen 56% since Trump was elected, and that doesn’t even count dividends. I’m doubtful that stocks will crash regardless of who wins in November. Rather, because of where markets are and what they’ve done, stocks are set up to perform either below average or poorly, so whoever gets elected will probably be blamed. I always remember a note from financial writer Morgan Housel, who listed this under Things That Cause Permanent Blindness—“unshakeable political beliefs that influence investment decisions.”
What we do know is that the last president to not run for reelection when he could was Lyndon Johnson in 1968, and the last president to lose a reelection bid was George H.W. Bush in 1992. According to Ned Davis Research (NDR), trends have been amplified under Republicans, with “the strongest gains coming when incumbent Republicans have won and the biggest losses when incumbent Republicans have lost, on average.”
NDR went on to find that since 1900, the incumbent party has won three times and lost eight when there was either a 20% decline in the Dow Jones Industrial Average or a recession in the election year. We’ve had both in 2020, so those odds are not in favor of Trump retaining his residency. In addition, no president has been reelected with a June 30 approval rating as low as Trump’s. Perhaps the most effective indicator we’ve discovered is simply the performance of the stock market in the three months leading up to the election—August, September and October. Since 1928, this indication has been correct 87% of the time in predicting the outcome (19 of 22). An up market has signaled the incumbent party will win, while stock market losses have tended to predict an opposition party win.
On July 31, the S&P 500 stood at 3271, so the jury still has nearly two months to write the script. Currently, markets are above the July month-end figures, but results can be fleeting. Stocks have declined nearly -7% in the last three days after establishing an all-time high at 3580 on September 2. And, I’m not sure the polls will be any help. The website FiveThirtyEight, which focuses on opinion poll analysis, politics, economics and sports blogging, currently shows that Biden has a 71% probability of winning the election, with Trump at 28%, based on 40,000 simulations. For those of you who remember Statistics class, I would strongly emphasize the word Probability. These numbers may change as we approach the first few days of November, but I find it ironic that today, the odds of Biden winning the election, also according to FiveThirtyEight, are exactly 71%, with Trump again at 28%. Deja vu?
Finally, though I realize the question of Biden/Trump seems to get all the attention, I would suggest that the more important election is who wins the Senate? At present, Congress is gridlocked, with the Democrats controlling the House of Representatives, while Republicans control the Senate. At least for markets, history suggests a gridlocked Congress is best, regardless of which party is the president. It seems to provide a check and balance, and one would hope, an incentive to work together, though that doesn’t seem plausible today, does it? Given that the numbers imply Democrats will not likely lose control of the House, but the lead of Republicans for the Senate is more tenuous, it is more probable that Senate control will decide if change in 2021 is more centrist or radical.
Let Freedom Ring
Just a couple of weeks after civil rights leader and congressman John Lewis passed away in July, the New York Times published an op-ed that he’d written shortly before his death. Below I’ve reproduced two of the paragraphs that were especially moving.
“Ordinary people with extraordinary vision can redeem the soul of America by getting in what I call good trouble, necessary trouble. Voting and participating in the democratic process are key. The vote is the most powerful nonviolent change agent you have in a democratic society. You must use it because it is not guaranteed. You can lose it.
“Though I may not be here with you, I urge you to answer the highest calling of your heart and stand up for what you truly believe. In my life I have done all I can to demonstrate that the way of peace, the way of love and nonviolence is the more excellent way. Now it is your turn to let freedom ring.”
There you have it. No matter your preference, apply the famous NIKE slogan. Just do it. Vote.
My Presidential Alternative
I suspect that many of you may be in the quandary I am in. Being totally transparent here, I really don’t like either Presidential candidate. So, imagine my giddiness when the following appeared on my Instagram feed a couple of months ago.

For those of you not into professional football, Jimmy Garoppolo and George Kittle are two of the best players on my San Francisco 49ers, who narrowly lost the Super Bowl to Kansas City in February (yes, it pains me to write that). Jimmy is the QB and George is the tight end, perhaps the best in the NFL. Just imagine the ammunition you could have by voting for Jimmy & George. No matter who your friends are and who they voted for, you could then say, “No way that Jimmy & George would screw up the country like your guy!”
Revisiting Gold
Back in 2014, we eliminated gold stocks via a mutual fund from all of our portfolios, an area that we’d started using back around 1988. Briefly, we had much success trading rapidly from 1988 to around 2000, but then it seems markets changed with respect to the model we’d be using. It was a price-based model, and because we had to reduce the frequency of our trades, we had to switch methodologies. Despite the run-up in the price of gold from 2002 to 2011, followed by a big decline, our approach, which mostly focused on the ratio between the price of gold and that of gold stocks, really didn’t perform as well.
At that time, given that we couldn’t find anything in our research that we were happy with, we decided it best to eliminate it, and move those assets back to our stock market allocation. That was a good decision, in hindsight, as the price of gold went nowhere from early 2014 until June of 2019, but has risen about 35% since then, beating the stock market during the last 14 months or so (but not for the last 6 years).
Gold has a long history as a safe haven, and can invoke emotions (good and bad) on investors. Some people think the world is crazy, and think of gold as a hedge against this craziness. Other’s claim it’s protection against unlimited government spending and inflation, even though the record shows gold has a mixed record in this regard. One of the big reasons some investors favor gold is because its price has been largely independent of other asset classes (non-correlated if you will). It’s also traditionally been used as protection against weakness in the U.S. Dollar.
I will say this–in the last two biggest stock market declines (2008 and 2020), gold and government bonds have been the only asset classes that have held their own. Everything else went down. So, its reputation as an insurance policy has some validity in that respect. But, as seemingly almost all markets have started to correlate on the downside together, it is fair to question if this will continue.
Remember, gold does not pay any dividends, so you’re only going to make money when it goes up. It’s pure market psychology, and what people are feeling. But, other factors do come into play. One is changes in the real (inflation-adjusted) yield of government bonds. When Treasury real yields fall, as they have in the past 12 plus months, gold prices tend to climb. All in all, though, it’s not easy to value gold, like one can the bond market or stocks.
Below is a chart comparing the number of ounces of gold needed to the buy the median priced existing home. This is courtesy of my friend Doug Ramsey at The Leuthold Group.
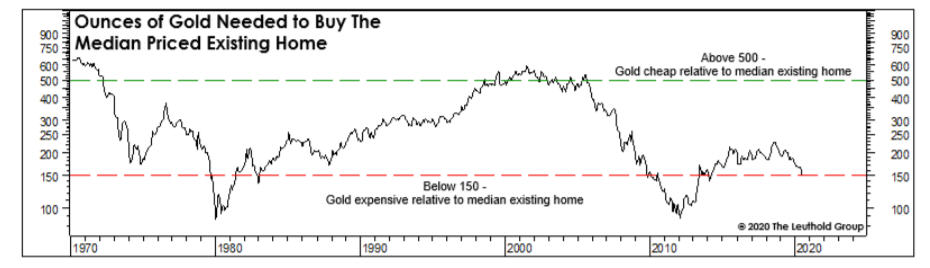
Ramsey indicated this idea came from the late Paul Macrae Montgomery, a financial market analyst who developed some quirky, yet effective indicators such as the Magazine Cover Indicator, and it’s the best valuation metric he’s seen when it comes to analyzing gold.
We’ve recently become more intrigued with gold, given the actions of the Federal Reserve Board. The Fed is doing things they’ve never done before, and none of us know the consequences. We’ve come to view gold as a stock market alternative, and this was reflected in our recent research, attempting to find a trend-following approach we could be comfortable with. As a buy and hold asset, owning gold will take you through long periods of underperformance compared to stocks. That is the case even with the model we’ve tested, in where the first iteration is you go to cash when the model is on a Sell signal. Instead, we’ve found it would be better to go into stocks when the model is negative for gold. Alas, the stock market alternative. We certainly don’t view gold as a core holding.
But, at this stage, we think viewing it as in insurance policy makes a lot of sense, and are in the process of adding it back to be a part of our equity allocations. It will make up 10% of our equity pie, so currently that will equate to 4% for Conservative accounts, 5.5% for Moderate accounts and 7% for Aggressive accounts. I want to stress we will not be buying and holding. Nope. I can’t say I was smart enough to think of this in January of 2019, shortly before the model we’ve tested gave a BUY signal which it is still on. That would have been heroic, as the model hadn’t made any money for 5 years on Buy signals—money was hypothetically made on the SELL signals because in those modes, the money would have been in stocks, which have been going up.
To counter any foreboding I have in doing this, remember, we have a model to get us out and attempt to minimize downside volatility. This actually reminds me a bit of 2006 with real estate, when I discovered that it might be a good idea to add it as a portfolio diversification component. This was AFTER real estate (using liquid REIT funds) had been going up for five years. I sensed we were late to the party. So, we only established a small position, and sure enough, our model gave a SELL in 2007/08, and the REIT we were using (IYR) went from 90 to 27.
Are we late to the party with gold? I don’t know, but I do know that if the world is going crazy, and gold goes from $1900 to $3000 per ounce, I’d like to have some exposure in our allocations. If, on the other hand, this turns out to be a major top and gold drops from $1900 to $1000, we won’t be sitting idly by. Given the status of our model and current sentiment towards gold, we’re not implementing a full allocation right away, but rather using my “least regret” approach where we’ll establish a 50% position, and then look to get to “fully invested” when sentiment indicators are perhaps more supporting.
Current Portfolio Allocations
For over two months now, our equity allocations have remained unchanged at around 83%, as four of our five stock market risk models remain in positive mode. However, with stocks declining nearly -7% in the last few days, that could change in the coming week. Our model for high yield bond funds has been positive since July 27, but high yield has begun to weaken as well. Should the trends continue the remainder of this week, we could see some defensive shifts rather quickly. This is the nature of trend following. I could not have told you stocks would have advanced this far. And, at some point, too far, is, well, too far and a retreat begins. It’s possible the stock market may have made a major top last week. We’ll know more in coming weeks, and as our models change, so will our exposure.
Material Of A Less Serious Nature
A white haired man walked into a jeweler’s shop late one Friday, with a beautiful young lady at his side. “I’m looking for a special ring for my girlfriend,” he said. The jeweler looked through his stock, and took out an outstanding ring priced at $5,000. “I don’t think you understand. . . .I want something very unique,” he said. At that, the jeweler went and fetched his special stock from the safe. “Here’s one stunning ring at $45,000.”
The girl’s eyes sparkled, and the man said that he would take it. “How are you paying?” “I’ll pay by check, but of course you would want to make sure everything is in order, so I’ll write a check and you can phone the bank tomorrow, and then I’ll get the ring on Monday.”
Monday morning a very angry jeweler phones the man. “You bastard, you lied. There’s no money in that account.”
“I know,” piped the man, “but can you imagine what a fantastic weekend I had?”
Despite what we can and cannot do, or what we should and should not do, here’s hoping you’re having good weekends while we all navigate this new world we’re all attempting to cope with. Some day, this will all be history, but right now, we’re all living through it. Mental toughness is imperative.
What will NFL football feel and sound like this week? We’re about to find out. I’m just as excited about the hockey playoffs as I’ve ever been, as my dream/nightmare is getting close to reality, with my Dallas Stars just three victories away from playing for the Stanley Cup. But nothing is quite the same without people there, as it will always be.
Thank you for your continued trust and confidence in all of us at TABR.
Sincerely,

Bob Kargenian, CMT
President
TABR Capital Management, LLC (“TABR”) is an SEC registered investment advisor with its principal place of business in the state of California. TABR and its representatives are in compliance with the current notice filing and registration requirements imposed upon registered investment advisors by those states in which TABR maintains clients. TABR may only transact business in those states in which it is notice filed, or qualifies for an exemption or exclusion from notice filing requirements.
This newsletter is limited to the dissemination of general information pertaining to our investment advisory/management services. Any subsequent, direct communication by TABR with a prospective client shall be conducted by a representative that is either registered or qualifies for an exemption or exclusion from registration in the state where the prospective client resides. For information pertaining to the registration status of TABR, please contact TABR or refer to the Investment Advisor Disclosure web site (www.adviserinfo.sec.gov).
The TABR Model Portfolios are allocated in a range of investments according to TABR’s proprietary investment strategies. TABR’s proprietary investment strategies are allocated amongst individual stocks, bonds, mutual funds, ETFs and other instruments with a view towards income and/or capital appreciation depending on the specific allocation employed by each Model Portfolio. TABR tracks the performance of each Model Portfolio in an actual account that is charged TABR’s investment management fees in the exact manner as would an actual client account. Therefore the performance shown is net of TABR’s investment management fees, and also reflect the deduction of transaction and custodial charges, if any.
Comparison of the TABR Model Portfolios to the Vanguard Total Stock Index Fund, the Vanguard Total International Stock Fund and the Vanguard Total Bond Index Fund is for illustrative purposes only and the volatility of the indices used for comparison may be materially different from the volatility of the TABR Model Portfolios due to varying degrees of diversification and/or other factors.
Past performance of the TABR Model Portfolios may not be indicative of future results and the performance of a specific individual client account may vary substantially from the composite results above in part because client accounts may be allocated among several portfolios. Different types of investments involve varying degrees of risk, and there can be no assurance that any specific investment will be profitable.
The TABR Dividend Strategy presented herein represents back-tested performance results. TABR did not offer the Dividend Strategy as an investment strategy for actual client accounts until September/October 2014. Back-tested performance results are provided solely for informational purposes and are not to be considered investment advice. These figures are hypothetical, prepared with the benefit of hindsight, and have inherent limitations as to their use and relevance. For example, they ignore certain factors such as trade timing, security liquidity, and the fact that economic and market conditions in the future may differ significantly from those in the past. Back-tested performance results reflect prices that are fully adjusted for dividends and other such distributions. The strategy may involve above average portfolio turnover which could negatively impact upon the net after-tax gain experienced by an individual client. Past performance is no indication or guarantee of future results and there can be no assurance the strategy will achieve results similar to those depicted herein.
Inverse ETFs
An investment in an Inverse ETF involves risk, including loss of investment. Inverse ETFs or “short funds” track an index or benchmark and seek to deliver returns that are the opposite of the returns of the index or benchmark. If an index goes up, then the inverse ETF goes down, and vice versa. Inverse ETFs are a means to profit from and hedge exposure to a downward moving market.
Inverse ETF shareholders are subject to the risks stemming from an upward market, as inverse ETFs are designed to benefit from a downward market. Most inverse ETFs reset daily and are designed to achieve their stated objectives on a daily basis. The performance over longer periods of time, including weeks or months, can differ significantly from the underlying benchmark or index. Therefore, inverse ETFs may pose a risk of loss for buy-and-hold investors with intermediate or long-term horizons and significant losses are possible even if the long-term performance of an index or benchmark shows a loss or gain. Inverse ETFs may be less tax-efficient than traditional ETFs because daily resets can cause the inverse ETF to realize significant short-term capital gains that may not be offset by a loss.
For additional information about TABR, including fees and services, send for our disclosure statement as set forth on Form ADV from us using the contact information herein. Please read the disclosure statement carefully before you invest or send money.
A list of all recommendations made by TABR within the immediately preceding one year is available upon request at no charge. The sample client experiences described herein are included for illustrative purposes and there can be no assurance that TABR will be able to achieve similar results in comparable situations. No portion of this writing is to be interpreted as a testimonial or endorsement of TABR’s investment advisory services and it is not known whether the clients referenced approve of TABR or its services.