Flatlining
The stock market’s behavior in the last 45 days or so since mid-July reminds me of an electrocardiograph that we’ve all seen in the hospital (or on TV). Not so much the steady rhythm of a regular heartbeat, but rather that ominous visual of a flatline when the patient expires.
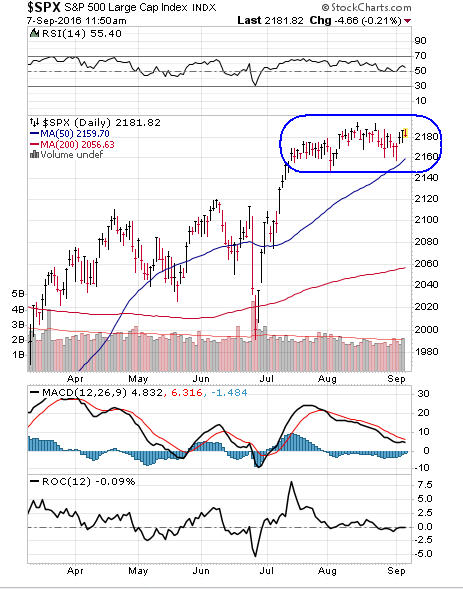
I’m not implying the stock market is terminal in any way. Hardly. Rather, it’s just to convey that large company stocks have gone mostly nowhere since July 15. Witness—on July 15, the S&P 500 stood at 2161. On August 1 it was 2170, and was also at 2170 on September 1.
You can see this visually on the chart below, courtesy of www.stockcharts.com.
In fact, it has been 41 days since the index has risen or fallen more than 1%. What does this quiet period portend? That’s hardly definitive, but my observations of past markets suggest one should ask, “what is the trend?” For the most part, that has been up since mid-February, so I would expect that eventually this narrow range of trading will eventually be resolved to the upside.
I’d also be remiss in noting that small stocks have hardly been comatose—the Russell 2000 index has gained 3.8% since July 15. Foreign equities have been equally as strong, with the Vanguard Total International Index fund up 4.09% in the same period.
Investment Allocations
Given this placid environment, it’s not surprising that there has been little change in our various risk models, or allocations. Stock exposure in TABR’s tactical accounts remains at about 65% of its maximum, plus another 5% in real estate (less in Conservative and more in Aggressive accounts).
Our high yield bond risk model remains positive, still on a February 29 BUY signal and confirming new highs in the stock market.
All in all, the overall technical evidence has to be considered moderately bullish. As noted from last month’s update featuring breadth thrusts, downside corrections are likely to be limited in scope until support on the S&P 500 at the 2130 level is decisively violated.
Something to Watch—The Dow Transports
I often cite divergences in indicators, both positive and negative, to give clues about market risk. One such process is called Dow Theory, which was formulated in a series of editorials in the Wall Street Journal back in 1900 by Charles Dow.
There’s no set of formal rules, which makes it impossible to test, but in general, the underlying trend of the market (up or down) is said to be in sync if both the Dow Jones Industrial Average and the Dow Jones Transportation Average are confirming each other.
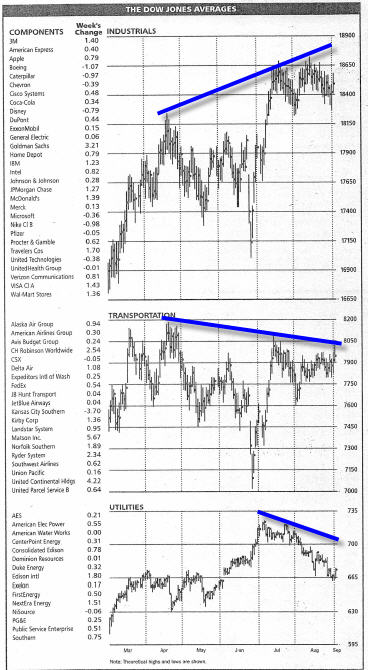
When they’re not, it can be a warning for a change in the trend. Below are daily charts of the Industrials, Transports and Dow Jones Utilities indexes, reproduced from the latest issue of Barron’s.
On a shorter term basis, the Industrials made a new high in mid-August, while the Transports peaked in mid-April, and the Utilities in early July. A similar negative divergence took place last May when the Industrials peaked, while the Transports had peaked in December 2014. This eventually led to the intermediate correction that culminated in February’s low.
The Dow Jones Utilities are not part of Dow Theory, but can be helpful too. The longer these non-confirmations continue, the more likely the Industrials will eventually be dragged down. At present, though, this divergence is being offset by a new high in the daily advance/decline line, as well as new highs in corporate high yield bond prices.
Borrowing From Your IRA
This inquiry has come about several times in the past 8 months from different clients, so I thought I’d write about it briefly.
Basically, you cannot borrow money from an IRA and pay it back. Period. Loans are permitted from many 401 (k) plans, if the plan document allows them, but this is not possible with an IRA.
One may WITHDRAW money from an IRA, and put it back within 60 days, which is called a rollover, and you’re allowed to do one of these during a 12-month period, no matter how many IRA accounts you may maintain.
If you withdraw money from an IRA, and don’t put it back within the 60 day period, you’ll be taxed on the amount of the draw, and also assessed a 10% federal penalty if you are under 59 1/2.
Remember, a distribution (withdrawal) and subsequent rollover isn’t considered a loan, although some have incorrectly referred to it as such.
Material of a Less Serious Nature
As a bagpiper, I was asked by a funeral director to play at a graveside service for a homeless man who had no family or friends. The funeral was held at a cemetery in the remote countryside and this man was the first to be laid to rest there.
As I was not familiar with the backwoods area, I became lost and being a typical man, did not stop for directions. I finally arrived an hour late and I saw the backhoe and the crew who were eating lunch, but the hearse was nowhere in sight.
I apologized to the workers for my tardiness and stepped to the side of the open grave where I saw the vault lid already in place. I assured the workers I would not hold them up for long, but this was the proper thing to do. The workers gathered around, still eating their lunch and I played out my heart and soul.
As I played, the workers began to weep. I played and played like I’d never played before, from “Going Home” and “The Lord Is My Shepherd,” to “Flowers Of The Forest.” I closed the lengthy session with “Amazing Grace” and walked to my car.
As I was opening the door and taking off my coat, I overheard one of the workers saying to another, “Sweet Jee-zuz, Mary’n Joseph, I never seen nothin’ like that before, and I’ve been putting in septic tanks for twenty years.”
All of us at TABR are grateful for the trust and confidence you express in us daily.
Sincerely,
Bob Kargenian, CMT
President
TABR Capital Management, LLC (“TABR”) is an SEC registered investment advisor with its principal place of business in the state of California. TABR and its representatives are in compliance with the current notice filing and registration requirements imposed upon registered investment advisors by those states in which TABR maintains clients. TABR may only transact business in those states in which it is notice filed, or qualifies for an exemption or exclusion from notice filing requirements.
This newsletter is limited to the dissemination of general information pertaining to our investment advisory/management services. Any subsequent, direct communication by TABR with a prospective client shall be conducted by a representative that is either registered or qualifies for an exemption or exclusion from registration in the state where the prospective client resides. For information pertaining to the registration status of TABR, please contact TABR or refer to the Investment Advisor Disclosure web site (www.adviserinfo.sec.gov.).
The TABR Model Portfolios are allocated in a range of investments according to TABR’s proprietary investment strategies. TABR’s proprietary investment strategies are allocated amongst individual stocks, bonds, mutual funds, ETFs and other instruments with a view towards income and/or capital appreciation depending on the specific allocation employed by each Model Portfolio. TABR tracks the performance of each Model Portfolio in an actual account that is charged TABR’s investment management fees in the exact manner as would an actual client account. Therefore the performance shown is net of TABR’s investment management fees, and also reflect the deduction of transaction and custodial charges, if any.
Comparison of the TABR Model Portfolios to the Vanguard Total Stock Index Fund, the Vanguard Total International Stock Fund and the Vanguard Total Bond Index Fund is for illustrative purposes only and the volatility of the indices used for comparison may be materially different from the volatility of the TABR Model Portfolios due to varying degrees of diversification and/or other factors.
Past performance of the TABR Model Portfolios may not be indicative of future results and the performance of a specific individual client account may vary substantially from the composite results above in part because client accounts may be allocated among several portfolios. Different types of investments involve varying degrees of risk, and there can be no assurance that any specific investment will be profitable.
The TABR Dividend Strategy presented herein represents back-tested performance results. TABR did not offer the Dividend Strategy as an investment strategy for actual client accounts until September/October 2014. Back-tested performance results are provided solely for informational purposes and are not to be considered investment advice. These figures are hypothetical, prepared with the benefit of hindsight, and have inherent limitations as to their use and relevance. For example, they ignore certain factors such as trade timing, security liquidity, and the fact that economic and market conditions in the future may differ significantly from those in the past. Back-tested performance results reflect prices that are fully adjusted for dividends and other such distributions. The strategy may involve above average portfolio turnover which could negatively impact upon the net after-tax gain experienced by an individual client. Past performance is no indication or guarantee of future results and there can be no assurance the strategy will achieve results similar to those depicted herein.
For additional information about TABR, including fees and services, send for our disclosure statement as set forth on Form ADV from us using the contact information herein. Please read the disclosure statement carefully before you invest or send money.
A list of all recommendations made by TABR within the immediately preceding one year is available upon request at no charge. The sample client experiences described herein are included for illustrative purposes and there can be no assurance that TABR will be able to achieve similar results in comparable situations. No portion of this writing is to be interpreted as a testimonial or endorsement of TABR’s investment advisory services and it is not known whether the clients referenced approve of TABR or its services.


