For Whom Does The Bell Toll (Brothers, That Is), And Is The Bull Market Over?
If you’re like me, it’s probable you’ve heard the phrase “For Whom The Bell Tolls,” but perhaps don’t have a clue as to its meaning. It came from an expression in a sermon by John Donne, an English poet and cleric in the Church of England. Donne says that because we are all part of mankind, any person’s death is a loss to all of us.
And what does this have to do with the stock market? Well, Toll Brothers is one of the nation’s largest home builders, with a reputation for quality and upscale models. Home Building stocks have had a recent tendency to lead the market at major tops. So, if there is “death” to Toll Brothers, and other home construction companies, it’s bad news for the entire market.
As you’ll see, the picture is ominous. Which begs the question, given the sharp declines of the last few weeks in stocks, is the Bull Market over?
We’ll touch on that, in depth, with our best wisdom, along with a note on the Social Security COLA as well as the Social Security tax increase you really haven’t read about. As always, we’ll end with some humor, because, well, sometimes we need it!
Toll Brothers—Another Housing Peak?
In 2016, Toll Brothers, whose most important market is California, earned $2.16 per share. This was followed by a 45% jump in 2017 to $3.17 per share. And, with one quarter to go, the company is expected to earn $4.50 in 2018, up over 41%. So, why is the stock down -42% since January 22, if earnings growth is so important?
It’s because the market is looking forward, not backward, and is telling us that the news can’t get any better. This is very similar to the Consumer Confidence polls, which have been showing the highest level of optimism in 18 years. That’s not a positive. The market also peaked 18 years ago in March 2000, and subsequently dropped over -45% based on the S&P 500 Index, and nearly -76% for the NASDAQ.
Take a look at the monthly chart of Toll Brothers below (courtesy of www.stockcharts.com), which goes back to 2005.
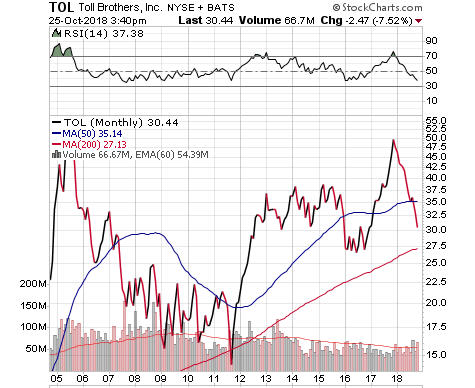
By the time stocks had peaked in the summer and fall of 2007, Toll Brothers was in free-fall from its peak in 2005, warning of what was to come. Just as stock market valuations are showing one of the most expensive markets in history, similar messages are coming from the real estate market. It has to do with affordability and the cost of money.
Housing prices in many areas of the country have recently been at their highest levels ever. As a result, housing affordability has hit a 10-year-low, just as mortgage rates have risen to their highest level in more than seven years. Consider the following—a year ago, one could have taken out a 30-year fixed rate mortgage at 3.75% on a $500,000 loan and the payments for principal and interest would have been $2315 per month.
That same mortgage today would be 4.9%, and the payments would be $2653, or over $338 per month higher, translating into a $4056 annual increase. As we have been arguing for a couple of years, if asset prices in real estate and stocks have been elevated because of cheap money and virtually zero interest rates as orchestrated by the Fed, as the cost of money goes higher, the prices of these assets should in fact go down.
According to a September Seattle Times article, Seattle home prices dropped $45,000 in one month, as that very hot market has cooled off. And, according to a CNBC September report, home sellers are slashing their prices, especially in California. Why? Because all of a sudden, the psychology is changing.
Two weeks ago, I had the opportunity to visit and spend about 4 hours at the offices of PIMCO, the top flight fixed income investment manager based in Newport Beach, CA. I’d arranged for all of the students in the Titan Capital Management program at Cal State Fullerton to hear some presentations from PIMCO’s management and HR divisions and learn about the opportunities at the firm.
During the visit, one of the PIMCO managers had talked about their internal housing models, which had helped them to warn about the dangers back in 2006 and allowed PIMCO to navigate that time period much better than most. I was curious as to what their thinking is right now about housing. I found it interesting that they cited some fundamentals in that there is a massive shortage of housing nationwide, and they feel housing is going to remain strong for several years.
Personally, I don’t agree. There may be a shortage, but that doesn’t mean that the houses being built are affordable. Everything is expensive historically, whether it be stocks or real estate, and I think the price action in housing stocks such as Toll Brothers and others, along with steel and construction companies is telling us that the best news is behind us, and the market cycle has peaked.
Is The Bull Market Over?
The only correct answer to the above question is—we’ll only know it in hindsight. But I will say we are seeing enough deterioration in our indicators to suggest that stocks may have peaked. The “typical” process of a market top is to have small companies lead the way down, with large companies being the last to go. That’s happening. What also is happening is a global bear market, that is just now beginning to show up in the U.S. stock market.
After the January 2018 top, the declines were fairly symmetrical, with the S&P 500 falling -10.1%, the Russell 2000 small cap index down -9.01% and the Vanguard Total International Stock Index dropping -9.42%. But, we’ve now seen divergences which began in late July when the Vanguard fund peaked. It is down -12.3% from its peak, while the S&P 500 has dropped -9.35%. Meanwhile, the Russell 2000 peaked on August 31 and is down -15.6%.
In a table of country ETFs provided by Pension Partners, with data through October 11, only 5 out of 45 countries were showing positive equity returns.
With each peak in the U.S. market, we’ve seen less participation across the board. To illustrate this, look at the chart below, courtesy of www.dorseywright.com. It represents the NY Bullish Percent, which is the percentage of stocks on the NYSE on point and figure Buy signals.
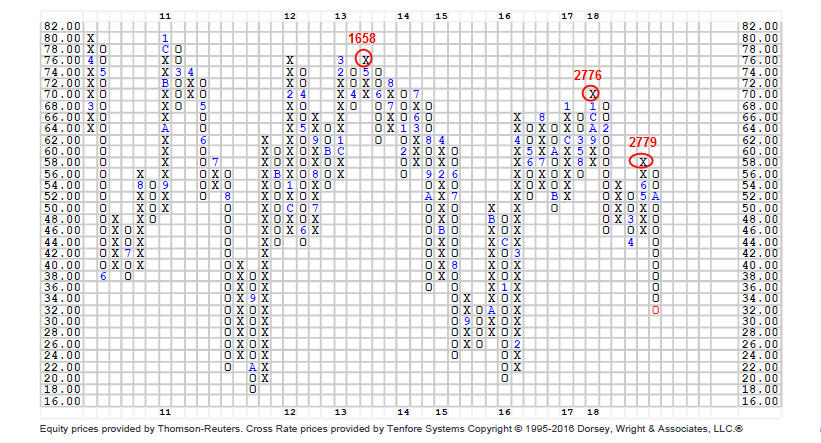
In May of 2013, this indicator reached 76% when the S&P 500 Index was at the 1658 level. Then, in January 2018, with the S&P 500 at 2776, the Bullish Percent was at 70%. This was only a slight divergence. But in June 2018, with the index essentially at the same level of 2779, the BP could only manage a 58% reading. And, it was even worse in September when the index ultimately peaked at 2930. With the decline of the past several weeks, the indicator now resides at 32%. Stocks begin to get oversold on an intermediate term basis when the indicator drops below 30%, and true washout conditions take place with it under 20%.
We noted in last month’s update about upcoming favorable seasonality coupled with mid-term election tendencies. Anything is possible with the stock market, so one more rally into early next year to final highs could certainly occur, but one of the things that give us pause on counting on “one more rally” is that two prominent technical analysts, John Murphy of stockcharts.com and Walter Murphy (no relation), are both suggesting that their interpretation of Elliott Wave theory indicates that the entire bull market from March 2009 is now complete. If that turns out to be correct, stocks could drop between -30% and -40%, minimum, in retracing either 38% or 50% of the entire advance.
What We’re Doing
The bottom line right now is that all stock indexes, domestic and international, are trading below their respective 200-day moving averages. We are seeing long-term indicator breakdowns in a number of our risk management models.
For stock market exposure, equity allocations have been at 50% since May. By November 1, we could be down to as low as 12% invested, depending on the reading of a monthly model we use. One of the four remaining bullish stock models have just turned bearish, so early next week our equity allocations will be down to 38%, with 63% sitting in cash.
My best guess based on the action of the past couple of weeks is that stocks are completing a first leg down right now. Sentiment is growing bearish (which is good), and coupled with favorable seasonality which kicks in at the turn of the month, there should be a decent retracement of the recent decline. We don’t think stocks will go back and make new highs, but one of the technical research services we follow, Lowry’s Reports, does. Who knows? It is possible, but how stocks react to the January lows around 2550 to 2580 on the S&P 500 will determine the next few months. Longer term chart patterns are becoming quite negative.
On the fixed income front, our high yield bond risk model has been on a BUY since August 27, but it has also generated a SELL, so the vast majority of that capital will be moved to short term bond funds early next week.
In sum, the majority of the evidence we follow is negative, for the first time in over two years. It is possible that a major cycle peak has occurred. We don’t know. There is simply no way to know how long a bear market may last, or how deep it may fall. But, we are in capital preservation mode now, not a money making mode. This is our process, and our discipline. In a bear market, the surprises will come to the downside. Maybe this turns out to be a garden variety -20% decline. Who knows? But, maybe we see another -50% down like 2008.
My point is, we don’t need to know. When the evidence begins to turn more positive, it will eventually show up in our work, and we will begin to add back exposure. Now is not that time. I have learned to stay away from forecasts and predictions, and just speak the truth. These comments may cause a number of you to inquire to us if you should be making any changes. That answer is no—our process is dynamic. If one is a Moderate investor, you don’t all of a sudden become a Conservative one because our work is turning negative.
However, I do have some comments for investors who have passive strategies and accounts (we even have a small amount at TABR for clients who want to be more aggressive). This includes many who have 401 (k) plans at their workplace. This also applies to investors who have large positions in individual stocks and are handcuffed because they don’t want to pay capital gains taxes. Make sure you fully understand exactly how much pain you can take. The stock market is a wonderful wealth builder over the long term, as long as one sticks with it. But that could mean losing -50% of one’s equity capital during a decline. Remember, passive (or buy and hold) investors do nothing, no matter what. It’s not our cup of tea, but for many it is. Just make sure your stomach is made of cast iron and your retirement plans won’t blow up if it happens. Because it could. Don’t leave the kitchen after it’s already on fire.
One last point—passive investing has become all the rage. The focus on lowering expenses is absolutely beneficial. My opinion is, that in the next 10 years, traders and active investors are going to do much better than passive, the exact opposite of the past 10.
The Social Security Tax Increase And COLA for 2019
A couple of weeks ago, the Social Security Administration announced that tens of millions of recipients will receive a 2.8% increase in benefits next year, the largest cost-of-living adjustment since 2012. It amounts to $39 per month for the average retired worker, according to estimates from the SSA.
What didn’t get hardly any attention, and certainly no headlines, was the tax increase that will affect nearly 12 million workers. Social Security is financed by a 12.4% tax on one’s wages, half paid by workers and the other half by employers. Next year, the maximum amount of earnings subject to the Social Security tax will increase from $128,400 to $132,900. That equates to an extra $279 per worker.
So, if you earn at least $133,000, you’re getting a tax increase next year. With the Social Security trust fund due to run out of money in about 13 years, my fear is that Congress is going to try and fix the problem by eliminating the cap on these taxes, much as has already happened with Medicare.
Such a move would be a massive tax hike on high earning individuals. Just think if you are earning $350,000 a year, and somehow Congress passes such a bill. You’d be paying an extra $13,450 than you are currently. The more you earn, the more they take.
Material Of A Less Serious Nature
A husband and wife were driving through Louisiana. As they approached Natchitoches, they started arguing about the pronunciation of the town. They argued back and forth, then they stopped for lunch. At the counter, the husband asked the waitress, “Before we order, could you please settle an argument for us? Would you please pronounce where we are very slowly?”
She leaned over the counter and said, “Burr-gerrr Kiiing.”
No doubt there is strong interest in the World Series in Southern California, with the Dodgers in the mix for the second year in a row. Last night, I stayed up until 12:30 am watching Game 3, which turned out to be the longest game in World Series history, over 7 1/2 hours long. The Dodgers haven’t won in 30 years, and so do the Angels have bragging rights, since they won in 2002? I’m not so sure. Is it better to have loved and lost, than to have never loved at all? I think it’s the former. Besides, the Angels haven’t even had a DATE for six years. And 2019 doesn’t look much better. Kudos to Justin Turner and Dylan Floro, two former Fullerton Titans who are helping the Dodgers, and playing quite well. What a dream.
Meanwhile, please don’t bring up my 49ers. They have me in sports hell.
Sincerely,

Bob Kargenian, CMT
President
TABR Capital Management, LLC (“TABR”) is an SEC registered investment advisor with its principal place of business in the state of California. TABR and its representatives are in compliance with the current notice filing and registration requirements imposed upon registered investment advisors by those states in which TABR maintains clients. TABR may only transact business in those states in which it is notice filed, or qualifies for an exemption or exclusion from notice filing requirements.
This newsletter is limited to the dissemination of general information pertaining to our investment advisory/management services. Any subsequent, direct communication by TABR with a prospective client shall be conducted by a representative that is either registered or qualifies for an exemption or exclusion from registration in the state where the prospective client resides. For information pertaining to the registration status of TABR, please contact TABR or refer to the Investment Advisor Disclosure web site (www.adviserinfo.sec.gov).
The TABR Model Portfolios are allocated in a range of investments according to TABR’s proprietary investment strategies. TABR’s proprietary investment strategies are allocated amongst individual stocks, bonds, mutual funds, ETFs and other instruments with a view towards income and/or capital appreciation depending on the specific allocation employed by each Model Portfolio. TABR tracks the performance of each Model Portfolio in an actual account that is charged TABR’s investment management fees in the exact manner as would an actual client account. Therefore the performance shown is net of TABR’s investment management fees, and also reflect the deduction of transaction and custodial charges, if any.
Comparison of the TABR Model Portfolios to the Vanguard Total Stock Index Fund, the Vanguard Total International Stock Fund and the Vanguard Total Bond Index Fund is for illustrative purposes only and the volatility of the indices used for comparison may be materially different from the volatility of the TABR Model Portfolios due to varying degrees of diversification and/or other factors.
Past performance of the TABR Model Portfolios may not be indicative of future results and the performance of a specific individual client account may vary substantially from the composite results above in part because client accounts may be allocated among several portfolios. Different types of investments involve varying degrees of risk, and there can be no assurance that any specific investment will be profitable.
The TABR Dividend Strategy presented herein represents back-tested performance results. TABR did not offer the Dividend Strategy as an investment strategy for actual client accounts until September/October 2014. Back-tested performance results are provided solely for informational purposes and are not to be considered investment advice. These figures are hypothetical, prepared with the benefit of hindsight, and have inherent limitations as to their use and relevance. For example, they ignore certain factors such as trade timing, security liquidity, and the fact that economic and market conditions in the future may differ significantly from those in the past. Back-tested performance results reflect prices that are fully adjusted for dividends and other such distributions. The strategy may involve above average portfolio turnover which could negatively impact upon the net after-tax gain experienced by an individual client. Past performance is no indication or guarantee of future results and there can be no assurance the strategy will achieve results similar to those depicted herein.
Inverse ETFs
An investment in an Inverse ETF involves risk, including loss of investment. Inverse ETFs or “short funds” track an index or benchmark and seek to deliver returns that are the opposite of the returns of the index or benchmark. If an index goes up, then the inverse ETF goes down, and vice versa. Inverse ETFs are a means to profit from and hedge exposure to a downward moving market.
Inverse ETF shareholders are subject to the risks stemming from an upward market, as inverse ETFs are designed to benefit from a downward market. Most inverse ETFs reset daily and are designed to achieve their stated objectives on a daily basis. The performance over longer periods of time, including weeks or months, can differ significantly from the underlying benchmark or index. Therefore, inverse ETFs may pose a risk of loss for buy-and-hold investors with intermediate or long-term horizons and significant losses are possible even if the long-term performance of an index or benchmark shows a loss or gain. Inverse ETFs may be less tax-efficient than traditional ETFs because daily resets can cause the inverse ETF to realize significant short-term capital gains that may not be offset by a loss.
For additional information about TABR, including fees and services, send for our disclosure statement as set forth on Form ADV from us using the contact information herein. Please read the disclosure statement carefully before you invest or send money.
A list of all recommendations made by TABR within the immediately preceding one year is available upon request at no charge. The sample client experiences described herein are included for illustrative purposes and there can be no assurance that TABR will be able to achieve similar results in comparable situations. No portion of this writing is to be interpreted as a testimonial or endorsement of TABR’s investment advisory services and it is not known whether the clients referenced approve of TABR or its services.