How To Earn 4% In A Sub-2% World, Growth & Value, Losing 27% In One Day, And Estate Planning Blunders
A year ago at this time, the yield on the 10-year Treasury Note was 3.14%, and one was actually earning about 2.2% on money market funds at brokerage firms that were competitive.
This ushered in a near -20% drop in the S&P 500 Index during last year’s fourth quarter, as Mr. Market responded by saying, “Sorry, the market cannot support interest rates at that level.”
Today, we’re in a very different landscape. The yield on the 10-year Treasury Note has dropped to 1.78%, the Fed has lowered the Fed Funds rate three times from 2.25% to 1.50%, and now, money market funds are yielding in the 1.50% to 1.65% range. Stocks in general have responded favorable to the fall in rates, with the S&P 500 currently making new all time highs, along with the NASDAQ, whereas other indexes such as small companies and international equities still remain below their January 2018 highs.
As we’ve suggested in earlier monthly commentaries, many longer term valuation indicators are suggesting low single-digit returns going forward for periods of up to 10 years, while bond yields are near their lowest levels in history. The “high” in high yield bond yields is around 5.5%. We’ve probably updated over 100 financial plans in the past year for clients. For inflation, we start with a 3% assumption and go down from there, realizing that inflation is barely running at 2%. For returns, most of the projections we use are in the 3% to 3.5% range, implying REAL returns (after inflation) of either zero, or 0.5%. Remember, a 0.5% REAL return is also represented by earning 2.5% in nominal returns with 2% inflation. Believe it or not, the vast majority of our clients are in pretty good shape, even with these conservative assumptions.
Let’s face it, though. Though no one knows the future, we can be pretty certain that stocks are unlikely to repeat in the next 10 years the double-digit annualized returns they have experienced from 2009 to 2019. And the difference between earning 2% on your money versus 4% could be the difference in a good retirement or a great retirement. But, how do you do that when we appear to be in the late stages of this market cycle? We’ll attempt to answer that below, along with some other thoughts.
The TABR Dividend Stock Strategy
In August 2014, we unveiled research on a new strategy we were about to roll out which focused on S&P 500 companies with a combination of high dividend yields and high earnings yields. We were able to take the study back to the beginning of 1973, with the help of Ned Davis Research.
We were motivated by a few things. First, historical evidence shows that dividend payers over time are superior to non-dividend payers. Second, we wanted to present something that was easy to understand and that could be used to deliver cash flow that would likely be superior to other alternatives. An investment strategy that results in a growing, spendable cash stream provides investors with a better understanding of the relationship between their portfolio and future income goals.
In our back-testing, which covered the 41 years from 1973 to 2013, the strategy had a hypothetical edge of over 400 basis points annually, net of fees, compared to buying and holding the S&P 500. This was compelling, but I can’t say we were focused at that time on the income stream. Dividend investing is often a trade-off between yield and growth. The higher the yield, the slower the growth, and vice versa. In addition, a portfolio of dividend stocks is different from a broad market portfolio or benchmark, and it will perform differently for any given period. You’ll see this in the data below, and the recent performance of value stocks in comparison to growth stocks.
I should also point out the myth that dividend stock investing is conservative, or perhaps “safer” than other strategies. In our back-testing, the maximum drawdown of the fully invested strategy was over -60%. That’s no different than simply buying and holding the S&P 500 Index. Every client we showed the work to told us they liked the concept, but the worst case losses were too much to handle. As a result of this feedback, we modified our approach to add some risk management, using four of our stock market risk models, each with a 15% weight. If all four risk models were in a negative mode, equity exposure would be reduced to 40%, the minimum floor we will maintain. The cash is kept in the PIMCO Short Term Fund. At present, the strategy is 100% invested in stocks.
We now have just over five years of real-time data to look back on, and see how things are progressing.
| S&P 500 (VFINX) | TABR Dividend Stock | Annual Income | |
| 2014* | 4.60% | 8.38% | N/A |
| 2015 | 1.25 | -9.09 | $3,688 |
| 2016 | 11.82 | 13.34 | $3,478 |
| 2017 | 21.63 | 12.8 | $4,049 |
| 2018 | -4.52 | -5.34 | $4,902 |
| 2019** | 23.1 | 9.46 | $5,317 (estimate) |
| Compound Return | 10.9 | 5.37 |
*for the period 9/29/2014 to 12/31/2014
**for the nine months ended 09/30/2019 annual income estimate based on actual 9 months of dividends plus extrapolated fourth quarter
Some Observations
The cynic in you might say, “I would have been better off just owning the S&P 500. It had double the return.” That is absolutely true, but misses several earlier points. Various factor strategies perform Different than the market, with periods of underperformance and outperformance. As you’ll see in the sections below, Growth stocks have been beating Value stocks for the past 12 years, but this will not go on forever. Plus, high-yielding dividend paying stocks are the cheapest they’ve been in nearly 20 years, based on the chart below, courtesy of Ned Davis Research.
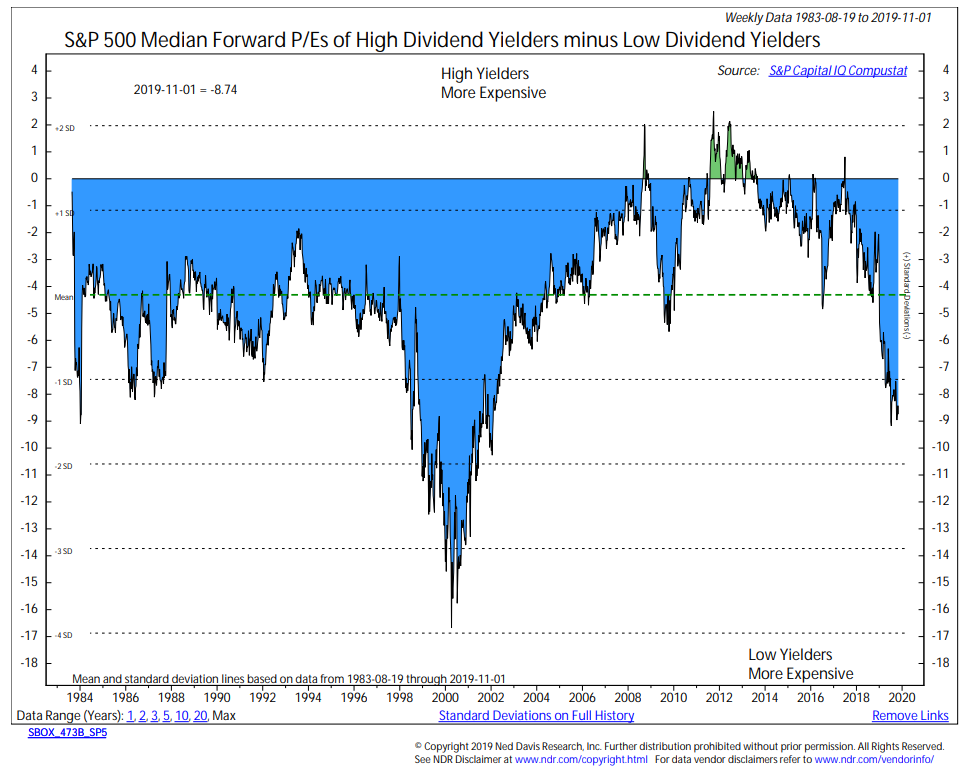
According to NDR, the median P/E ratio of the highest quartile (25%) of S&P 500 Dividend Payers relative to the median P/E of the lowest yielders is near its lowest level since January 2002. Dividend stocks are as cheap as they were in 2016 on an asset class basis, but unlike 2016, they are cheap relative to other stocks. In other words, this is looking like a good time to initiate strategies in this area.
Our original investment of $102,000 is now worth over $133,000, and income has increased 44% from the first full calendar year, providing a yield on initial capital of 5.21%. Currently, the average yield on the 27 stocks in the portfolio is 4.46%, and importantly, the growth rate of the dividend income is at 9.6% annually. Sure, no one can guarantee that the dividend income will continue to grow at that pace.
I’ve often used real estate rental properties as a comparison to investing in the dividend strategy. In my own mind, there’s very little comparison except in the analogy of the concept. Both have an asset that is throwing off cash flow. Full disclosure before I go on. I’m biased. I’m comfortable with the capital markets, and therefore, owning individual companies. I’m not comfortable owning rental properties. Why? Because of the long term evidence.
Data on real estate investing is not nearly as accurate as on stock market indexes, nor does it exist going back to the 1920s, when most accurate stock market research begins. But, in the studies available, stocks have compounded at nearly twice the rate of real estate. Advantage # 1. Second, do you know of anyone who owns rental properties (without leverage), where their rental income is growing over 9% annually? Advantage # 2.
Third, how many people own rental properties where the net annual expenses to maintain the property are less than 1.1% per year? Property taxes alone exceed that, not to mention maintenance, insurance, and other issues. Advantage # 3. Finally, if you want or need to sell your rental property, how many of you can sell it for nothing? Yes, I said nothing. That’s not a typo. Last I looked, if you had a rental property worth $500,000, the real estate broker would charge at least 5% to sell the property. That’s $25,000. Yes, I know, the buyer of real estate theoretically pays nothing, and the seller pays the cost, so it works out to 2.5% on each side. But, the bottom line is, on a purchase and sale, your buying/selling expenses are $25,000 in this example.
In contrast, if we need to sell off an entire portfolio of the 27 dividend paying stocks we own in TABR’s Dividend Strategy, the trading cost is zero. Granted, this is only a recent phenomenon since Fidelity Investments a few weeks ago announced they were eliminating brokerage commissions on all equity trades, joining Schwab, TD Ameritrade and others (more on that development in an upcoming monthly update). But even before this took place, trading commissions online were only $4.95, which were down from $7.95 a few years ago. And before that, I believe they were at $14.95 per trade. Multiply that number by 27 and you get $404. That’s a heck of a lot less than $25,000. Advantage # 4.
The bottom line is, if one wants to earn 4% in a sub-2% world, a dividend-paying stock strategy can be a great solution from a number of angles, especially if one can deal with the mental aspects of downside volatility, drawdowns and has a long term time horizon (like retirement!).
Growth & Value
One of the primary reasons dividend-paying stocks have been lagging the S&P 500 during recent years is that growth stocks have been performing much better than value stocks since approximately 2007. This is best illustrated in the two charts below, which are courtesy of James Stack and his excellent newsletter, InvesTech Research.
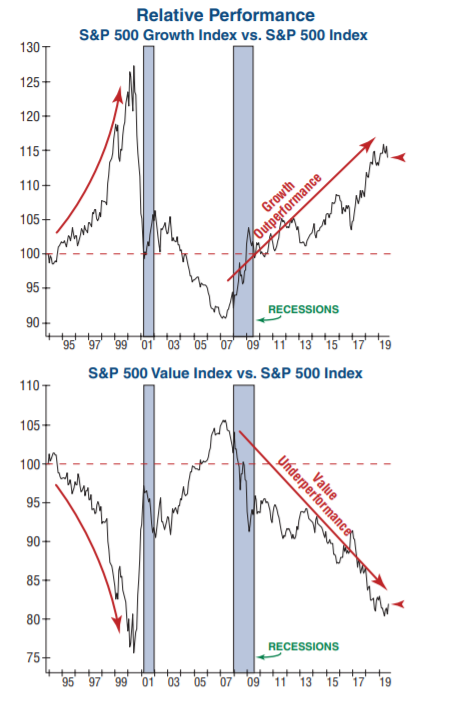
The charts show the relative performance of the S&P 500 Growth Index and the S&P 500 Value Index in comparison to the S&P 500 Index. The Growth Index bottomed in 2007 and has been rising ever since, in virtual contrast to the Value Index. But, no trend lasts forever. You can see that it was the exact opposite between 2000 and 2007, when Value soared and Growth plummeted. Given the chart above that shows the highest yielding stocks are the cheapest in nearly 20 years, we believe the outperformance of Growth stocks is likely nearing an end. If so, this would be a tailwind for dividend stock strategies.
Coping With Drawdowns, And Losing 27% In One Day
One of the biggest impediments for many individuals who invest in the stock market is the downside volatility. It’s one thing to tell someone that over long periods of time, stock indexes have compounded at about 10% annually. Sign me up, they say, especially since no other asset class is even close. But when you add the tidbit about having to sit through periods where you may temporarily lose 30% to 50% of your capital, the line to sign up gets quite a bit shorter. We’re all human, and most of us are not wired for dealing with that kind of downside risk.
Yet, if one commits to the buy and hold approach that many in the industry espouse, it’s part of the deal. At some point during a 10 or 20-year period, stocks will go down significantly. And, yes, they have always come back in the United States, but you never know how long that will take. Maybe it’s a few years, like after 2008, or maybe it’s more like 15 years like after 1929-32. You never know. Which is why we favor using an approach which incorporates risk management.
If you can widen your time horizon, and start thinking in years (at least 5, I’d say) rather than weeks or months, the noise will be a lot easier to deal with, and one’s portfolio results will likely be stronger, simply because you’re in stocks. As mentioned above, being fully invested in dividend stocks is not conservative. They went down nearly -60% in the 2007-2009 bear market, just as much as owning the S&P 500 Index. But let me illustrate three recent examples that I think can be helpful in the context of using this strategy.
Our portfolio of dividend-paying stocks has been mostly fully invested since mid-February of this year. The account hit a peak value on July 24 of $137,828. Then, in barely over a month, it plunged -14.7% in value to $117,510 by August 27, as value stocks got clobbered. Finally, by September 13, just 17 days later, it had gained 15.3% from the low, recovering to $135,553. During this same period of decline and recovery, the S&P 500 Index fell just -4.98%, then recovered +4.81%. You can see that owning individual stocks is typically much more volatile than owning an index. I think the lesson here, though, is to not get caught up in the short term moves, the daily noise, or even weekly noise. In this example, had you looked at your account in early July and not again until early September, you would have seen a flat line.
You might ask, how did the portfolio hold up during last year’s fourth quarter, when the S&P 500 declined -19.77% from September 20 to December 24? In that period, the portfolio lost just -9.64%, mostly because it was only 40% invested as a result of our risk management models being in a negative mode.
Finally, I want to illustrate an extreme example of the downside. Earlier this year, one of our portfolio holdings was Kraft Heinz (KHC), the maker of ketchup, cheese, and many other food products. Look at the chart below, courtesy of www.stockcharts.com.

In mid-February (see circle), a bad earnings announcement came out, and in one day, the stock plunged -27%. Yes, and we owned it. Because we equal-weight our holdings and they are rebalanced on the first day of each quarter, this position represented about 3.7% of the account, and the loss on that day caused about a -1% loss of capital on the overall account. So, not only have we lived to tell about it, the overall account is earning a decent return, despite this. The stock was eventually sold on April 1, when it no longer passed our screening criteria.
Just know when owning stocks of this nature, it is common for us to see daily gains and losses from individual holdings that can exceed +15% or -15% or more. It is part of the process. Looking at the chart above, it might be an obvious question to ask, “why did you buy this stock in the first place, since it appears it was in an obvious downtrend, having traded above $70 back in December 2017?”
Ironically, though we rely heavily on technicals and quantitative data in managing our tactical stock and bond allocations, the Dividend Stock strategy does not consider technical analysis in its selection process. It is certainly something we’ve thought about, along with using some other fundamental screens that might help us eliminate some of the inevitable clunkers that come along. It’s a matter of having enough data so the back-testing procedure is robust enough to be relied upon, while also trying to keep the process simple enough so that almost anyone could understand the rationale. Sticking to a proven process when it is not doing well is one of the things that must be done to be successful in investing.
Name That Beneficiary, And Other Estate Planning Blunders
I will be 62 this coming Saturday, November 9. I’d like to think I’m in pretty good shape. Most weeks, I run about two miles 5 out of 7 days, and add a jump rope regimen I created many years ago. This so I can eat bacon, pancakes, potatoes, bread, pasta, steak and chicken, among other foods, on a fairly regular basis, and still maintain my weight just below 170 lbs. But, who knows? A few days ago, my brother had a stroke at the age of 65. It appears to be fairly mild. But, our Dad had two strokes, and his mother had a severe one late in her life, though she lived to be 89. This does not mean I will have a stroke someday. Yes, there are some genetics there, but I believe more will be determined by what I do, and my attitude.
But, again, who knows? Many of you locally in Orange County have no doubt eaten a meal at JT Schmid’s Brewery, which is located directly across the street from the Honda Center, where the Anaheim Ducks play. Their founder, Jason Schmid, was a former college athlete and a couple of weeks ago, suddenly died of a heart attack at the age of 54. Which leads me to this piece on estate planning, and why we do it.
This year, we’ve had several clients pass away. This is normal, and our team has become very good at helping surviving spouses and family put everything together and deal with all of the paperwork and requirements that are inevitably tied to brokerage and retirement accounts, pensions, Social Security, life insurance and the like.
What happened earlier this year, though, was out of our control, since we were not handling the accounts, and we thought we’d share the story, in hopes that it would save someone the pain we’ve endured along with our clients in solving the problem.
Our client’s father passed away in February of this year, and they had five accounts at various financial institutions. All of the money was in a Family Trust registration except for a small IRA of about $36,000 in the father’s name. Our client’s mother was the primary beneficiary of the IRA. Our client has one brother. But, neither of them was named as a contingent beneficiary. In fact, no one was named a contingent beneficiary. And, then, their mother passed away in June.
So, instead of dealing with a normal, non-spousal inherited IRA situation, which is easily handled with death certificates, we had to get an attorney involved who was working with our client to draft documents that showed he and his brother were in fact successor co-trustees of their parents’ trust. We wanted to transfer the IRA to an Estate Beneficiary IRA and get it closed out, given the small size. I am saving some of the details here for space reasons, but suffice to say the entire process of dealing with two of the financial institutions who had some of the accounts has likely been our worst experience ever in this area. The amount of paperwork, medallion signature guarantees and requirements have been absurd. I’m risking some karma here, too, since we don’t yet have the assets transferred, and maybe something else will happen, but some of the pain could have been avoided had the advisor handling the accounts made certain that contingent beneficiaries were named.
For some other estate planning blunders to avoid, I thought you’d like the piece below by our friend, Bob Veres.
Common Estate Planning Pitfalls
Estate planning is complicated. There are a lot of moving parts to organizing your finances and determining where they will go after your death. And in many cases, people simply sign a stack of documents at their attorney’s office and think the job is done.
The result? A lot of mistakes, a lot of people falling into estate planning pitfalls. Here are a few that you should try to avoid.
1) Naming the wrong executor. These are the people who are appointed to take legal control over the assets when you pass away. Executors collect all the assets of the deceased, pay final debts and expenses, and file federal and state estate tax returns (if needed). Unfortunately, it is not uncommon for the named executor, years after the documents have been signed, to be deceased or no longer suited for the position because he/she is too elderly. If a professional is named, is the attorney or CPA still in business? Meanwhile, children who were too young to serve when the documents were signed may now be capable of taking on the executor role.
Solution: periodically check to see who has been named as the executor in the estate documents. Is that still appropriate?
2) Not updating documents to reflect the maturity and financial conditions of the children. Estate planning documents that were created when children were young will have named a guardian, but when the children reach maturity, that would no longer be necessary. The document may leave assets to trusts on behalf of the children, when it makes more sense to distribute them directly to the adults they have become. And in some cases, an unequal distribution of assets might make sense, if one adult child has become financially successful while others are struggling. Finally, when children are minors, they typically don’t need health care powers of attorney, living wills or advance health care directives. Once they become adults, they should consider having these documents in their own right.
Solution: check to see the provisions in your will or trusts that relate to the children, and update as necessary.
3) Inappropriate health care directives. Under the Health Insurance Portability and Accountability Act, every individual’s medical records and other personal health information is confidential, meaning it cannot be shared with anyone, including family members, without written authorization. Lack of this information and specific directives could impede decision-making by others when you’re incapacitated or approaching the end of your life.
Solution: check and update your family’s health care powers of attorney, living wills and advanced health care directives.
4) Inappropriate estate tax provisions. In 2019, individuals are legally permitted to transfer assets valued at $11.4 million ($22.8 million for married couples) free of federal estate and gift taxes. But outdated estate documents might include planning that was appropriate for much lower exemption values—for example, forcing a trust for the heirs to be funded up to the applicable exclusion amount, which might impoverish the surviving spouse.
Solution: review the formulas in the estate documents with your attorney and/or tax professional.
5) Estate documents drafted in a state where you no longer reside. Every state has its own estate and income tax laws; some are common law property states while others are drafted with community property laws. There can be significant differences between them when it comes to transferring assets. Moreover, 17 states also impose some form of estate or inheritance tax, with different exemption amounts. Some estates that would not be subject to a federal estate tax might be subject to state estate taxes. If your documents were drafted in a different state from where you currently reside, they could be outdated and misapplied.
Solution: review your estate plan to see if it is still appropriate, with an eye toward reducing state estate taxes and making sure they reflect your current residency.
6) Not utilizing portability. The federal estate rules say that a surviving spouse can take advantage of any unused portion of the spouse’s exclusion amount. But that’s only true if the estate files a federal estate tax return within nine months of the deceased’s passing. (This can go up to 15 months if an extension is granted.) In the normal case where the deceased’s estate would not have to pay estate taxes, often nobody realizes that the federal estate tax return (showing zero taxes have to be paid) has to be filed. This can be costly in some larger estates, where the second spouse dies with more than $11.4 million in wealth.
Solution: Some families set up a credit shelter, bypass, family or exemption trust that would be funded with assets from the first spouse’s estate. That preserves not only the portability of those assets, but any growth in those assets would not be counted in the estate tax calculation. The surviving spouse could also disclaim part of the deceased’s assets, allowing them to pass to the children. Or the executor of the estate can file the federal estate tax return, preserving the portability of $11.4 million of additional estate tax exemption.
7) Failing to plan for capital gains taxes. Most estates will never pay a federal estate tax, which means that the tax planning should be concentrated on income tax planning. One important consideration is the step-up in basis for appreciated assets, which means that, for the heirs, the capital gains tax obligation on the amount of appreciation during the deceased’s time of ownership will vanish. This is the closest thing to a free lunch, in the tax world, that you can get.
Solution: Save some highly-appreciated assets like legacy stock positions and shares of the family business from the normal rebalancing and diversification activities, and pass them on to heirs.
https://www.fidelity.com/viewpoints/wealth-management/estate-planning-common-pitfalls
https://kauffmanwm.com/avoiding-pitfalls-in-financial-planning/
Keep An Open Mind. Price/Operating Earnings Ratio Is At The 25-year Average
Don’t get me wrong. Stocks are expensive by many measures, and we appear to be in the late stages of the cycle. But, when I saw the chart below from Ned Davis Research, it took me back to the thoughts that perhaps some paradigms have shifted in the last 25 to 30 years in regard to valuation indicators.
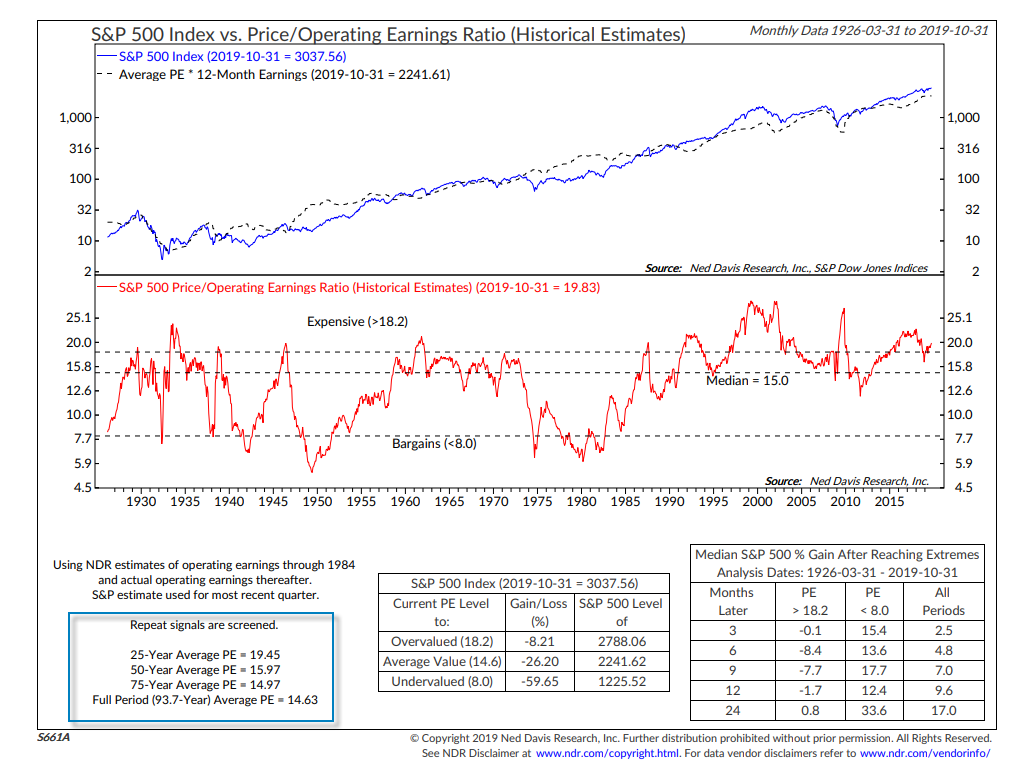
The bottom clip of the chart depicts the historical estimates of the Price/Operating Earnings Ratio for the S&P 500 Index, using monthly data back to 1926. At present, this ratio is 19.83. In the past, when the ratio has been above 18.2, the future gains in price going out 2 years have been virtually nothing, with losses on average 9 to 12 months later. The 50-year average PE is 15.95, and yes, prices may eventually revert to that mean, which will be painful. But, the 25-year average is 19.43, so from that perspective, things may not be that far out of whack.
This is why we rely on mostly technical indicators in our risk models rather than fundamental ones. They tell us what the market is doing. Not what we think it SHOULD be doing. Currently, our risk models are bullish, and equity allocations remain at 85% and our high yield bond risk model remains on its BUY signal from January 14. Equity allocations have been from 70% to 85% since February because the evidence has been positive. Until that changes, it will be status quo.
Material Of A Less Serious Nature
A World War II Spitfire pilot was speaking in a church, reminiscing about his war experiences. “In 1942,” he says, “the situation was really tough. The Germans still had a very strong air force. I remember one mission I was protecting a bomber squadron and suddenly, out of the clouds, these fokkers appeared.”
There are a few gasps from the parishioners and several of the children begin to giggle.
“I looked up and realized that two of the fokkers were directly above me. I aimed at the first one and shot him down. By then, though, the other fokker was right on my tail.”
At this point, several of the elderly ladies of the church were blushing with embarrassment.
The pastor finally stands up and says, “I think I should point out that “Fokker” was the name of an aircraft company that made many of the planes used by the Nazis during the war.”
“Yes, that’s true,” says the old pilot, “but these fokkers were flying Messerschmitts.”
Making History
Don’t you just love baseball? The Houston Astros had the best record in baseball during the regular season, along with having the best home record in baseball, winning some 74% of their home games. They supposedly had the best starting pitching rotation in baseball in Justin Verlander, Gerritt Cole and Zack Grienke. And, they lost. Not only that, they lost all four games on their home field. The visiting team won every game of the 7-game World Series, something that had never happened before. Definitely was pulling for Washington, since I personally know Kurt Suzuki, their starting catcher, who is a Fullerton Titan. Kurt became only the 19th player in MLB history to win a College World Series (2004) and a World Series. Sometimes, the data doesn’t mean a thing. It’s what makes sports unpredictable and so fascinating. Much like the financial markets!
Shhh. Don’t tell anybody. My San Francisco 49ers are 8-0. Maybe they will play New England in the Super Bowl. And win. I hope so. We’ll see. Guys have to stay healthy. Football is a physical game.
As always, the confidence and trust you place in all of us is greatly appreciated. Thank you.
Sincerely,

Bob Kargenian, CMT
President
TABR Capital Management, LLC (“TABR”) is an SEC registered investment advisor with its principal place of business in the state of California. TABR and its representatives are in compliance with the current notice filing and registration requirements imposed upon registered investment advisors by those states in which TABR maintains clients. TABR may only transact business in those states in which it is notice filed, or qualifies for an exemption or exclusion from notice filing requirements.
This newsletter is limited to the dissemination of general information pertaining to our investment advisory/management services. Any subsequent, direct communication by TABR with a prospective client shall be conducted by a representative that is either registered or qualifies for an exemption or exclusion from registration in the state where the prospective client resides. For information pertaining to the registration status of TABR, please contact TABR or refer to the Investment Advisor Disclosure web site (www.adviserinfo.sec.gov).
The TABR Model Portfolios are allocated in a range of investments according to TABR’s proprietary investment strategies. TABR’s proprietary investment strategies are allocated amongst individual stocks, bonds, mutual funds, ETFs and other instruments with a view towards income and/or capital appreciation depending on the specific allocation employed by each Model Portfolio. TABR tracks the performance of each Model Portfolio in an actual account that is charged TABR’s investment management fees in the exact manner as would an actual client account. Therefore the performance shown is net of TABR’s investment management fees, and also reflect the deduction of transaction and custodial charges, if any.
Comparison of the TABR Model Portfolios to the Vanguard Total Stock Index Fund, the Vanguard Total International Stock Fund and the Vanguard Total Bond Index Fund is for illustrative purposes only and the volatility of the indices used for comparison may be materially different from the volatility of the TABR Model Portfolios due to varying degrees of diversification and/or other factors.
Past performance of the TABR Model Portfolios may not be indicative of future results and the performance of a specific individual client account may vary substantially from the composite results above in part because client accounts may be allocated among several portfolios. Different types of investments involve varying degrees of risk, and there can be no assurance that any specific investment will be profitable.
The TABR Dividend Strategy presented herein represents back-tested performance results. TABR did not offer the Dividend Strategy as an investment strategy for actual client accounts until September/October 2014. Back-tested performance results are provided solely for informational purposes and are not to be considered investment advice. These figures are hypothetical, prepared with the benefit of hindsight, and have inherent limitations as to their use and relevance. For example, they ignore certain factors such as trade timing, security liquidity, and the fact that economic and market conditions in the future may differ significantly from those in the past. Back-tested performance results reflect prices that are fully adjusted for dividends and other such distributions. The strategy may involve above average portfolio turnover which could negatively impact upon the net after-tax gain experienced by an individual client. Past performance is no indication or guarantee of future results and there can be no assurance the strategy will achieve results similar to those depicted herein.
Inverse ETFs
An investment in an Inverse ETF involves risk, including loss of investment. Inverse ETFs or “short funds” track an index or benchmark and seek to deliver returns that are the opposite of the returns of the index or benchmark. If an index goes up, then the inverse ETF goes down, and vice versa. Inverse ETFs are a means to profit from and hedge exposure to a downward moving market.
Inverse ETF shareholders are subject to the risks stemming from an upward market, as inverse ETFs are designed to benefit from a downward market. Most inverse ETFs reset daily and are designed to achieve their stated objectives on a daily basis. The performance over longer periods of time, including weeks or months, can differ significantly from the underlying benchmark or index. Therefore, inverse ETFs may pose a risk of loss for buy-and-hold investors with intermediate or long-term horizons and significant losses are possible even if the long-term performance of an index or benchmark shows a loss or gain. Inverse ETFs may be less tax-efficient than traditional ETFs because daily resets can cause the inverse ETF to realize significant short-term capital gains that may not be offset by a loss.
For additional information about TABR, including fees and services, send for our disclosure statement as set forth on Form ADV from us using the contact information herein. Please read the disclosure statement carefully before you invest or send money.
A list of all recommendations made by TABR within the immediately preceding one year is available upon request at no charge. The sample client experiences described herein are included for illustrative purposes and there can be no assurance that TABR will be able to achieve similar results in comparable situations. No portion of this writing is to be interpreted as a testimonial or endorsement of TABR’s investment advisory services and it is not known whether the clients referenced approve of TABR or its services.