How We Invest Our Money, And Yours, And Where We’re At
First, I want to reinforce how seriously we take our mission, to care for you and your loved ones, on life’s journey, especially in regards to your personal finances and investments.
We consider our primary job at TABR Capital Management to be financial planning and helping our clients protect their assets—especially during extreme market conditions like we are seeing now. Risk management is at the core of our money management philosophy. Many investors, though, give lip service to this thinking. It’s like auto insurance or homeowner’s insurance. You don’t appreciate it until you get in an accident, or your living room gets flooded because the pipes broke. Then, you realize why it’s important. Financial markets are reminding all of us right now, what risk really looks like.
Since around 1988, we’ve been doing with our own money exactly what we do with clients’ money. It’s called skin in the game. It’s also called belief in what we do.
Where We’re At
On February 19, just 23 calendar days ago, several stock indexes, including the S&P 500 Index, were at all-time highs. Our tactical stock allocations were at 85% (having been there since June 2019), and we were heavily invested in high yield bond funds (having been on a BUY signal since January 2019). However, thanks to a pandemic virus, crashing oil prices and record low interest rates, stocks have been pummeled in the fastest decline in stock market history. In 23 days from February 19 to today, the S&P 500 has dropped -23.2%, the EFA index of international stocks has lost -27.6% and the Russell 2000 index of small companies has collapsed -33.7%.
We started cutting equity and high yield bond fund exposure on February 28, as some of our risk management models turned negative. As more turned negative last week and early this week, we continued reducing equity exposure in our tactical accounts, from 85% to 55% to 30% and finally, yesterday to about 20%. What does this mean? Since our maximum exposure in Moderate Risk accounts is 50% and is 35% in Conservative accounts, it means that entering today, those risk groups had equity exposure of about 10% and 7%, respectively. In other words, very little. On a day when stock indexes fell between -9.5% and -11%, our Moderate and Conservative accounts dropped approximately -1.65%. This is quite comforting, as it is likely that prices may go much lower, but not necessarily straight down. Please know it works both ways. In a bear market, there are huge rallies, and there might even be one tomorrow or early next week. Our accounts will make very little on those days. But, ultimately, it’s about preserving the bulk of one’s capital until more favorable conditions re-appear, and our various risk models indicate it is time to begin increasing exposure.
The Bond Market
Interestingly, our bond account strategies today lost about -1.43%. For what normally is a safe haven area (other than junk bonds, where we have hardly any exposure), all types of bonds are being hammered, and not because of rising interest rates, but we think because of credit default fears, much like in 2008. With many parts of the economy being temporarily shut down because of the virus fears, investors seem to be thinking that cash flows may be affected enough to question the debt paying ability of many investment grade corporate issuers. With durations of about two years in virtually all of the short term bond funds we own for clients, we expect much of the price damage being done now to be reversed once psychology has changed. In corporate high yield, this decline is setting up what may be a great buying opportunity. We’d love to see yields climb to the 9% zone, as they did in early 2016. Like with everything though, we’ll just see how far prices drop before reversing enough to give us re-entry signals.
The Charts And Our Technical Wisdom
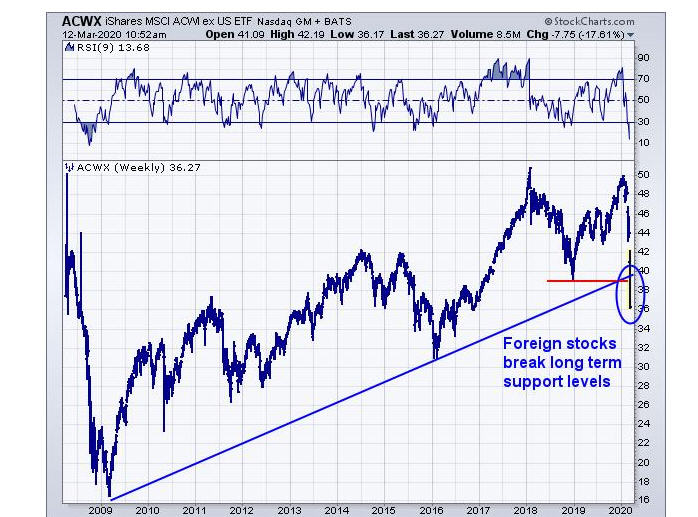
Based on charts, the bull market that began in 2009 appears to be over. Now, it’s the question of how low will prices go? As shown on the chart below, courtesy of www.stockcharts.com, foreign stocks as represented by the MSCI ACWI Index, ex the U.S., have already broken their long term uptrend line. Next support is about -11% lower at the early 2016 lows.
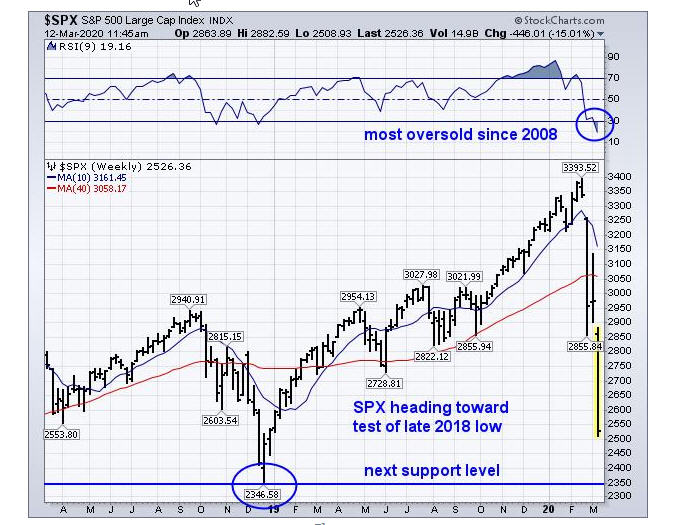
Similarly, the S&P 500 seems headed to its December 2018 lows near the 2350 level, which is about 5% below today’s close. That’s shown in the chart below, which is a weekly chart going back to early 2018.
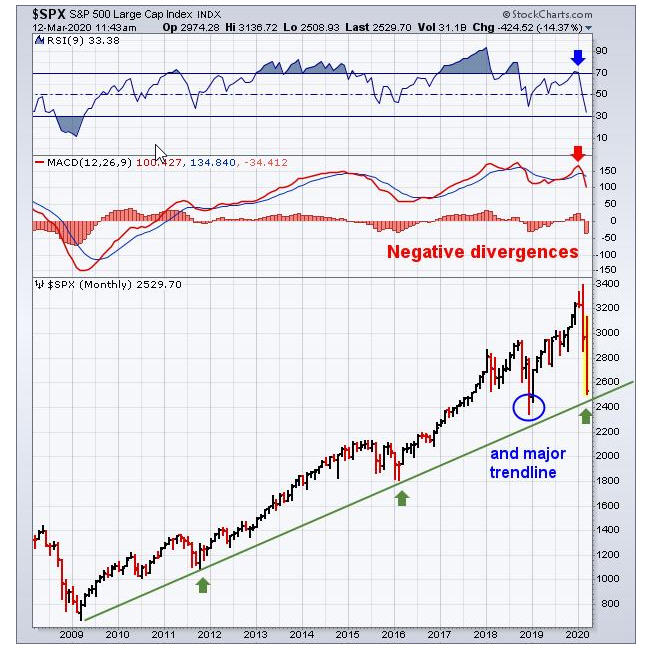
Finally, below is a monthly chart of the S&P 500 going back to the 2009 lows. The index closed right on the major trendline today, and I would expect it to break that line in coming days, much like foreign shares already have. If that takes place at some point, the next support levels are in the 1800-2000 range, which would represent declines of -40% to -47% from the peak.
Please know, these are not predictions. Nobody knows how low prices will go. The drop in 2007-2009 was -56%, the largest since 1931. This could be worse, or not. We’ll have to let it play out, and the market will tell us. The typical path to a bottom is a climax type of low, followed by a pretty strong rally, which is then followed by even lower prices, with less selling pressure as measured in price momentum, breadth in advances versus declines, and fewer stocks making new lows. That normally takes place over a period of weeks, if not several months (such as the lows in November 2008 and March 2009, which were almost five months apart).
Currently, the stock market appears to be in a third wave down, which is the strongest part of the move. From a valuation perspective, stocks are getting cheaper, but they are nowhere near “bargain” levels. Downside momentum is too great to be “bottom fishing.” As we’ve mentioned to several clients in conversations, we don’t want to catch a falling knife. We want to let it hit the floor, and then pick it up. From what we can tell, the knife has not hit the floor yet.
In sum, what’s happening in markets is unprecedented, but that was true 11 years ago, and it will likely be true 11 years from now. Recessions are part of the economic landscape. Grow and contract. Grow and contract. It’s part of life’s journey. At some point, this pandemic will be over, and a new bull market will begin, in all likelihood from lower price levels, maybe even much lower. As mentioned earlier, a big part of our job is protecting client assets in these environments as much as possible. And our process is doing that as we speak. The models we use are not perfect, and we’re continually trying to do better, even as markets evolve. I can tell you that my experience in 2008 is helping now, and what we’re going through now will help us (and by default, our clients) in the future.
Should you have any questions or concerns, don’t hesitate to reach out to us, via phone or email. Steve, Mary, Sylvia and myself are here for you, and though we can’t talk with all 230 of you in one day, we will respond typically no later than within 24 hours. Meanwhile, we’ll continue to reach all of you (and many interested parties) with our best thinking as all of this unfolds. Our next update will be our regular, monthly update around the first week of April, with various topics, and of course, some humor. Remember—pessimism and fear are an investor’s enemy here. I can’t emphasize enough how important discipline is and following one’s process.
May all of you have the blessings of good health and peace during this tumultuous time.
Sincerely,

Bob Kargenian, CMT
President
TABR Capital Management, LLC (“TABR”) is an SEC registered investment advisor with its principal place of business in the state of California. TABR and its representatives are in compliance with the current notice filing and registration requirements imposed upon registered investment advisors by those states in which TABR maintains clients. TABR may only transact business in those states in which it is notice filed, or qualifies for an exemption or exclusion from notice filing requirements.
This newsletter is limited to the dissemination of general information pertaining to our investment advisory/management services. Any subsequent, direct communication by TABR with a prospective client shall be conducted by a representative that is either registered or qualifies for an exemption or exclusion from registration in the state where the prospective client resides. For information pertaining to the registration status of TABR, please contact TABR or refer to the Investment Advisor Disclosure web site (www.adviserinfo.sec.gov).
The TABR Model Portfolios are allocated in a range of investments according to TABR’s proprietary investment strategies. TABR’s proprietary investment strategies are allocated amongst individual stocks, bonds, mutual funds, ETFs and other instruments with a view towards income and/or capital appreciation depending on the specific allocation employed by each Model Portfolio. TABR tracks the performance of each Model Portfolio in an actual account that is charged TABR’s investment management fees in the exact manner as would an actual client account. Therefore the performance shown is net of TABR’s investment management fees, and also reflect the deduction of transaction and custodial charges, if any.
Comparison of the TABR Model Portfolios to the Vanguard Total Stock Index Fund, the Vanguard Total International Stock Fund and the Vanguard Total Bond Index Fund is for illustrative purposes only and the volatility of the indices used for comparison may be materially different from the volatility of the TABR Model Portfolios due to varying degrees of diversification and/or other factors.
Past performance of the TABR Model Portfolios may not be indicative of future results and the performance of a specific individual client account may vary substantially from the composite results above in part because client accounts may be allocated among several portfolios. Different types of investments involve varying degrees of risk, and there can be no assurance that any specific investment will be profitable.
The TABR Dividend Strategy presented herein represents back-tested performance results. TABR did not offer the Dividend Strategy as an investment strategy for actual client accounts until September/October 2014. Back-tested performance results are provided solely for informational purposes and are not to be considered investment advice. These figures are hypothetical, prepared with the benefit of hindsight, and have inherent limitations as to their use and relevance. For example, they ignore certain factors such as trade timing, security liquidity, and the fact that economic and market conditions in the future may differ significantly from those in the past. Back-tested performance results reflect prices that are fully adjusted for dividends and other such distributions. The strategy may involve above average portfolio turnover which could negatively impact upon the net after-tax gain experienced by an individual client. Past performance is no indication or guarantee of future results and there can be no assurance the strategy will achieve results similar to those depicted herein.
Inverse ETFs
An investment in an Inverse ETF involves risk, including loss of investment. Inverse ETFs or “short funds” track an index or benchmark and seek to deliver returns that are the opposite of the returns of the index or benchmark. If an index goes up, then the inverse ETF goes down, and vice versa. Inverse ETFs are a means to profit from and hedge exposure to a downward moving market.
Inverse ETF shareholders are subject to the risks stemming from an upward market, as inverse ETFs are designed to benefit from a downward market. Most inverse ETFs reset daily and are designed to achieve their stated objectives on a daily basis. The performance over longer periods of time, including weeks or months, can differ significantly from the underlying benchmark or index. Therefore, inverse ETFs may pose a risk of loss for buy-and-hold investors with intermediate or long-term horizons and significant losses are possible even if the long-term performance of an index or benchmark shows a loss or gain. Inverse ETFs may be less tax-efficient than traditional ETFs because daily resets can cause the inverse ETF to realize significant short-term capital gains that may not be offset by a loss.
For additional information about TABR, including fees and services, send for our disclosure statement as set forth on Form ADV from us using the contact information herein. Please read the disclosure statement carefully before you invest or send money.
A list of all recommendations made by TABR within the immediately preceding one year is available upon request at no charge. The sample client experiences described herein are included for illustrative purposes and there can be no assurance that TABR will be able to achieve similar results in comparable situations. No portion of this writing is to be interpreted as a testimonial or endorsement of TABR’s investment advisory services and it is not known whether the clients referenced approve of TABR or its services.