Interim Update—Can Seasonality Save The Stock Market?
There’s been considerable damage to the stock market in the past several weeks (and the bond market as well). I didn’t want to wait until our full monthly update to communicate, as stocks broke support this past week and could be at a major tipping point. I’m not known for being brief, but this will be. We’ve got quite a bit of insurance right now. Read on.
Stocks Break Support
The 4200 level on the S&P 500 had been tested several times in the past month (see chart below, courtesy of www.stockcharts.com). It finally gave way last week. The uptrend from last October’s lows has been broken. As shown with the circles, stocks are making lower highs and lower lows. That’s the definition of a downtrend.
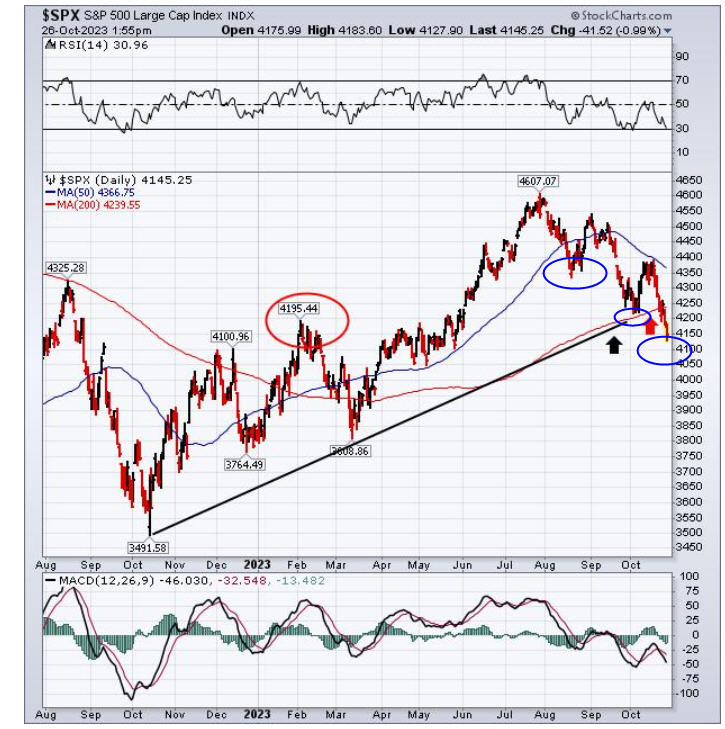
Below the 4100 level, I believe anything is possible. It has never felt like a new bull market, given the lack of participation of broad indexes, and the concentration of gains in a handful of large companies. Here’s the caveat. The historical strongest time of the year for stocks begins right now. Last week, both the S&P 500 and Nasdaq 100 indexes lost at least -2.50%, and the IJR Smallcap 600 was down -2.27%. According to analyst Tom Bowley at Stockcharts.com, last week was the worst historical week of the year, going back to 1950 with the data. But, look at the period dead ahead:
Here are the annualized returns by calendar day of the S&P 500, based on data since 1950:
- October 28th: +126.68%
- October 29th: +77.49%
- October 30th: +55.50%
- October 31st: +15.80%
- November 1st: +42.60%
- November 2nd: +71.58%
- November 3rd: +95.26%
- November 4th: +52.85%
- November 5th: +72.97%
This also begins the best three-month stretch of the year, from November through January. Will seasonality be enough to reverse this downtrend? I don’t know. Stocks are oversold, and some breadth indicators such as the McClellan Oscillator are showing positive divergences with price, while others such as the number of stocks making new lows were mostly expanding last week as prices dropped to new price lows. In addition, 75% of stocks in the S&P 500 and S&P 1500 are trading below their 200-day moving averages.
One interesting tidbit I noticed is that open-end high yield bond funds went up about 0.31% for the week, which is highly unusual during a week when stocks lost more than -2%.
Below is one of the intermediate trend models we follow. The chart is courtesy of Ned Davis Research, at www.ndr.com. It turned negative on September 20, and since then, the S&P 500 Index is down -6.4%. There is no such thing as a perfect model, or perfect indicator. At present, four of our intermediate stock market models are negative, and all of our bond models are negative.
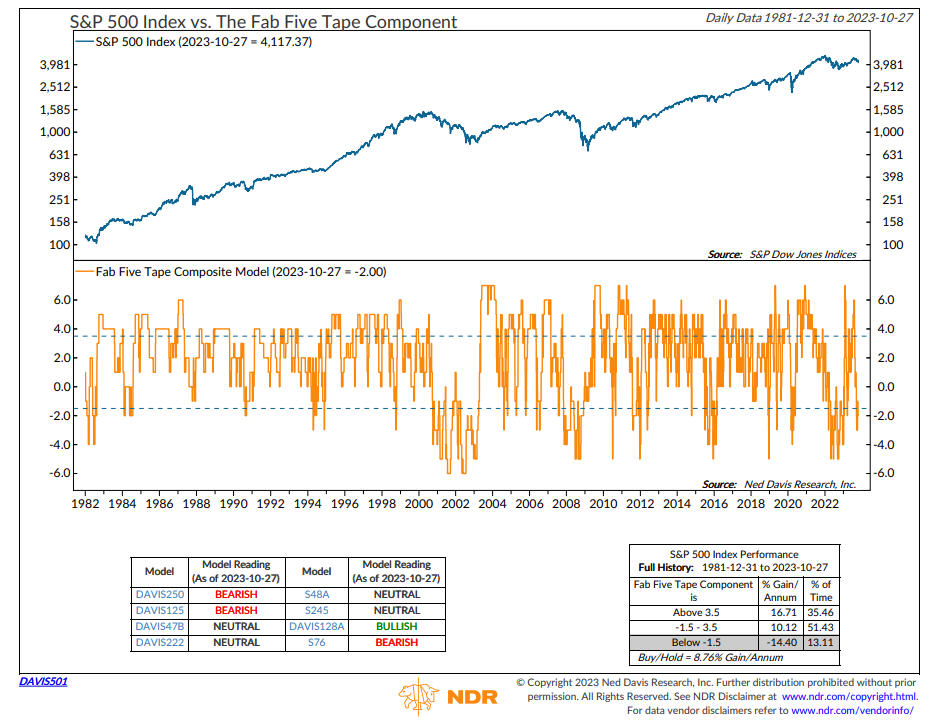
When in this mode since 1981, the S&P 500 has fallen at an annualized pace of -14%.
I can only tell you this. Not all SELL signals turn into significant intermediate declines. However, virtually EVERY intermediate decline has been preceded by intermediate term SELL signals. That’s where we are now.
At present, our Moderate Tactical portfolios are holding about 74% in cash and ultra-short bond funds, with yields at 5% or a bit above, and Conservative Tactical portfolios are at 81% cash and ultra-short bond funds. I’ve no idea if things will get worse from here, but if they do, we have plenty of insurance in our tactical portfolios.
It may be appropriate that Halloween is Tuesday. Trick or Treat?
Sincerely,

Bob Kargenian, CMT
President
TABR Capital Management
TABR Capital Management, LLC (“TABR”) is an SEC registered investment advisor with its principal place of business in the state of California. TABR and its representatives are in compliance with the current notice filing and registration requirements imposed upon registered investment advisors by those states in which TABR maintains clients. TABR may only transact business in those states in which it is notice filed, or qualifies for an exemption or exclusion from notice filing requirements.
This newsletter is limited to the dissemination of general information pertaining to our investment advisory/management services. Any subsequent, direct communication by TABR with a prospective client shall be conducted by a representative that is either registered or qualifies for an exemption or exclusion from registration in the state where the prospective client resides. For information pertaining to the registration status of TABR, please contact TABR or refer to the Investment Advisor Disclosure web site (www.adviserinfo.sec.gov).
The TABR Model Portfolios are allocated in a range of investments according to TABR’s proprietary investment strategies. TABR’s proprietary investment strategies are allocated amongst individual stocks, bonds, mutual funds, ETFs and other instruments with a view towards income and/or capital appreciation depending on the specific allocation employed by each Model Portfolio. TABR tracks the performance of each Model Portfolio in an actual account that is charged TABR’s investment management fees in the exact manner as would an actual client account. Therefore the performance shown is net of TABR’s investment management fees, and also reflect the deduction of transaction and custodial charges, if any.
Comparison of the TABR Model Portfolios to the Vanguard Total Stock Index Fund, the Vanguard Total International Stock Fund, the Vanguard Total Bond Index Fund and the S&P 500 Index is for illustrative purposes only and the volatility of the indices used for comparison may be materially different from the volatility of the TABR Model Portfolios due to varying degrees of diversification and/or other factors.
Past performance of the TABR Model Portfolios may not be indicative of future results and the performance of a specific individual client account may vary substantially from the composite results above in part because client accounts may be allocated among several portfolios. Different types of investments involve varying degrees of risk, and there can be no assurance that any specific investment will be profitable
For additional information about TABR, including fees and services, send for our disclosure statement as set forth on Form ADV from us using the contact information herein. Please read the disclosure statement carefully before you invest or send money.
A list of all recommendations made by TABR within the immediately preceding one year is available upon request at no charge. The sample client experiences described herein are included for illustrative purposes and there can be no assurance that TABR will be able to achieve similar results in comparable situations. No portion of this writing is to be interpreted as a testimonial or endorsement of TABR’s investment advisory services and it is not known whether the clients referenced approve of TABR or its services.