With Investing, How LONG Is Long Term?
Back in September 2015, our monthly email update was titled “More Selling Pressure is Likely,” as the stock market was in the midst of a multi-month decline of nearly 14% which culminated in February 2016.
In response to that email, one of our clients sent me a concise note, simply saying, “Bob, declines are temporary, uptrends are inevitable.” Of course, this is the buy and hold philosophy that if you simply give the stock market enough time, you will be fine. The problem is—how much time?
Let’s start with some facts. Many of you have probably heard these figures tossed around by the financial press, and other advisors. According to the Morningstar Ibbotson 2015 yearbook, here is what three main asset classes have done from 1926 to 2014, on a compound annual basis:
Large company stocks (S&P 500) 10.1%
Intermediate Government Bond 5.3%
U.S. Treasury Bills (cash) 3.5%
Who Has An 89-Year Time Horizon?
The above cannot be disputed, but I question how useful the information is. In order to achieve the 10% compound return for stocks, one would have had to sit through several 50% declines and even one of over 80% in the 1929-32 Depression era, and never panicked out of the market. Good luck with that.
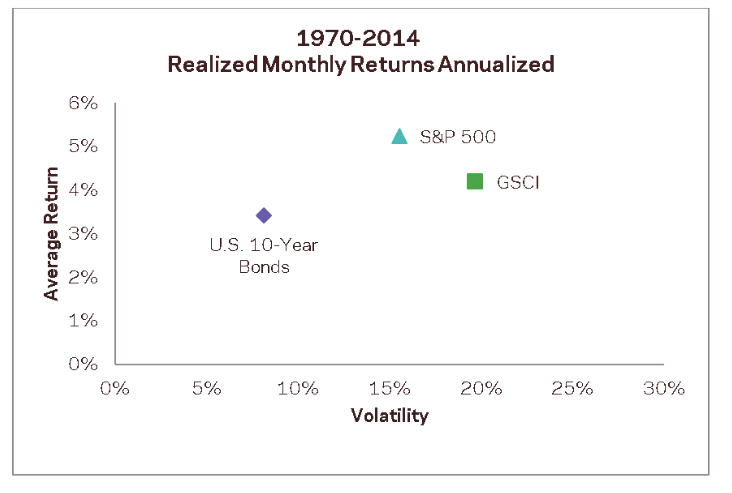
The reality is, though, investors don’t have this long of a time horizon. So, let’s shrink it. In December 2014, Cliff Asness of AQR Capital Management wrote a great research piece called “The Efficient Frontier Theory For The Long Run.” He started by analyzing the returns of three asset classes over a 45-year period from 1970 to 2014. The first chart is shown below.
Asness compared returns from the S&P 500, the 10-year Treasury Bond and the Goldman Sachs Commodity Index (GSCI). Note a couple of things–the graphs represent excess returns over cash, and represent annualized realized monthly arithmetic average returns and annual monthly standard deviations (the horizontal Volatility scale).
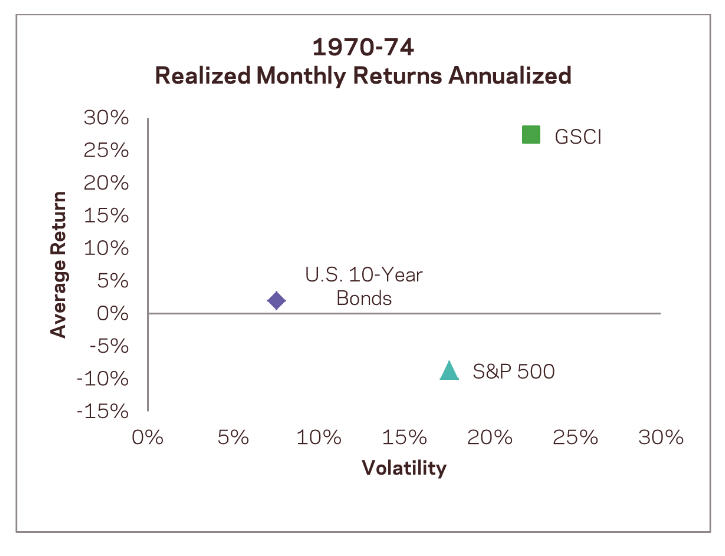
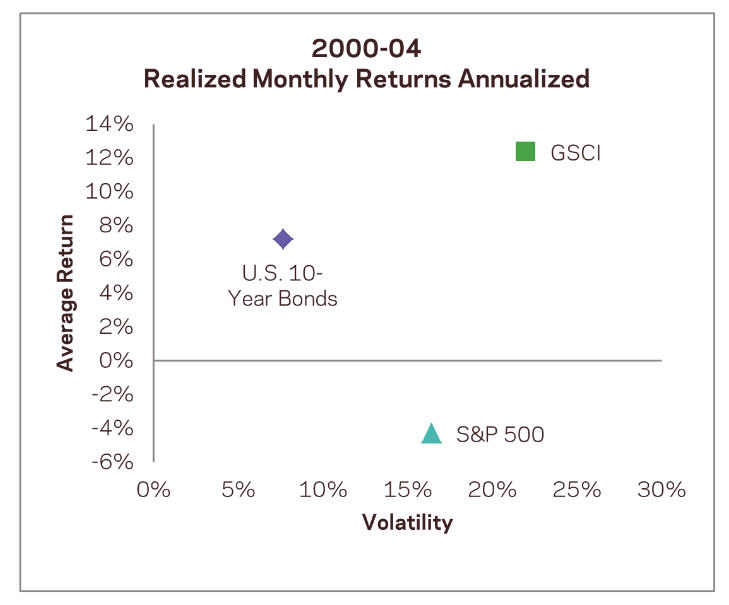
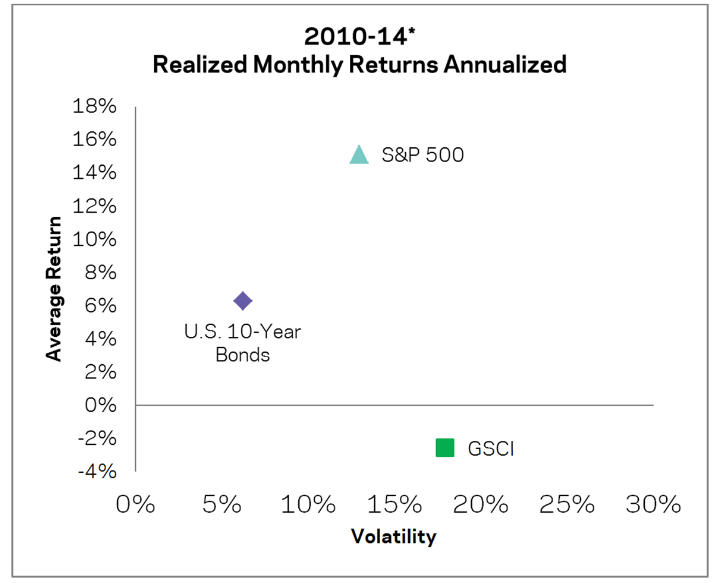
Given the above data from Ibbotson, as one would expect, stocks have the highest excess return over cash of about 5%. But look at what happens when you break down the time horizons into five-year increments. For space reasons, I’m only showing 4 of the 9 graphs he used.
In the five years shown above from 1970 to 1974, commodities returned some 25% over cash, while stocks were about -10% in comparison. In 1973 and 1974, stocks fell nearly -45%.
In contrast, the 1985-1989 period was fairly strong for stocks, with the S&P 500 returning some 12% over cash.
Then, we’re back to a negative period in 2000 to 2004, a time when stocks fell nearly 45% from 2000 to 2002.
And finally, look at another strong period from 2010 to 2014, with stocks returning nearly 15% per annum over cash.
So, what is the lesson in this work? That long term returns mean very little when it comes to the returns and volatility in any five-year period. And why is that important? Because much of the advice from the finance industry is not suited to the vast majority of humans. All the maxims you’ve probably heard. Focus on the long term. Don’t sweat it, the market always comes back. Don’t panic.
Imagine saying that to a 65-year old investor who has just retired. They’re not planning on going back to work. Their portfolio is all they have. They’ve worked hard for perhaps 30 years amassing this money and need it to work for them for maybe 20 or more years. If the portfolio takes a big hit for 5 or 10 years, it could impact their standard of living in a major way.
This is why we favor using a tactical approach to money management in most market environments. We believe that preserving capital during significant declines is really important. A process that can achieve this can provide peace of mind and a smoother ride to achieving one’s goals.
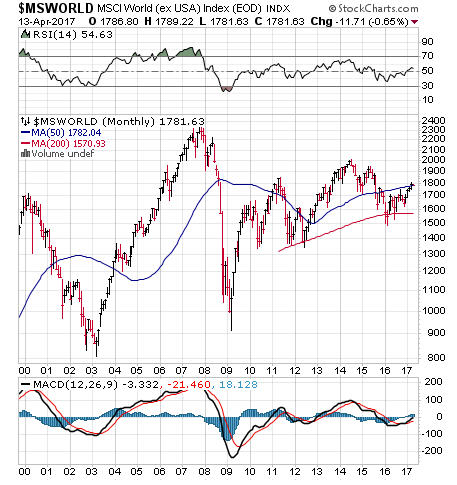
So, to our original question—how long is long term? In our view, it’s certainly longer than 5 years, and most likely at least 15. Even then, look at the chart below, which is of the MSCI World Index (ex USA). This stands for Morgan Stanley Capital International Index, and does not include the United States. It is a measure of foreign stock performance. The chart is courtesy of www.stockcharts.com.
This index peaked just above 1700 in early 2000, and today is just below 1800, some 16 years later. The chart does not include the factor of dividends, but even with them, you may be surprised to learn how two prominent indexes have fared for the last 17 years. Using dividend adjusted prices, below are the compound annual returns from December 31, 1999 to April 11, 2017 for U.S. large company stocks and international exposure:
Vanguard 500 Index Fund (VFINX) 4.7%
Vanguard Total International Stock Index (VGTSX) 3.2%
That’s a far cry from the 10.1% annual return we cited above from 1926. I would say 17 years is a pretty long time. Uptrends are inevitable. Hmmm. Yes, they are. But I think it depends on one’s definition of long term.
Today’s Evidence and Current Investment Allocations
On February 13, the S&P 500 closed at 2328. Today, April 13, the index also closed at 2328. There has been less than a 3% range and no net progress for two months. But, as we’ve been saying for several months, there are few indications of a major peak in stock prices, given that breadth and momentum indicators have been confirming recent highs. Despite fundamental valuation concerns and excessive consumer confidence, it is still a bull market until proven otherwise.
Six of our 9 stock market risk models are in a positive mode, so our tactical equity exposure remains around 65%, and our high yield bond risk model remains on its January 3 BUY signal. Seasonal and cyclical influences will be turning negative in about two weeks, but that says more about the next six months or so than anything imminent. Higher prices are likely a few months out, but the second half of 2017 could be a different story, which we’ll touch on next month.
Material Of A Less Serious Nature
Three women died recently and found themselves standing before St. Peter. He told them that before they could enter the Kingdom of Heaven, they had to tell him what Easter represented.
The first woman, an American, said, “Easter is a holiday where they have a big feast and we give thanks and eat turkey.”
St. Peter said, “Noooooo,” and sent her to Purgatory to study for her next test.
The second one, a Brit, said, “Easter is when we celebrate Jesus’ birth and exchange gifts.”
St. Peter said, “Noooooo,” and he also sent her to Purgatory.
The third, a Canadian, said she knew what Easter was, and St. Peter said, “So, please tell me.”
“Easter is a Christian holiday that coincides with the Jewish Festival of Passover. Jesus was having Passover feast with his disciples when he was betrayed by Judas, and the Romans arrested him. The Romans hung him on the cross and eventually He died. They then buried Him in a tomb behind a very large boulder.”
St. Peter said, “Verrrrry good.”
Then, the Canadian continued, “Now, every year the Jews roll away the Boulder and Jesus comes out. If he sees his shadow, we have six more weeks of hockey.”
Happy Easter everyone. And since my Dallas Stars missed the playoffs and just hired a new coach, may the Anaheim Ducks have about 12 more weeks of hockey, starting tonight! Thanks to all of you for your continued trust and confidence in us.
Sincerely,
Bob Kargenian, CMT
President
TABR Capital Management, LLC (“TABR”) is an SEC registered investment advisor with its principal place of business in the state of California. TABR and its representatives are in compliance with the current notice filing and registration requirements imposed upon registered investment advisors by those states in which TABR maintains clients. TABR may only transact business in those states in which it is notice filed, or qualifies for an exemption or exclusion from notice filing requirements.
This newsletter is limited to the dissemination of general information pertaining to our investment advisory/management services. Any subsequent, direct communication by TABR with a prospective client shall be conducted by a representative that is either registered or qualifies for an exemption or exclusion from registration in the state where the prospective client resides. For information pertaining to the registration status of TABR, please contact TABR or refer to the Investment Advisor Disclosure web site (www.adviserinfo.sec.gov).
The TABR Model Portfolios are allocated in a range of investments according to TABR’s proprietary investment strategies. TABR’s proprietary investment strategies are allocated amongst individual stocks, bonds, mutual funds, ETFs and other instruments with a view towards income and/or capital appreciation depending on the specific allocation employed by each Model Portfolio. TABR tracks the performance of each Model Portfolio in an actual account that is charged TABR’s investment management fees in the exact manner as would an actual client account. Therefore the performance shown is net of TABR’s investment management fees, and also reflect the deduction of transaction and custodial charges, if any.
Comparison of the TABR Model Portfolios to the Vanguard Total Stock Index Fund, the Vanguard Total International Stock Fund and the Vanguard Total Bond Index Fund is for illustrative purposes only and the volatility of the indices used for comparison may be materially different from the volatility of the TABR Model Portfolios due to varying degrees of diversification and/or other factors.
Past performance of the TABR Model Portfolios may not be indicative of future results and the performance of a specific individual client account may vary substantially from the composite results above in part because client accounts may be allocated among several portfolios. Different types of investments involve varying degrees of risk, and there can be no assurance that any specific investment will be profitable.
The TABR Dividend Strategy presented herein represents back-tested performance results. TABR did not offer the Dividend Strategy as an investment strategy for actual client accounts until September/October 2014. Back-tested performance results are provided solely for informational purposes and are not to be considered investment advice. These figures are hypothetical, prepared with the benefit of hindsight, and have inherent limitations as to their use and relevance. For example, they ignore certain factors such as trade timing, security liquidity, and the fact that economic and market conditions in the future may differ significantly from those in the past. Back-tested performance results reflect prices that are fully adjusted for dividends and other such distributions. The strategy may involve above average portfolio turnover which could negatively impact upon the net after-tax gain experienced by an individual client. Past performance is no indication or guarantee of future results and there can be no assurance the strategy will achieve results similar to those depicted herein.
For additional information about TABR, including fees and services, send for our disclosure statement as set forth on Form ADV from us using the contact information herein. Please read the disclosure statement carefully before you invest or send money.
A list of all recommendations made by TABR within the immediately preceding one year is available upon request at no charge. The sample client experiences described herein are included for illustrative purposes and there can be no assurance that TABR will be able to achieve similar results in comparable situations. No portion of this writing is to be interpreted as a testimonial or endorsement of TABR’s investment advisory services and it is not known whether the clients referenced approve of TABR or its services.

