“It’s Not Really A Loss Until You Sell.” What Are You Smoking?
There are a lot of truths and lies in our industry. And often, it can be hard to discern facts from bullshit. One of the narratives echoed by several clients over my 40 years in finance has usually been stated in describing a situation where an individual stock that one owns is underwater, sometimes by a decent margin.
Here it comes. “Well, it’s not really a loss until I sell it.” That may be true for tax purposes—in taxable accounts it’s called an unrealized loss—but for the most part, I think that’s a bunch of malarkey. Unrealized losses were at the heart of the biggest bank failure since 2008 (yes, Silicon Valley Bank).
We’ll dig into this more below, and how it dovetails into our emphasis on risk management. Other topics this month include home prices, do you really want to be a landlord?, the mixed bag of models and indicators and a shout out for Nefarious, in your local theatres NOW. Let’s get started.
Mark To Market Values Matter
In early March, Silicon Valley Bank (SVB) was a household name perhaps only to the Silicon Valley venture capital scene. So, how did it go from a profitable regional bank to being taken over by the federal government in a span of four days? It was reportedly the 16th largest bank in the United States.
The foundation for this cemented disaster starts with the Federal Reserve Board, who in early 2020 in response to the Covid pandemic, slashed the Fed Funds rate from 1.50% to effectively 0 in the span of a couple of months, then left rates at zero for nearly 2 years, continuing to provide liquidity to markets which clearly didn’t need it. As a result of this lengthy easing process, the yield on the 10-year Treasury Note hit a low of 0.51% in 2020, and remained well under 2% through 2021.
If buying Treasury Bonds with a 14% yield from 1980 to 1982 represented the bond trade of the century, locking in yields below 2% on long-term assets would appear to be the opposite. Yet, with rising deposits thanks to the Fed flooding the system with excess money, that’s what a lot of banks did. See the chart below, from the FDIC (Federal Deposit Insurance Corp) and courtesy of Ned Davis Research.

Some explanation is in order to understand the situation with the banking industry’s balance sheets. Accounting policy allows companies to treat securities as either “Available for Sale,” or “Held to Maturity.” Many of you are familiar with Held to Maturity. Let’s say you purchase a $100,000 bond yielding 2% which matures in 10 years. You’ll receive 2% interest on the bond each year, and if you hold the bond until maturity, you’ll get your $100,000 back, assuming the company doesn’t go bankrupt. That’s possible in corporate bonds, much less likely with municipal bonds, and almost never happens with government bonds (unless it’s Argentina, Greece or Venezuela, for example).
However, if you purchase a 2% bond, and 18 months later, 10-year bond yields are 4%, the value of your $100,000 bond might now be worth about $80,000. Two statements are true from here. Yes, if you hold this bond to maturity in another 8 plus years, you’ll get your $100,000 back. Right now, though, you’re sitting on a (-20,000) unrealized loss, and if you needed to sell that bond because you needed the money, the sale will create a (-20,000) realized loss. In the chart shown above, according to the FDIC, at the end of 2022, there were some $620 billion of unrealized (losses) sitting on bank balance sheets.
In the case of SVB, investment bank UBS estimated that at the end of 2022, the total unrealized loss on their securities portfolio was $17.7 billion. That might not have been threatening if it wasn’t nearly equal to its entire reported equity capital account. To understand how that could have happened, it’s important to understand “Available for Sale.” Scott Opsal, Director of Research & Equities with our friends at the Leuthold Group, did a great job of explaining this concept in recent commentary.
“AFS holdings are carried on the balance sheet at fair market value, and any unrealized capital gains or losses are passed through a balance sheet equity account called Accumulated Other Comprehensive Income. AOCI affects balance sheet capital ratios, so during a period of rising rates, the account would grow as market values fell, thereby reducing reported equity capital.” So, as the portfolio losses increased, SVB’s equity capital fell.
“The alternative is HTM, which are securities the company intends to hold to maturity. Accounting policy allows those to be carried on the balance sheet at amortized book value. Unrealized losses are not run through the capital statements, so neither book value nor regulatory capital are impacted when rates are on the upswing.”
As a result, banks would be protected from a decline in book value as long as they continued to hold the securities as planned. The problem for SVB was two-fold. They didn’t have enough capital in the HTM category, and because of their tight relationship with venture capital firms, they were dealing with very large depositors to where 90% of its deposit base did not qualify for FDIC coverage ($250,000 per depositor). Thus, these depositors were at risk if the bank failed.
Once the news spread that SVB needed to raise capital because of the unrealized losses, it became a death spiral and a run on the bank. As news spread that SVB had recognized a near (-$2 billion) loss and was repositioning $21 billion of its AFS portfolio, it’s been reported that $42 billion of deposits left the following day. And, that, effectively was the end of SVB. Graphically, it’s even more stunning. See the chart below, courtesy of @CharlieBilello.

Over one year ago, employees and other shareholders of SVB stock probably thought they’d hit the mother lode. The stock was beating the S&P 500 Index by a factor of over 4 to 1. And then it all began to unravel. They’re completely wiped out. This brings up two additional points. First, there is concentrated stock risk. The outcome here seems impossibly small, but it happened, just as it did to Enron many years ago. Second, I could actually have used a different headline to make the same point as above—“You Only Reap A Profit If You Sell.” It doesn’t do much good to ride a stock up nearly 1000%, only to watch it give it all back and more.
There are a number of things to sum up. Had depositors not wanted their money, SBV would have been fine. But management exhibited poor risk management by investing large sums of money in longer duration assets at the bottom of the interest rate cycle, then compounded that issue by not moving a very large segment of it to the Held to Maturity side. Had management kept the duration of their bond investments much shorter, the unrealized losses would have been much smaller, and likely never caused an issue. But, they were chasing yield to attract and keep deposits. With shorter durations, they wouldn’t have earned as much and likely wouldn’t have grown so fast, and management wouldn’t have seen the stock price gains that took place. They’d likely still be in business, though.
Ultimately, we think that minimizing losses on one’s balance sheet and portfolios serves multiple purposes. It permits one to think more clearly during stressful times and to make better decisions, because of the psychological component of potentially losing a lot of money. It also gives businesses and individuals flexibility they otherwise wouldn’t have. Think about the process of two customers who each have $1 million portfolios to start, and after two years, one account is worth $1.2 million, and the other is at $800,000. The former has a $200,000 unrealized gain (assuming nothing has been sold), and the latter has a (-$200,000) unrealized loss. They both now need to borrow $200,000 from their holdings to help expand their business. Who is going to get more favorable terms? With all due respect, I don’t agree with the line of thinking that “it’s not a loss until you sell.” Just ask the management at Silicon Valley Bank.
Is It Really Worth It Being A Landlord? No. How About “Hell, No!”
A number of our clients, and no doubt thousands of others, invest in rental properties, commercial properties and otherwise try to make their living and/or augment their portfolios by directly investing in real estate, either by purchasing properties (homes and apartments) and renting them out, or doing the same with commercial properties (office buildings, industrial warehouses, etc.). For those of you who believe in this process, I doubt that the following information will change your mind, or your beliefs. And, it’s not meant to. We all have different experiences, biases and comfort levels. For those, however, who have contemplated this, you might want to ponder the information below. Full transparency here. I’m not a fan of real estate, not in being a landlord in any fashion. This is not the same as saying one shouldn’t have real estate in their portfolio/balance sheet as an investment (and I’m not including your residence, or second home). I’m saying the data suggest there is a much better way to go about it.
In general, the benefits of owning rental properties are typically overstated, and the risks are minimized. There are greater costs, risks and expenses, compared to the alternative. Unless you’re paying cash, you have a mortgage, and you’ll pay a higher financing rate on the mortgage since it’s a rental property. There’s homeowner’s insurance, umbrella liability insurance, property taxes, repairs, maintenance and dealing with tenants. A bad tenant can take up your time, create stress, and ruin your projections. Given the experiences of the past several years, you might even have to worry about government controls on how much rent you can charge, and you certainly have to deal with laws in regards to evictions. Oh, did I mention that housing is an illiquid asset that can be difficult to sell?
For all of that, you’re supposed to get a return, plus tax advantages. No doubt, there are tax advantages, in that if you carry a mortgage, that becomes an expense against your rental income. But, it REDUCES your income. And, yes, you get to depreciate the property for tax purposes, which also ends up lowering the cost basis for tax purposes. So, for all of the above, what do you get? Take a look at the chart below, courtesy of Ned Davis Research.
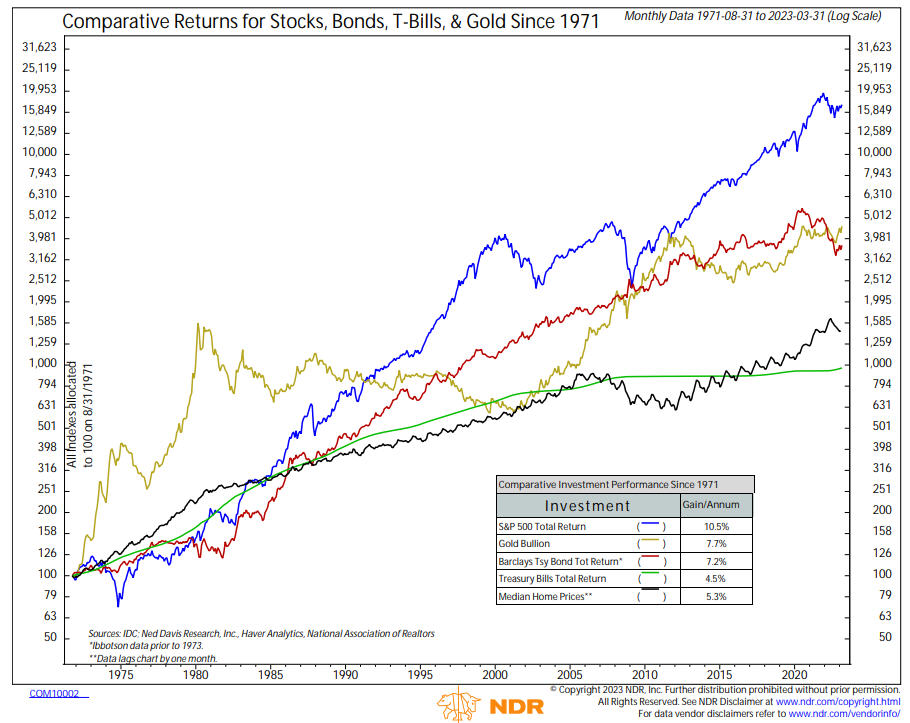
The chart compares the total return from stocks, as measured by the S&P 500 Index, to gold, bonds, treasury bills and real estate, as defined by median home prices. The data on home prices comes from the National Association of Realtors. As you can see, stocks have beaten home prices by a factor of nearly two to one. Even risk-free treasury bills have nearly matched the appreciation of home prices. As an aside, gold has earned nearly an 8% return during this period, bolstering the case from gold bugs. I expect to write about gold very soon, but one thing I noticed and researched—if you exclude the run-up in gold to 1980 from the early 1970s when it became freely traded, the 42-year compound return from 1980 to today is around 2.6%. That really gives me pause.
Back to real estate. Returns of 5.3% don’t really stack up in comparison to alternatives. However, it can be argued that returns vary from property to property. That’s absolutely true. Some people will say, “I know what I’m doing. I can buy property cheap, fix it up, and earn a much higher return.” Maybe so. Unfortunately, I can also show you people who have no idea what they’re doing, and will lose their ass. In addition, as an individual property owner, it is very hard to diversify, because you need lots of capital. There is much more risk owning one or two properties, in comparison to hundreds or more. Also, in regards to the 5.3% return on median home prices, it certainly is true that real estate in different parts of the country performs differently. It sure has appreciated sharply in most areas of Orange County, where we’re based, but maybe not so much in Fairfield, Iowa?
We found some additional information that puts things in a better light. According to the National Multi-Family Housing Council (NMHC), using data from the National Council of Real Estate Investment Fiduciaries (NCREIF), they estimate that from 1987 to 2016, private landlords earned average returns of 8.7% overall. Though that study covers a slightly different time period, it’s pretty close to the returns we found from simply owning two of the best performing real estate funds in the public sector—Cohen & Steers Realty Shares (CSRSX) and the Vanguard Real Estate Index Fund (VGSLX). The Cohen & Steers Fund has the longer track record, going back to July 1991, a period now of nearly 32 years. Its compound annual return during that time is 10.79%, which actually beat the S&P 500 during that period (9.82%). The Vanguard Fund debuted in November of 2001, and it has earned 8.99% compounded for nearly 22 years. These returns compare favorably to the returns cited by the NMHC.
This begs the question, that I posed above. If you can earn similar or better returns buying these funds, even with an advisor, where they are totally transparent and can be sold at any time with no cost, why would you want to be a landlord? Oh, I forgot to mention the sector and geographic diversification that you get with the funds, versus owning a few properties. The Cohen & Steers Fund has the following breakdown:
14% Industrial
12% Infrastructure
12% Apartments
10% Health Care
10% Data Centers
8% Self Storage
8% Other
7% Free Standing
7% Single Family Homes
6% Regional Malls
4% Manufactured Homes
3% Hotels
In addition, 22% of the funds assets are located in the South Atlantic, 20% in the Pacific, 18% in the Mid Atlantic and 13% in the Southwest Central. You have much better diversification than you could possibly create on your own. Before closing, I should mention two other items. First, home prices and commercial property prices DO go down.
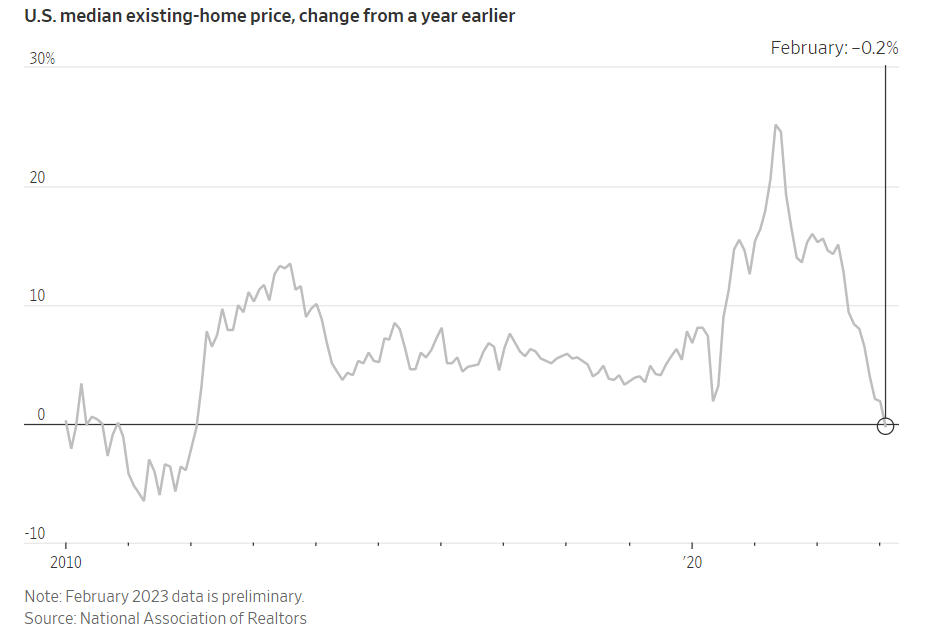
According to the chart above, from a recent Wall Street Journal article, median home prices through the end of February were down 12.3% from their peak last June. That decline should get larger in the next several months. Which brings up an important point in owning the real estate funds cited above. The psychological point. The maximum drawdown for both funds was -47%, which took place in 2007 and 2008. You get a monthly statement. Maybe you look at it, maybe you don’t. But, in those two years, you would have lost nearly -50% of your money. In that realm, real estate is not much different than the stock market. To earn that 10% return over 30 years, you would have needed to get through that pain. It’s possible that one could argue that wouldn’t happen with an individual property. Maybe. But, likely not, in that during that period, home prices in cities such as Phoenix and Las Vegas definitely dropped that much. It’s not like you would be shielded from the pain just because there’s not a valuation on your property every month from your mortgage company.
The other item is where are valuations today? In real estate, this is commonly known as the “cap rate,” equivalent to the “earnings yield” for stocks. The cap rate is calculated by dividing a property’s net operating income by its asset value. According to the NCREIF, the current cap rate nationwide is about 4%. Twenty years ago, it was 8%. Which tells me this—don’t expect 10% returns from real estate during the next 10 years, anymore than you should expect those returns from stocks. Both asset classes are extremely overvalued relative to their history, and the only likely way to fix that is for either prices to go sideways for many years, or for them to go down substantially in the near term. Either way, there are better and easier alternatives to being a landlord. And by now, you certainly must know what I favor.
A Mixed Bag And No Trends
Rarely in analysis are things one-sided, and currently, we find ourselves with mixed messages from various models and indicators we track. The first four months have been marked by choppiness, ups, downs, but very little in the way of trends, which is one of the worst environments for our risk models. At some point, this will change. Presently, 3 of our 5 stock market risk models are positive, and therefore our tactical stock market exposure is near 60% of its maximum. That could easily go to 80% next week, or not. Such is the environment we are dealing with—much activity and very little to show for it. It’s been similar in the high yield bond market, where our model currently is negative, with funds in ultra-short bond funds, but a signal change may or may not happen this weekend. This area hasn’t been any more productive than stocks, but eventually a trend will emerge. On the relative strength front, in early April we sold one of our three stock ETFs that was invested in mid-cap value (IJJ) and replaced it with the Nasdaq 100 (QQQ), which has been leading the market in 2023. Just four months ago, the QQQ was near the bottom of our rankings. A third of our exposure is in Europe (IEV) and that’s been performing quite well relative to the S&P 500 and other areas. What is lagging is the performance of small and mid-cap stocks, and badly. With the drop in yields, growth stocks have re-emerged, while value is going nowhere, the opposite of 2022. It is healthier for the stock market when there is broad participation. Right now, that’s not evident.
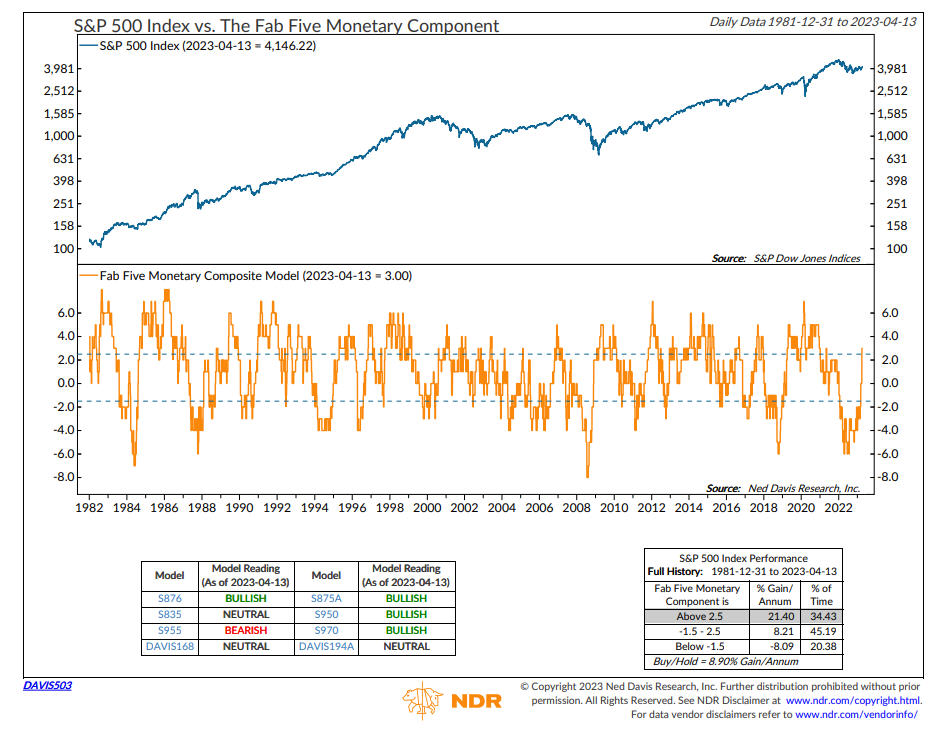
On the plus side, monetary conditions have improved. Below is the Ned Davis Research Fab Five Monetary Model, which is composed of 8 different monetary indicators. This model had been in its bearish mode for about the last 18 months, but it just turned positive. In the last 40 years, when in this bullish mode, the S&P 500 Index has gained at an annualized rate of over 21%, nearly double its norm.
In addition, there’s been a technical development that has only taken place 16 times since 1944. The three-month moving average of the S&P 500 recently closed above its 1-year moving average. The table below, and concept, are courtesy of analyst David Steets at systematicindividualinvestor.com.

Going out 1-year, there has only been one negative result, with average gains of over 15% for the S&P 500, quite a bit above the norm. Lately, it seems like nothing with a historical bent has been working, but these are definitely positive developments. On the negative side, stocks are still quite overvalued, even after last year’s decline. Below is the Shiller 5-Year Average Price to Earnings chart vs the S&P 500, also courtesy of Ned Davis Research. The concept came from analyst Steve Leuthold, who we’ll touch on below.
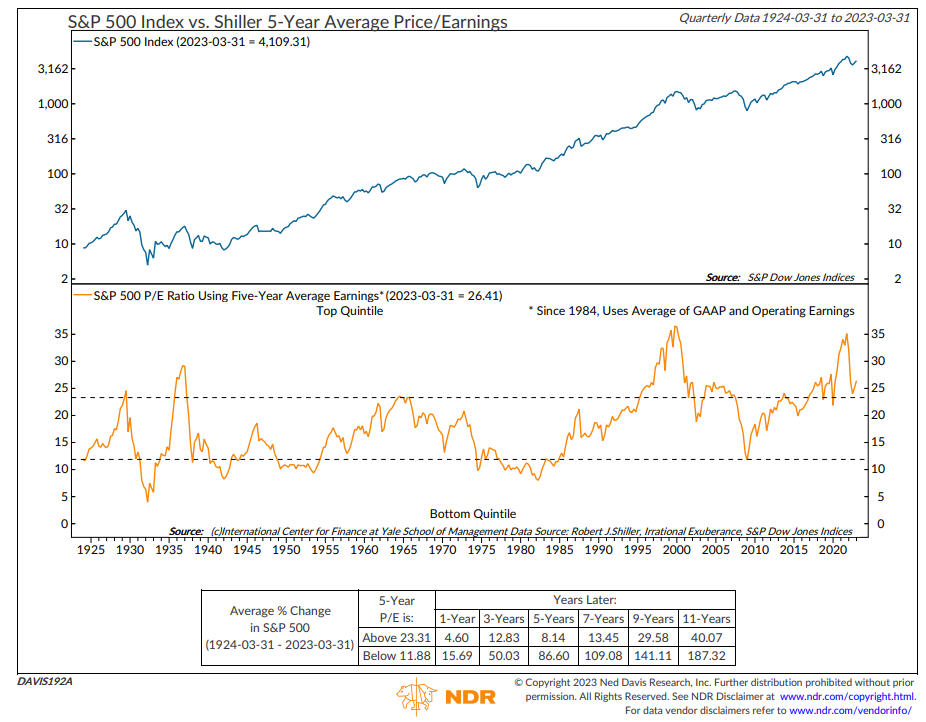
Just because stocks are overvalued doesn’t mean they have to go down. Today’s ratio of over 26 is similar to the level around 1996, and stocks kept rising then for 3 years. This is more about illustrating how extended stocks are, relative to their history. In this condition situated in the top quintile, using nearly 100 years of data, the average change in the S&P 500 going out 7 years is less than 2% per annum. In sum, there are a lot of cross currents. Near term, more positive, but intermediate to longer term, more negative. The bond market and yields seem to be suggesting a recession is coming later this year. Stocks aren’t reflecting that. Alas, a mixed bag.
NEFARIOUS
I love being able to do this. To tell you a bit about a wonderful friend, who also happens to be a client (full transparency, yes I am biased here!), and who is the star of a new film being released in theatres on April 14, which will be yesterday if we get this out on Saturday. His name is Jordan Belfi, and the new movie is Nefarious. Jordan began his acting career over 20 years ago. There is a long list of shows and movies he has appeared in, but perhaps up to now he’s best known for his recurring role on Entourage, in seasons 1 through 6.
The storyline for Nefarious is this–on the day of his scheduled execution, a convicted serial killer gets a psychiatric evaluation during which he claims he is a demon, and further claims that before their time is over, the psychiatrist will commit three murders of his own. Jordan is the psychiatrist.
As Jordan conveyed during conversation two weeks ago and via email, Nefarious “is a religious movie with a Christian message, but defies categorization as it is wrapped inside of a gripping, tense psychological thriller and drama that no matter what anyone’s belief system, is edge-of-your-seat compelling, profoundly thought-provoking, and moving.” Below is a link to the trailer for the movie, via YouTube, and one of the pictures Jordan shared with us from the premiere in Dallas a week ago.
Below is Jordan at the premiere with wife Rachelle Dimaria, an actress and producer. They have a gorgeous son, Rocky, who is 16 months old. And no, I have not asked Jordan if he committed three murders of his own. To find that out, you’ll have to watch the movie, just like me. Hope you like it, and am praying for a great outcome for Jordan and the cast.

Material Of A Less Serious Nature
Through my membership in the CMT Association (formerly known as the Market Technician’s Association) back to the mid-1980s, I met Steve Leuthold, founder of the Leuthold Group which began in 1981 as an institutional research firm. As far as I know, they’ve been publishing their monthly Green Book for nearly 40 years. And that is where I got the idea for this section. Finance can be boring for many people, but I love jokes, and every month, to this day, the Leuthold Group would publish a section called At Random, with many hilarious stories and jokes, many of which today unfortunately are unfit to print. I’m doing my best, though! Steve’s sense of humor started this tradition. And this month, we’d like to honor him, as he sadly passed away last month at the age of 85, in Carlsbad, CA. Steve built a research team and investment policies that incorporate technical and quantitative methodologies, which is why I was attracted to them. And still are.

That’s Steve, above. This was one of his favorite jokes. Thanks for all you did, Steve.
The old At Random Originator got fed up with damn near everything and became a recluse at his house in Maine. Five months passed before there was a knock on the door.
“Hey, neighbor, haven’t seen you around,” the fella said. “Thought I’d stop by and invite you to a party I’m throwing.”
Leuthold hesitated, but then accepted. “Sure, I guess five months alone is quite enough.”
“Great!” said the neighbor. “But, I gotta warn ya, at this party there’ll be a wicked lotta drinkin’.”
“Fine with me,” said Leuthold. “I haven’t had a drink in five months.”
“Well, I still gotta warn ya, after all the drinkin’ there’s gonna be a wicked lotta fightin’ at this party.”
“OK with me,” said Leuthold. “I’m still pretty ornery.”
“Well,” said the neighbor, “I should warn ya of one last thing. After the drinkin’ and fightin,’ there’ll be a wicked lotta sex going on at this party.”
“Fine with me,” said Leuthold. “After five months alone I could use a little. . . Uh—say, by the way, what should I wear to this party?”
“Well,” replied the neighbor, “It don’t really matter much. . .it’ll just be the two of us.”
This turned out longer than I had planned, and I even had to cut sections. Look for Steve Medland’s update next month, and I’ll be back in June. By then, hopefully my Dallas Stars will be hoisting the Stanley Cup. Playoffs start Monday night, and I can’t wait. Tense. Thrilling. Edge-of-your-seat. Compelling. Jordan was describing Nefarious. That also describes the NHL Playoffs. The Stanley Cup Playoffs, live and in-person, are one of the best sporting events, ever. Drop the puck. Let’s go. Thanks for reading this. Your trust in all of us at TABR is greatly appreciated.
Sincerely,

Bob Kargenian
President
TABR Capital Management
TABR Capital Management, LLC (“TABR”) is an SEC registered investment advisor with its principal place of business in the state of California. TABR and its representatives are in compliance with the current notice filing and registration requirements imposed upon registered investment advisors by those states in which TABR maintains clients. TABR may only transact business in those states in which it is notice filed, or qualifies for an exemption or exclusion from notice filing requirements.
This newsletter is limited to the dissemination of general information pertaining to our investment advisory/management services. Any subsequent, direct communication by TABR with a prospective client shall be conducted by a representative that is either registered or qualifies for an exemption or exclusion from registration in the state where the prospective client resides. For information pertaining to the registration status of TABR, please contact TABR or refer to the Investment Advisor Disclosure web site (www.adviserinfo.sec.gov).
The TABR Model Portfolios are allocated in a range of investments according to TABR’s proprietary investment strategies. TABR’s proprietary investment strategies are allocated amongst individual stocks, bonds, mutual funds, ETFs and other instruments with a view towards income and/or capital appreciation depending on the specific allocation employed by each Model Portfolio. TABR tracks the performance of each Model Portfolio in an actual account that is charged TABR’s investment management fees in the exact manner as would an actual client account. Therefore the performance shown is net of TABR’s investment management fees, and also reflect the deduction of transaction and custodial charges, if any.
Comparison of the TABR Model Portfolios to the Vanguard Total Stock Index Fund, the Vanguard Total International Stock Fund, the Vanguard Total Bond Index Fund and the S&P 500 Index is for illustrative purposes only and the volatility of the indices used for comparison may be materially different from the volatility of the TABR Model Portfolios due to varying degrees of diversification and/or other factors.
Past performance of the TABR Model Portfolios may not be indicative of future results and the performance of a specific individual client account may vary substantially from the composite results above in part because client accounts may be allocated among several portfolios. Different types of investments involve varying degrees of risk, and there can be no assurance that any specific investment will be profitable
For additional information about TABR, including fees and services, send for our disclosure statement as set forth on Form ADV from us using the contact information herein. Please read the disclosure statement carefully before you invest or send money.
A list of all recommendations made by TABR within the immediately preceding one year is available upon request at no charge. The sample client experiences described herein are included for illustrative purposes and there can be no assurance that TABR will be able to achieve similar results in comparable situations. No portion of this writing is to be interpreted as a testimonial or endorsement of TABR’s investment advisory services and it is not known whether the clients referenced approve of TABR or its services.