Lower Highs And Lower Lows = Probable Bear
Technical Analysis can be an inexact science. Charts, patterns, formations, indicators. And candidly, a lot of subjectivity. We’ve been using a quantitative approach to markets since the mid-1980s, where we take technical indicators and use them with sets of rules. This provides more discipline, and less emotion.
One of the simplest things that investors can do, though, is to simply ask one question when you’re looking at a market index, or individual stock. What’s the trend?
Since the beginning of the year, stocks have been making lower highs, and lower lows. That’s the definition of a downtrend. And it will continue, until it doesn’t. We’ll examine that and more, inside.
What’s The Trend?
When a stock or index is making higher highs and higher lows, that’s a simple definition of an uptrend. The opposite is a downtrend, marked by lower highs, and lower lows. And for the first time since the market bottomed in March 2020, that’s exactly what we have. Lower highs and lower lows. See the chart below, courtesy of www.stockcharts.com.
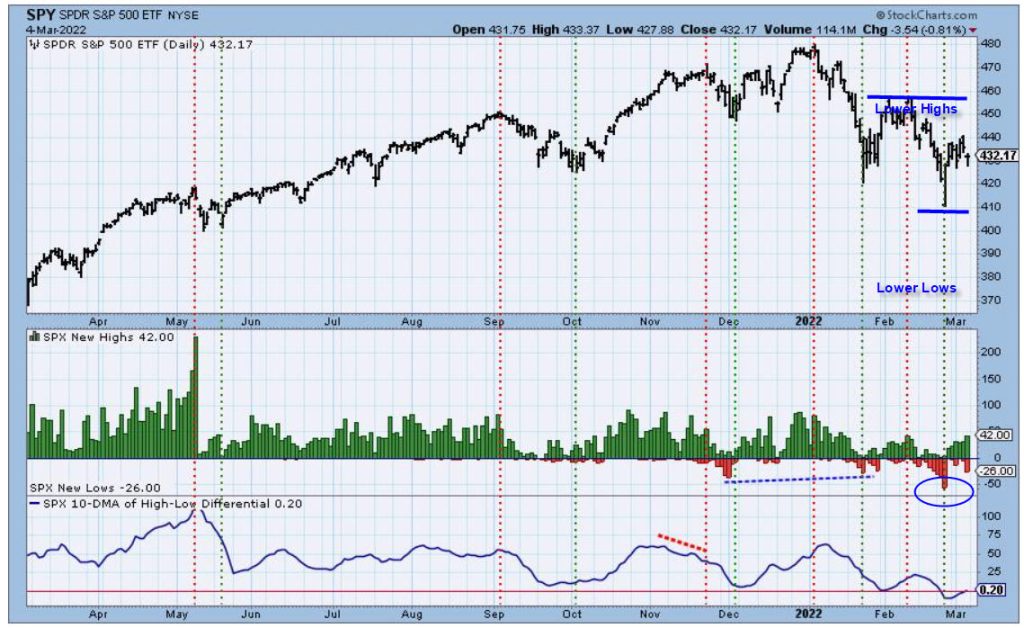
On January 24, stocks opened sharply lower, with the S&P 500 and NASDAQ down nearly 4% in early morning trading, only to reverse and close higher on the day. That marked the first low, and was followed by a rally that lasted into mid-February. That rally, though, made a lower high, topping out just under the 4600 level on the S&P 500. Then, on February 24, stocks again plunged in early morning trading, making new lows for the move, but again, closing higher on the day.
As is shown in the middle clip, which depicts the daily number of S&P 500 new highs and new lows, new lows expanded on that day, reaching 57. This means that this measure of market breadth is confirming the new low in prices. Lower prices are being accompanied by a growing number of stocks in the index making new 52-week lows.
This is typical of an emerging downtrend. It suggests that prices are eventually going lower. How much lower, nobody knows. Yesterday, March 7, the index made a new closing low at 4201, down nearly -3% for the day, and now down over -12% from its closing high set on January 3. Yet, it’s still over 2% above the intra-day low set on February 24 at the 4114 level. The NASDAQ Composite today closed at 12,830, which is down just over -20% from its high set on November 19.
The NASDAQ is home to many large technology companies, and growth stocks are taking a beating in comparison to value stocks, a reversal of the long trend of the past several years. Part of this is due to the rise in interest rates, with the yield on the 10-year Treasury Note jumping over 50 basis points in the first six weeks of the year, peaking at 2.04% thus far.
In contrast to the NASDAQ, the S&P 500 Value Index topped on January 12 and is down just -6.5% from its peak. Energy stocks and financials have been partly responsible for this relative strength, but bank stocks have begun to crater in the past week since Russia invaded Ukraine, as sanctions on the Russian banking system seemingly have started a correlation with the entire global banking economy.
Retracement Levels
Given the behavior of markets the last 9 weeks, we’re operating on the assumption that the bull market that began in March 2020 is over. Now it’s a matter of how low prices go before finding the bottom. Last month we featured two indicators that we pay attention to for longer term oversold conditions. One is the weekly RSI on the S&P 500 chart, and the other is the Value Line Median Appreciation Potential. Neither is even remotely near BUY territory.
Another method that technicians use to try and project the future is to measure the length of a bull market, and look for common retracements of the entire move. On a closing basis, the S&P 500 Index advanced from 2237 to 4796. Common retracement levels are 38%, 50% and 61.8%. Those would correspond to levels in the index of 3824, 3517 and 3215. The first level of 3824 would correspond to a -20% loss in the index, while a move to 3215 would equal a decline of nearly -33%.
There’s no use offering a guess as to how far down stocks go, or how long this lasts. We’ve pretty much seen it all in the last 22 years. In the 2000-2003 period, stocks went down for 3 years in a row, culminating in a near -50% loss. Stocks went down nearly -57% from October 2007 to March 2009, and then in February/March 2020, dropped -34% in about 35 days.
For all we know, maybe ALL of the gains of the past two years will get wiped out. Perhaps we’re on the verge of World War III. Perhaps we’ve begun an inflationary cycle of 7% plus inflation for the next 5 years. Who knows? Eventually, this will pass and we’ll start a new bull market cycle, but right now, the TREND is down.
The Positioning Of Our Portfolios
There have been no allocation changes to our tactical portfolios since early February, our last update. All five of our stock market risk models remain negative, with very little chance of that changing any time soon. Our four Fidelity sector fund positions and the Vanguard Total Stock Index ETF remain as our floor, putting us at about 20% stock exposure. When all is said and done, our Moderate risk accounts have total equity exposure of about 11%. Conservative accounts are less than that, and Aggressive accounts a tad more. As mentioned last month, we are in Max Protect mode.
This is a very humbling business. Yesterday, March 7, many prominent stock indexes were down in excess of -3%. Our Moderate accounts were down about -0.27%. If stocks were to plummet another -30% or more from current levels, our tactical portfolios will weather the storm quite well. We’ll have the bulk of our capital for the next bull market.
That doesn’t mean we’ll have a magic signal that buys at the bottom. Not at all. When stocks bottom and reverse, we’ll get the opposite effect, of hardly gaining any ground while stocks advance. At least until our risk models improve enough to begin adding exposure. That’s how our process works. We’ve all been accustomed to declines being much faster than the advances, and that may continue to be the case, but one never knows. The last time stocks were this over-valued was in 2000, and it took 3 years to work off the froth.
On the bond side, we remain completely out of high yield bond funds, which are beginning to get hit hard, and spreads are beginning to widen (that’s good when you’re out!). That cash is sitting in very short term bond funds. Yesterday, our risk model for the PIMCO Income Fund turned negative, and that entire position was moved to PIMCO Low Duration. So, we’re positioned across the board in short duration bond funds, a very defensive position.
The Fed will be raising the Fed Funds rate by 25 basis points at its meeting next week, but everybody already knows that. The bond market has been leading the Fed. Don’t assume that rates will go up from here. Let the bond market tell you. The Russia/Ukraine war has thrown a wrench into the bond market world wide, so we’ll have to see how it sorts out. Treasuries are oversold here, and I wouldn’t be surprised by seeing yields fall for several weeks, but investment grade and especially high yield bonds are more at risk, given their high correlation to stocks.
Everything Is Cyclical
As we can all attest, no matter your area of the country, filling up your vehicle has become much more expensive in the last few weeks. Here in Orange County, I’ve seen several gas stations showing premium gas at $5.99 per gallon. Oil prices worldwide are up 30% in the last six days, subsequent to Russia invading Ukraine. Commodity prices in general are rising sharply, with wheat gaining 70% since February.
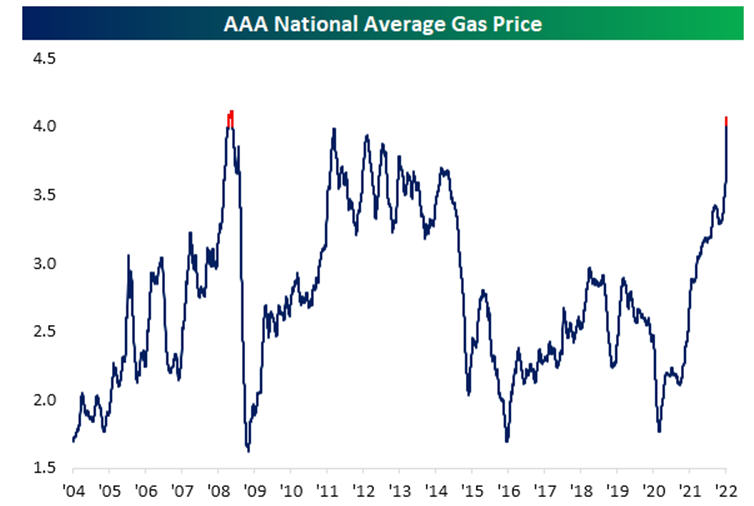
There’s a parabolic rise happening in oil right now, and there’s no way to know how far this goes. For perspective, though, take a look at the chart below, courtesy of Bespoke Investment Group. It shows the AAA National Average Gas Price going back to 2004.
For those of you more numerically inclined, below is the price of West Texas Intermediate Crude Oil in March of every year, going back to 2006. The data is courtesy of Charlie Bilello@charliebilello.
March 2006 $64
March 2007 $60
March 2008 $100
March 2009 $45
March 2010 $80
March 2011 $104
March 2012 $107
March 2013 $90
March 2014 $104
March 2015 $52
March 2016 $35
March 2017 $53
March 2018 $61
March 2019 $57
March 2020 $47
March 2021 $64
March 2022 $125
Based on history, prices have fluctuated in a wide band, and are at the upper end of that band currently. They go could a lot higher for all we know, and there certainly have been cases where prices remain elevated for a couple of years. It’s possible that is what we may be in for here. We’ll have to see. But eventually, we should see prices go back down to the $50-70 range for crude oil, and closer to $3 per gallon nationally. Much depends on how long the conflict between Russia and Ukraine lasts, and its impact on world oil supplies. I’m not sure if the recent surge will seep into the next inflation report due later this month, but I would not be surprised to see the year-over-year inflation rate jump to over 8% and stay there for many months, complicating the task of the Federal Reserve Board.
Watching The Top 10 S&P 500 Stocks By Market Cap
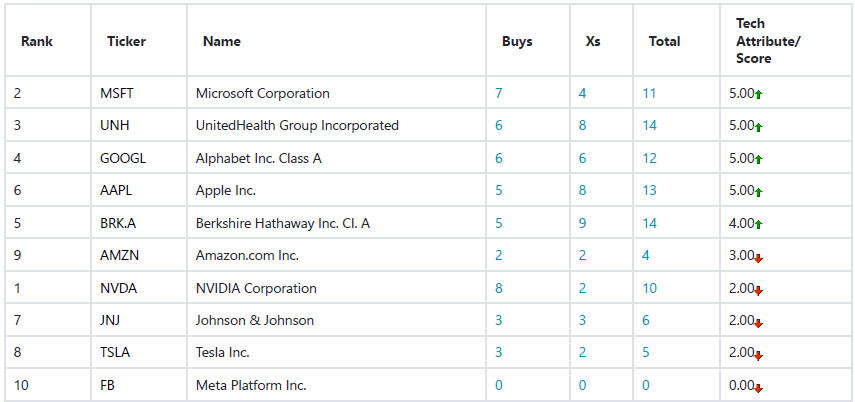
As we noted above, growth stocks in general have been performing much worse than value stocks in the recent decline. Usually in major market declines, small and mid-cap stocks decline by greater amounts than large companies. Large companies are usually the last to join the “party.” Though we’ve all grown up with the Dow Jones Industrial Average, that has become an outdated representation of stock market performance because of its ridiculous method of price weighting. Now, $trillions of dollars are indexed to the S&P 500, so it behooves one to pay attention to it. The S&P 500 is a cap-weighted index, and as a result, the top 10 companies in the index now represent over 29% of the index, led by Apple, Microsoft and Amazon.
Below, I created a custom matrix using Dorsey Wright’s relative strength matrix to evaluate the technical condition of the 10 stocks. That is shown below, where I’ve ranked the stocks by Technical Attribute.
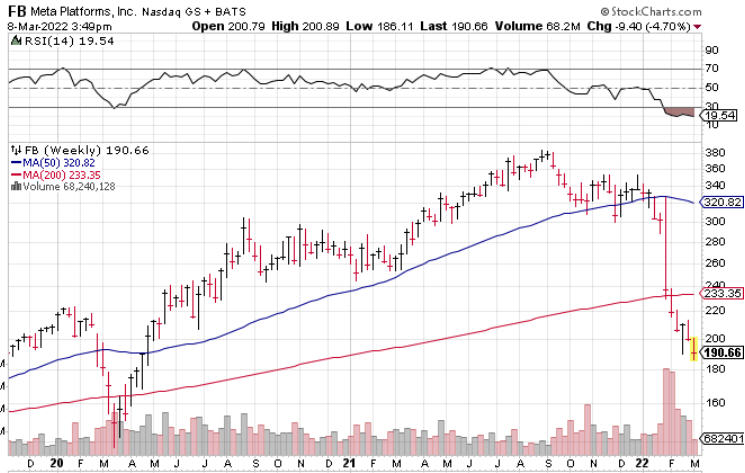
I won’t get into the nuances of the Technical Attribute Score in this update, but in simple terms stocks are ranked from 0 to 5, with 5 being best. This approach is actually at the core of the strategy we use with our fully invested stock strategy, using the S&P 100 as the universe. At present, five of the stocks are highly ranked, led by Apple, Google (Alphabet), United Health and Microsoft, while NVIDIA, Johnson & Johnson, Tesla and Meta Platform (the former Facebook) are all ranked poorly. You might be surprised to know that Amazon is currently trading below levels last seen in June 2020. Below, take a look at what’s happened to Facebook. The chart is courtesy of www.stockcharts.com.
The stock more than doubled off the March 2020 Covid lows, peaking last August above $380. It’s been cut in half, and in February dropped nearly -25% in one day after a poor outlook announcement. The technicals deteriorated in early January, well in advance of the carnage. From a fundamental standpoint, the three stocks most vulnerable in the group, based on their price/sales ratio are Microsoft, Tesla and NVIDIA, and the latter two have already been hit hard. Microsoft sells for 12 times sales, Tesla is at nearly 15 times revenue and NVIDIA is at 22 times sales. People have been wondering how much fluff is in today’s market. If Facebook and Netflix can go down -25% in one day after a poor earnings report, I think that tells you all you need to know. At some point, fundamentals matter. These are great companies, but they’re not necessarily great investments at these prices.
In an earlier update, I’d mentioned a recent research paper that studied price performance of stocks when their price to sales ratios exceeded 10. On average, the stock prices lost money going out five years. The price of oil isn’t the only thing that is cyclical. So are stock market and company specific returns. Companies can grow significantly for 5, and even 10 years. But, at some point, the law of gravity takes over. When the leaders of the S&P 500 Index begin to falter, it will matter quite a bit, as the psychology of selling will amplify the downside, just as the psychology of buying has amplified the upside. This is the nature of cap-weighted indexes.
Spiraling Up With Steve Medland
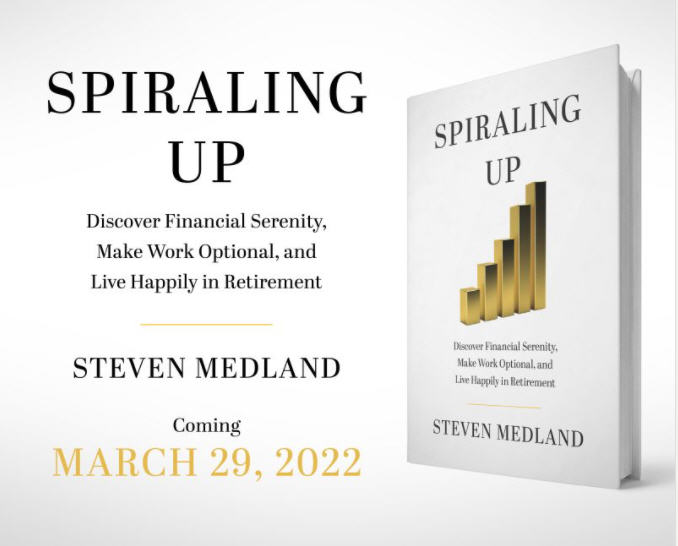
Partner Steve Medland has been working on a book for parts of the past two years, something he’s wanted to do, and it’s about to be delivered later this month. I’m not going to take away his thunder. Below is the announcement, and he’ll be introducing his thoughts and other content in next month’s update. So, look for an email from Steve about four weeks from now, on our fairly regular communication schedule. Going forward, you’ll likely hear Steve’s voice about every 4 months. Don’t worry. I’m not going anywhere. I’ll be using the extra time not spent writing in searching for adult humor that can actually pass the inspection chiefs at TABR. 🙂
A Look Back At 2021
We’ve always found it useful to look backwards and contemplate what we’ve done. This can be helpful even when things seem to be going right, but even more so when they’re not. It’s how one can make course corrections, and fix things.
Transparency has been a fixture at TABR since we were founded in 2004. The vast majority of RIAs in our business do not publish a track record. They may cite compliance issues, or the work necessary to comply with regulations, or that all their clients have “customized” portfolios. Simply put, we do publish one, because we believe in our process, and our staff backs that up by investing the vast majority of their personal savings in the exact same strategies we use for clients.
Sometimes, the numbers aren’t pretty, and other times, they are great. That is part of being in investment management. Even the best money managers in the business go through years of underperformance. We are no different. The key is, in our view, sticking with your discipline, but also having the courage to fix things when something may be amiss.
And though below you will see comparisons to industry benchmarks, ultimately we are judged by helping our clients achieve their goals, with substantially less risk than passive, buy and hold strategies. Besides our combined 57 years of financial planning and investment management wisdom, that is probably the one big difference and edge we have over competitors.
There was very little in the way of downside volatility in 2021, with the S&P 500 never falling more than -6% from a peak. Our tactical equity exposure began the year at 83%, and ended at 80%, and in between, accounts were never less than 80% invested except for 43 days. It was a year to be bullish, and our stock models were in unison except for one of the six, which kept getting whipsawed by minor fluctuations. On the bond side, our high yield bond risk model was positive for the first 11 months of the year, finally turning negative in late November. This has turned out to be a precursor to the current weakness.
When all was said and done, the S&P 500 Index climbed 28.53% for the year, while the S&P 600 (small stocks) gained 26.60%. International stocks lagged badly, with the Vanguard Total International Stock Index Fund gaining just 8.61%. Intermediate corporate and government bonds, as measured by the Vanguard Total Bond Market Index, lost -1.77%.
Stock Allocations
If you weren’t fully invested the whole year, and in the right area (think S&P 500), you lagged the stock market last year. And that pretty much sums up why our Tactical Moderate and Tactical Stock accounts lagged behind. We track a hypothetical portfolio of the three ETFs we usually own for equity exposure. We run rankings every first day of the month, and make changes accordingly based on relative strength. If one was fully invested in this portfolio, and equally rebalanced each month, you would have gained about 22.6% for the year. That actually beat the benchmark, which is a 75/25 mix of Vanguard Total Stock plus Vanguard Total International Stock Index. What’s that mean? It means our relative strength rankings were working, and all of the underperformance was due to being less than fully invested. As I intimated in last month’s update using auto insurance premiums as an example, this was the price we paid for having insurance.
At the beginning of last year, we introduced an equity exposure floor of 20%, meaning that of our overall exposure to equities, whether it be in a Conservative, Moderate or Aggressive account, we would never go below 20%. That segment is dedicated to being fully invested in five funds. Four of them are Fidelity Sector funds, and the selection of them is also based on relative strength. Funds are evaluated monthly, and replaced when they fall below a pre-determined ranking threshold. Had one equally weighted those selections each month and rebalanced, you would have earned about 21.4% for the year. That lagged the S&P 500 by about 700 basis points, and didn’t help the cause.
Our Relative Strength S&P 100 Index strategy fared much better, earning 28.04%, and essentially matched the S&P 500. A brief primer. The strategy is fully invested in stocks at all times, owning only top ranked stocks each month from our relative strength screen. It uses a similar process of ranking stocks to the process we use for ranking ETFs. This is a departure from what we emphasize—risk management. The whole goal here is to beat the market (add alpha), and maximize returns. It is aggressive. It is volatile. At some point, I fully expect there will be a drawdown of at least -50%. The vast majority of our clients are Conservative or Moderate, but some of them are interested in being more aggressive with a portion of their assets. This is for them. At present, some of our holdings include Eli Lilly, United Parcel, Abbott Labs, Conoco Phillips and Microsoft (yes, the one trading for 12 times sales!).
Speaking of a fully invested approach, that also describes our Passive Index account, which gained a respectable 12.29% for the year, using a 60% stock and 40% bond allocation. At some point, we expect this approach to lag our tactical work for more than just a few months, given stock market valuations and interest rates. But, it has its place in portfolios for those willing to stomach the greater downside in exchange for greater upside. I’m reminded of Morgan Housel’s The Psychology of Money, our Thanksgiving book from last year. In one section, he writes “My own theory is, that in the real world, people do not want the mathematically optimal strategy. They want the strategy that maximizes how well they sleep at night.” That best describes our tactical work, which is the heart of who we are.
Bond Allocations
TABR’s Bond Account beat its benchmark by over 400 basis points in 2021, earning a 2.49% return compared to a -1.77% loss for the Vanguard Total Bond Index Fund. The yield on the 10-year Treasury Note jumped 60 basis points during the year, rising from 0.91% to 1.51%. Higher rates usually mean lower bond prices, with the amount determined by duration. In contrast, all of our funds/strategies made money, with PIMCO Income gaining 2.61%, Sierra Strategic Income eking out a 0.58% gain, and all of our high yield positions, which ranged from Blackrock to Prudential to PIMCO, Putnam, MFS and Franklin. We sold 50% of those positions in late November, with the cash going to short term funds and entered the year in a 50/50 split position. That changed on January 31, when all high yield positions were completely eliminated.
Below is the performance, net of management fees, of TABR’s six different portfolios at present. These represent a majority of the strategies we are using in client accounts, but not all. The differences are mainly attributed to risk (example—moderate allocation versus conservative allocation or aggressive) and account size. The numbers are for the one year ending December 31, 2021.
| Type of Account/Strategy | 2021 Return | Benchmark |
| TABR Tactical Moderate | 7.78% | 10.93%* |
| TABR Tactical Conservative | 6.16% | 6.31%** |
| TABR Bond Account | 2.49% | -1.77%*** |
| TABR Passive Index Mix | 12.29% | 12.09%***** |
| TABR Tactical Stock Strategy | 13.25% | 21.34%****** |
| TABR Relative Strength OEX S&P 100 | 28.04% | 28.53%**** |
| Vanguard Total Stock Market Index | 25.59% | n/a |
| Vanguard Total International Stock Index | 8.61% | n/a |
| Vanguard Total Bond Market Index | -1.77% | n/a |
| Vanguard S&P 500 Index Fund | 28.53% | n/a |
*consists of 41.25% Vanguard Total Stock Index, 13.75% Vanguard Total International Stock Index and 45% Vanguard Total Bond Index
**consists of 26.25% Vanguard Total Stock Index, 8.75% Vanguard Total International Stock Index and 65% Vanguard Total Bond Index
***Vanguard Total Bond Index
****Vanguard S&P 500 Index Fund
*****consists of 45% Vanguard Total Stock Index, 15% Vanguard Total International Stock Index and 40% Vanguard Total Bond Index.
******consists of 75% Vanguard Total Stock Index and 25% Vanguard Total International Stock Index
Some Insights on the Russia / Ukraine War
I can’t do justice to what is going on in Ukraine and Russia. It is pretty much unimaginable to all of us who have been born in the United States and live here. I consider myself so lucky, and thank God for that. He is the one who put me here. There is endless media coverage of this, and I pray that it will end soon, but that doesn’t seem likely. For all we know, World War III may be around the corner.
If you’d like some first person insights to what is going on, I’ve provided a link below to a series of articles recently written by money manager Vitaliy Katsenelson, who resides in Denver. I don’t know Vitaliy, but we have corresponded briefly in the past. He is an excellent writer, and I read almost everything he produces. He grew up in Russia, so he has a perspective that few of us do. If you want to understand what is going on in Russia, I highly recommend reading his series.
War in Ukraine: Why I Was Blindsided, Part 1
Material Of A Less Serious Nature
With all that is going on in the world, I felt that a double dose of laughter was in order. Here goes.
Roger, a wealthy 70-year-old widower, shows up at his country club with a breathtakingly beautiful young woman. She hangs on to Roger’s arm and listens intently to his every word.
His buddies at the club are besides themselves. At the very first chance they corner him and ask, “Roger, you old dog, how did you manage to that trophy girlfriend?”
Roger replies, “Girlfriend? She happens to be my trophy wife.”
They’re all amazed. “How did you persuade her to marry you?” they asked.
Roger replies, “Oh, it was easy. I just lied about my age.”
Then his pals ask with a chuckle, “So what did you tell her, you were only 50?”
Roger smiles and says, “No, I told her I was 90.”
The S&P 500 closed at a new low for the year today (Tuesday). Major league baseball has canceled the first week of the regular season, and maybe more by the time you read this. The Russia /Ukraine war is just awful. So, I’m looking for silver linings. How about Covid and Omicron are almost a distant memory, people are getting out, not having to wear masks, and getting on with their lives. That’s a great thing. And my Dallas Stars are 5-0-1 in their last 6 games and have entered the playoff picture. Maybe they’ll get to the Stanley Cup Finals again, when I can actually be there. My 49ers gave me and our son Adam unbelievable thrills and then sadness in losing to the Rams in the NFC Championship Game. If we look, there’s always something to be grateful for. At TABR, that would be you, our clients. Thank you for being with us.
Sincerely,
Bob Kargenian, CMT
President
TABR Capital Management, LLC (“TABR”) is an SEC registered investment advisor with its principal place of business in the state of California. TABR and its representatives are in compliance with the current notice filing and registration requirements imposed upon registered investment advisors by those states in which TABR maintains clients. TABR may only transact business in those states in which it is notice filed, or qualifies for an exemption or exclusion from notice filing requirements.
This newsletter is limited to the dissemination of general information pertaining to our investment advisory/management services. Any subsequent, direct communication by TABR with a prospective client shall be conducted by a representative that is either registered or qualifies for an exemption or exclusion from registration in the state where the prospective client resides. For information pertaining to the registration status of TABR, please contact TABR or refer to the Investment Advisor Disclosure web site (www.adviserinfo.sec.gov).
The TABR Model Portfolios are allocated in a range of investments according to TABR’s proprietary investment strategies. TABR’s proprietary investment strategies are allocated amongst individual stocks, bonds, mutual funds, ETFs and other instruments with a view towards income and/or capital appreciation depending on the specific allocation employed by each Model Portfolio. TABR tracks the performance of each Model Portfolio in an actual account that is charged TABR’s investment management fees in the exact manner as would an actual client account. Therefore the performance shown is net of TABR’s investment management fees, and also reflect the deduction of transaction and custodial charges, if any.
Comparison of the TABR Model Portfolios to the Vanguard Total Stock Index Fund, the Vanguard Total International Stock Fund, the Vanguard Total Bond Index Fund and the S&P 500 Index is for illustrative purposes only and the volatility of the indices used for comparison may be materially different from the volatility of the TABR Model Portfolios due to varying degrees of diversification and/or other factors.
Past performance of the TABR Model Portfolios may not be indicative of future results and the performance of a specific individual client account may vary substantially from the composite results above in part because client accounts may be allocated among several portfolios. Different types of investments involve varying degrees of risk, and there can be no assurance that any specific investment will be profitable
For additional information about TABR, including fees and services, send for our disclosure statement as set forth on Form ADV from us using the contact information herein. Please read the disclosure statement carefully before you invest or send money.
A list of all recommendations made by TABR within the immediately preceding one year is available upon request at no charge. The sample client experiences described herein are included for illustrative purposes and there can be no assurance that TABR will be able to achieve similar results in comparable situations. No portion of this writing is to be interpreted as a testimonial or endorsement of TABR’s investment advisory services and it is not known whether the clients referenced approve of TABR or its services.

