Making Sense Out Of The Unsensible
If you’ve been trying to understand why the stock market has been rallying strongly in the face of the highest unemployment rate in 90 years, you’re not alone. The disconnect between Wall Street and Main Street has been palpable, but that’s nothing new.
Though not a perfect indicator, stocks tend to lead the economy by several months. The collapse that began in mid-February was the fastest decline in history. It portends terrible earnings for likely the remainder of 2020. Since March 23, in hindsight the bottom for now, stocks in general have retraced a significant portion of the decline, to where large cap indexes are down only slightly, and some are actually up. That’s not the case, though, for the majority of the stock market.
Is the worst over? We don’t think so, but anything is possible. This gives us the opportunity to touch on several relevant topics. One is the concentration of just a few stocks leading the indexes. Is this good or bad? We’ll discuss why WHAT you own is as important as HOW MUCH you own. This conveniently delves into our own use of relative strength rankings, and why to us this makes the question of growth vs value, or large vs small, or domestic vs international, pretty much a moot point.
Finally, we’ll touch on Seasonality, the positive implications of some breadth thrust indicators, balanced by the negative implications of valuations, along with Panic & Euphoria. And ladies, we’ve not let you down. I promised a joke that would make fun of men, to balance last month’s “story.”
Portfolio Positioning
With stocks continuing their rally in the month of May, a couple of our stock market risk models have turned positive, so our tactical equity allocations bumped to about 36% last week, and are now at 50% as of Monday’s close on June 1. This puts us more in a neutral stance. That could change right back to the 36% level next week if this week’s tape action turns negative.
Normally, stock market tops and bottoms are processes, that take place over several weeks or even months, and the vast majority of our models are not designed for the rollercoaster that has taken plus thus far. The models all exited in fairly rapid succession, but the rapid recovery with no re-test (thus far) has left several of them on the sidelines.
There was no follow-through to the SELL signal from our high yield bond fund risk model on April 27, and this model reversed back to a BUY last week on May 26. Spreads in the corporate bond market have narrowed considerably since the Fed first announced their intentions of intervening in markets on March 23, and strength in prices across the board has continued since the Fed actually started purchasing bonds and ETFs approximately two weeks ago.
This has left many wondering, including myself, what’s going to happen to financial markets when the Fed steps away? I already know what’s likely to happen. They’re going to fall precipitously, just as they have in previous instances when the Fed has removed their support, such as in the fall of 2018. The Fed cannot backstop markets forever. Or, can they? And if they do, what are the implications? More on that later.
The Concentration In Large Cap Indexes. Good Or Bad?
There are 500 companies in the S&P 500 Index, but they are hardly equal when it comes to how the index is constructed. The index, like many others, is capitalization-weighted, so larger companies have more influence on the index than smaller entries. The biggest five are Microsoft, Apple, Google, Amazon and Facebook, and together, they comprise over 20% of the index. This is the most in the last 30 years, even more so than in the technology/internet bubble of 1999, and is aptly illustrated in the chart below courtesy of The Leuthold Group.
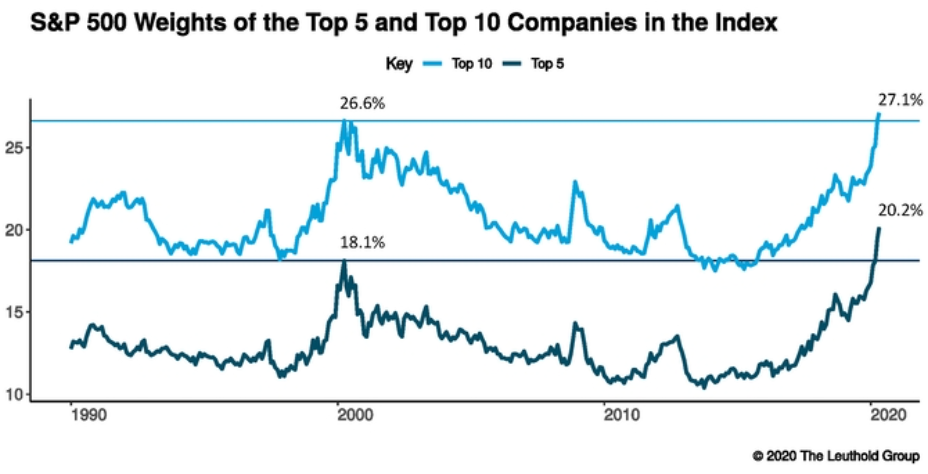
Their weighting is as big as the bottom 350 companies in the index combined. There is a similar issue with the NASDAQ Composite, where the top 10 stocks account for 44% of all the value in the 2700-stock index. Apple, Amazon and Microsoft are included in those 10 as well. The last time concentration in indexes was this high was in the 1999-2000 time period, and if you recall, that did not end well, with the NASDAQ dropping -80% and the S&P 500 almost -50% in the three years ended 2002. How is this going to end? It is hard to know. One data point doesn’t make it a strong bet. But the extremes are very reminiscent of that time period. The S&P 500 Equal-Weight Index is at an 11-year relative strength low versus the cap-weighted measure. This also means that small and mid-sized companies are getting much cheaper relative to their larger brethren. Comparisons such as these are also part of the wide disparity in growth versus value comparisons. For instance, the Russell 1000 Growth Index has gained +5.75% for the year, while the Russell 1000 Value Index is down -15.24%.
For now, as Apple and Microsoft go, so goes the large cap indexes. Watch them. But don’t assume that these five or ten stocks can go on forever. If this concentration continues, they will eventually fall of their own weight, or more likely, the government will step in and break them up, as being “too big.” Ten years ago, two of the largest 10 stocks were Exxon and General Electric. Things change in the world. Look at the chart below of Exxon, courtesy of www.stockcharts.com.

Though an investor has certainly earned dividends over the past 10 years, the stock price is actually below that of 10 years ago. It’s a similar story for GE. If history is any guide, some of today’s 10 largest stocks will be losers in the next 10 years. The world will change, and they won’t. Individual stock picking is not easy. Now you’ll know why I cringe when a client calls up with an idea for their account, and says something like “I just want to put it away for the next 5 years.” Maybe one will get lucky. But, would you not attend to your garden for five years?
Market Seasonality
We’ve now entered into the weakest six-month period of the year, from May 1 to October 31. According to Dorsey Wright & Associates, since 1950, the Dow Jones Industrials has averaged a “gain” of just 0.65% in this period, compared to average gains of 7.22% from November 1 to April 30. We have similar data on the S&P 500 going back to 1985. This doesn’t guarantee that stocks will go down in the next six months. In fact, in the 70 cases since 1950, the Dow has actually shown a gain in 43 instances. But, on average, there has been little money to made in the period. Why is that? No one has ever offered an explanation that really makes sense, especially since this phenomenon did not work from 1926 to 1950. Though I’ve certainly been enamored with this data in the past, and do keep up with it, and have even authored articles about it, I would prefer to base decisions of allocating capital on what the market is actually doing, not on the calendar. I consider seasonality to be a secondary indicator.
The Good—Breadth Thrusts
Since late March, there has been strong upside momentum in the stock market, and various indicators such as upside versus down volume, advances versus declines, price thrusts and others have generated positive signals. Even though the S&P 500 Index is up over 35% from the March 23 low, there is still evidence of short to intermediate demand. On May 26th, the 50-day moving average signal gave a breadth thrust. Ned Davis Research maintains a database of institutional grade common stocks, and nearly 92% have risen above their 50-day moving average. See the chart and data below, courtesy of www.ndr.com.

This has taken place only 19 times since 1970, so unfortunately that is not statistically significant. In all prior cases, stocks were higher a year later with median gains of over 16%, nearly double the norm. There was also just one loss after six months. Despite all the terrible economic news, this has to be considered a positive. A different thrust indicator developed by money manager James Stack of Investech Research triggered in early April. Stack compared advances over declines over a five-day period, with a 2.5 ratio threshold. Ned Davis Research was able to take this concept back to 1950, and found 38 prior cases. However, I discarded 6 of them for overlap where they took place within 3 months of a prior signal. Still, there were 32 data points, and that is a lot more valid. In only two cases, 1974 and 2011, were stocks lower one year later, for a 30 out of 32 batting average. The S&P 500 is already up 10.6% since the signal on April 9, and median gains have been over 20% one year out, virtually double the market’s averages. These are definitely on the plus side for stocks.
The Bad—-Valuations and Euphoria
I’ve written many times that valuations are a terrible timing tool. They are more helpful in assessing risk in the market. Based on the Value Line Price/Earnings Ratio (see the chart below courtesy of Ned Davis Research), stocks reverted to being “cheap” for about one week in late March, and then poof. They have been rebounding ever since.
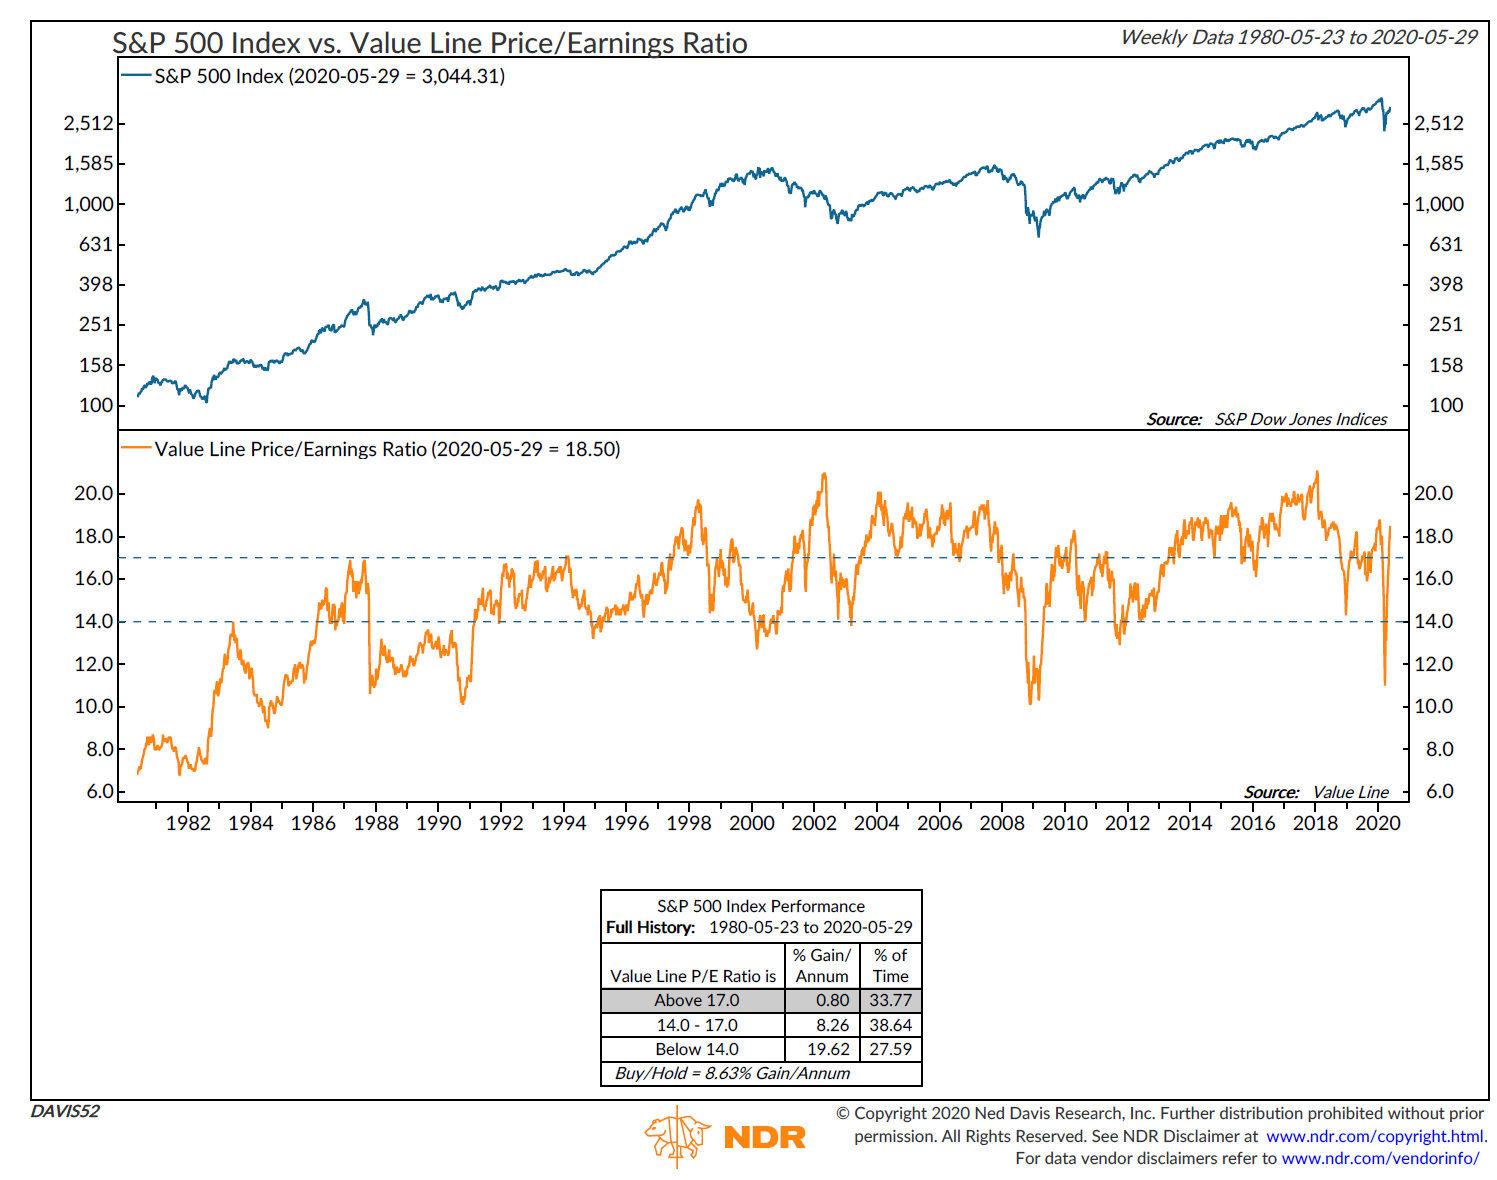
In fact, after getting to the cheapest level in 11 years, stocks have rebounded so much that in the present mode, the S&P 500 has averaged less than 1% per annum in the last 40 years. So, this suggests the vast majority of the rebound is over.
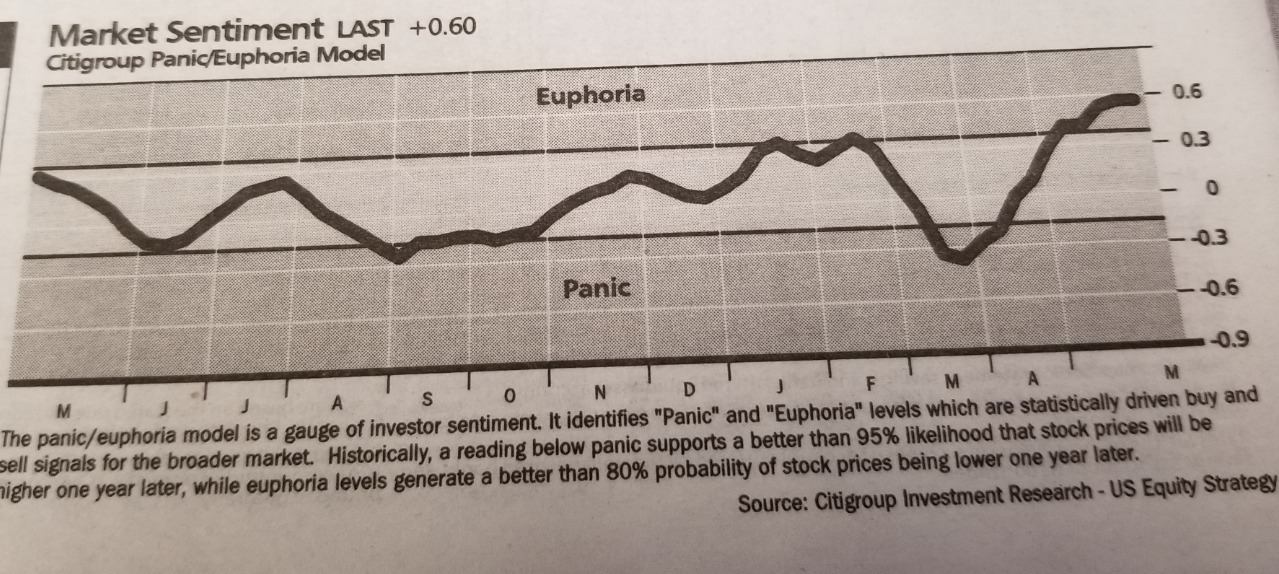
Another warning sign is a sentiment indicator developed by Citigroup, which is published each week in Barron’s, called the Citigroup Panic / Euphoria Model. As the footnote suggests, the panic and euphoria levels are statistically driven buy and sell signals for the broader stock market. Euphoria levels generate a better than 80% probability of stock prices being lower one year later. This indicator, shown below, has gone from Euphoria, to Panic, back to Euphoria in less than four months and is in fact suggesting more optimism than was present at February’s market peak.
We’ve presented some bullish evidence, as well as some bearish evidence. No one knows how this will play out, so we’ll adjust as the evidence changes. As blogger Ben Carlson recently wrote, “The stock market is often a confusing place and we live in confusing times.”
What You Own Is As Important As How Much
There continues to be considerable debate about growth stocks doing better than value, large stocks doing better than small, and domestic stocks (U.S.) doing better than international. We have no idea when these relationships will change, and candidly, as we’ve written in the past, we really don’t care. That is because we believe that when it comes to selection processes, using relative strength is the superior choice, and makes the debates irrelevant.
Simply, own the areas that are doing the best, and sell them when they begin to underperform. Below is a glimpse into the process we use to decide what we own. Valuations have nothing to do with it. It is all price-based. We look at 22 broad-based indexes, and rank them every month. Below, I’ve listed the top four from the month-end rankings, along with the bottom four, and shown their past performance over the last 26 weeks and 52-weeks.
| Ticker | Name | 26-Week Rate of Change | 52-Week Rate of Change |
| QQQ Top 4 | Invesco QQQ Trust | 14.26% | 30.01% |
| IVW | IShares S&P 500 Growth | 5.91 | 14.91 |
| IUSG | IShares Core S&P Growth | 5.07 | 13.89 |
| OEF | IShares S&P 100 | -1.05 | 10.49 |
| IEV Bottom 4 | IShares Europe | -16.60 | -11.21 |
| IJR | IShares Core S&P SmallCap | -19.57 | -14.11 |
| IJJ | IShares S&P MidCapValue | -22.34 | -16.02 |
| IJS | IShares S&P SmCap Value | -26.58 | -20.52 |
In the last year, and beyond, it truly has been a tale of different stock markets. Owning large company growth stocks has been where all the returns have been. At some point, this will change, and the transition will not be pretty, but the process is dynamic and will adapt to whatever leadership the market creates.
My Rant On Moral Hazard
In March, the Federal Reserve Board saved the bond market. And, by those actions, they also saved the stock market. Saved them from what? Perhaps, going to where they would naturally go. In the last 15 years, the Fed has been intervening in financial markets more than ever before, and it is likely this is permanent. Not only do investors have to live with it, they have to adjust to it. In my view, this is not necessarily good for investing. They have created what in economics is known as moral hazard.
Moral hazard is a situation where one party gets involved in a risky event knowing it is protected against the risk and the other party will incur the cost. In today’s market, the “other” party is the Fed. The Fed has been buying all sorts of corporate and municipal bond assets, along with government bonds, and when the next shoe drops, it will not be surprising if they start to buy stocks or stock index futures to backstop markets.
This is not good for markets. With interest rates at zero on Fed Funds, lower risk-free rates imply lower absolute expected returns for risk-free and risky assets. As fund manager John Hussman recently wrote, “When it comes to buying overvalued assets, you don’t get to have your cake and eat it too. If you want to protect overvalued prices, you also have to accept meager long-term returns.”
Recently, Feliz Zulauf, founder of Zulauf Asset Management and a long-time member of the Barron’s roundtable, had some comments on this subject, and I found myself thinking exactly what he was saying. Below are a couple of excerpts from a recent interview.
“Today, we are headed towards more and more government intervention and less and less freedom and free markets. This is not a climate for structurally increasing prosperity. And over time, this expresses itself in financial markets. That’s why I advise investors to behave opportunistically.
“What also concerns me is the short-term thinking of managers who have inflated their companies with debt to finance share buybacks. It is simply negligent. These managers should be fired. There is a lack of personal responsibility everywhere, not just among managers. Our entire society has forgotten how to take responsibility. We have forgotten that life consists of setbacks and that you have to have safety margins for difficult times. We live in a spoiled society where people think they are entitled to a wonderful life. Well, this right does not exist in reality. And the constant cry for help to central banks and governments whenever it rains will gradually cost us freedom and prosperity.”
Material Of A Less Serious Nature
An old rancher in Montana hates to wear his seatbelt. One day he’s driving on the highway with his wife and sees a state patrol car behind him. He says to his wife, “Quick, take the wheel. I have to put my seatbelt on. As he’s putting on the seatbelt the patrol car flashes its lights and the two cars pull on to the shoulder.
The patrolman walks up to the car and says, “I noticed you weren’t wearing your seatbelt.”
“I was wearing it,” said the rancher. “If you don’t believe me, ask my wife. She’s a good Christian woman who hasn’t told a lie in her life.”
“Well, how about it ma’am?” asked the patrolman.
“I’ve been married to Buck for 35 years, officer, and the one thing I’ve learned in all that time is this: you never argue with him when he’s drunk.”
I don’t think I ever imagined writing these words. The Stanley Cup Playoffs are about to begin . . .in July. I’m not sure how I might feel if my Dallas Stars win the Cup, with no fans in the arena. But, at least the NHL is going to play. Maybe I can sneak into the arena, somewhere, as an Equipment Manager. Meanwhile, it’s early June and the Angels are undefeated. Yes, they haven’t played a game yet, and might not. Go ahead. Cancel the season. All the hockey fans will say “Puck Them!”
Finally, I’m struggling for words to describe the events of the past week or so in our nation, and what I’m thinking. The issues of racism and police behavior have been ignored for far too long. I hope that’s not the case going forward. I wish I had answers. For now, stay safe, and be kind to everyone you meet. And say lots of prayers.
Sincerely,

Bob Kargenian, CMT
President
TABR Capital Management, LLC (“TABR”) is an SEC registered investment advisor with its principal place of business in the state of California. TABR and its representatives are in compliance with the current notice filing and registration requirements imposed upon registered investment advisors by those states in which TABR maintains clients. TABR may only transact business in those states in which it is notice filed, or qualifies for an exemption or exclusion from notice filing requirements.
This newsletter is limited to the dissemination of general information pertaining to our investment advisory/management services. Any subsequent, direct communication by TABR with a prospective client shall be conducted by a representative that is either registered or qualifies for an exemption or exclusion from registration in the state where the prospective client resides. For information pertaining to the registration status of TABR, please contact TABR or refer to the Investment Advisor Disclosure web site (www.adviserinfo.sec.gov).
The TABR Model Portfolios are allocated in a range of investments according to TABR’s proprietary investment strategies. TABR’s proprietary investment strategies are allocated amongst individual stocks, bonds, mutual funds, ETFs and other instruments with a view towards income and/or capital appreciation depending on the specific allocation employed by each Model Portfolio. TABR tracks the performance of each Model Portfolio in an actual account that is charged TABR’s investment management fees in the exact manner as would an actual client account. Therefore the performance shown is net of TABR’s investment management fees, and also reflect the deduction of transaction and custodial charges, if any.
Comparison of the TABR Model Portfolios to the Vanguard Total Stock Index Fund, the Vanguard Total International Stock Fund and the Vanguard Total Bond Index Fund is for illustrative purposes only and the volatility of the indices used for comparison may be materially different from the volatility of the TABR Model Portfolios due to varying degrees of diversification and/or other factors.
Past performance of the TABR Model Portfolios may not be indicative of future results and the performance of a specific individual client account may vary substantially from the composite results above in part because client accounts may be allocated among several portfolios. Different types of investments involve varying degrees of risk, and there can be no assurance that any specific investment will be profitable.
The TABR Dividend Strategy presented herein represents back-tested performance results. TABR did not offer the Dividend Strategy as an investment strategy for actual client accounts until September/October 2014. Back-tested performance results are provided solely for informational purposes and are not to be considered investment advice. These figures are hypothetical, prepared with the benefit of hindsight, and have inherent limitations as to their use and relevance. For example, they ignore certain factors such as trade timing, security liquidity, and the fact that economic and market conditions in the future may differ significantly from those in the past. Back-tested performance results reflect prices that are fully adjusted for dividends and other such distributions. The strategy may involve above average portfolio turnover which could negatively impact upon the net after-tax gain experienced by an individual client. Past performance is no indication or guarantee of future results and there can be no assurance the strategy will achieve results similar to those depicted herein.
Inverse ETFs
An investment in an Inverse ETF involves risk, including loss of investment. Inverse ETFs or “short funds” track an index or benchmark and seek to deliver returns that are the opposite of the returns of the index or benchmark. If an index goes up, then the inverse ETF goes down, and vice versa. Inverse ETFs are a means to profit from and hedge exposure to a downward moving market.
Inverse ETF shareholders are subject to the risks stemming from an upward market, as inverse ETFs are designed to benefit from a downward market. Most inverse ETFs reset daily and are designed to achieve their stated objectives on a daily basis. The performance over longer periods of time, including weeks or months, can differ significantly from the underlying benchmark or index. Therefore, inverse ETFs may pose a risk of loss for buy-and-hold investors with intermediate or long-term horizons and significant losses are possible even if the long-term performance of an index or benchmark shows a loss or gain. Inverse ETFs may be less tax-efficient than traditional ETFs because daily resets can cause the inverse ETF to realize significant short-term capital gains that may not be offset by a loss.
For additional information about TABR, including fees and services, send for our disclosure statement as set forth on Form ADV from us using the contact information herein. Please read the disclosure statement carefully before you invest or send money.
A list of all recommendations made by TABR within the immediately preceding one year is available upon request at no charge. The sample client experiences described herein are included for illustrative purposes and there can be no assurance that TABR will be able to achieve similar results in comparable situations. No portion of this writing is to be interpreted as a testimonial or endorsement of TABR’s investment advisory services and it is not known whether the clients referenced approve of TABR or its services.