Max Protect
With approximately 7 minutes left in the game last Sunday at SoFi Stadium, a 17-17 tie between my 49ers and the LA Rams, Jimmy Garoppolo and his offense had a chance to take the Niners to the Super Bowl for the 2nd time in 3 seasons. But, the offensive line failed to give him enough time to throw at the most critical part of the game, and the 49ers season went up in smoke. This also happened with less than 2 minutes left in the game, where a field goal would have tied the game, and a touchdown would have won the game.
What’s this got to do with today’s stock market? Everything. When Jimmy G needed protection, it wasn’t there. Investors may be wondering where their protection is after major stock indexes have declined anywhere from -10% to -15% from their peaks in less than a month’s time in some cases.
This creates an opportunity to remind you of our process for handling negative environments, and what we’re doing. In the last 3 weeks, our portfolios have gone from 80% tactical equity exposure to Max Protect mode. In football, Max Protect is where the offensive team keeps a larger number of players (tight end, running back) sitting back in pass protection in order to prevent the quarterback from getting sacked and to give him enough time to make a completion. In financial markets, we call it risk management. Read on.
Nobody Likes Cold Medicine
We’ve all had a cold, or a bad cough. Ever take Robitussin? I don’t care if it’s cherry or grape, it almost makes you gag. And at least for me, Vicks Nyquil DOES make you gag. But, they work. Eventually.
In financial markets, we’re taught—don’t sell. You can’t time the market. Stocks always come back. Maybe that’s true, and maybe it’s not. It’s certainly not easy to beat the market, nor to time the market. The problem is, we’re all human, and you can’t ignore the noise, or in this case, significantly falling prices. For some context, below is a table which shows the maximum intra-year drawdowns (losses) of the S&P 500 Index going back to 1928. This data is courtesy of the Compound @Charlie Bilello.
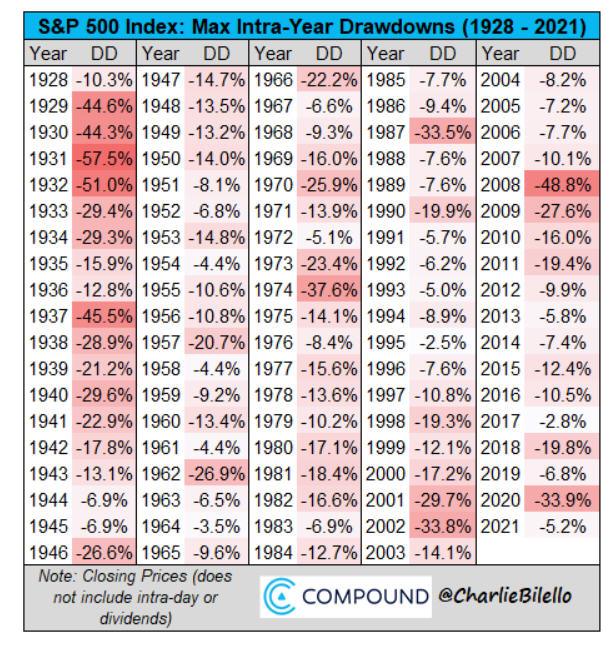
On average, an investor in the S&P 500 has experienced a median -13% plus loss at sometime during the year, with a low of -2.5% in 1995 and a high of -57.5% in 1931. Last year, there was hardly any down volatility, with not even a -6% decline. From 2012 to 2017, there wasn’t even a -20% decline. It’s pretty easy to do nothing but be a passive investor when you have a six-year period like that. But, 2020 along with 2008-09, not so much. Most investors can’t ride bear markets down and hold onto their positions until the market fully recovers. Some can, but most can’t. Why?
Uncertainty. Fear of the unknown. What if the -25% loss turns into -40%? Or worse? In practice, this is quite difficult. And, it’s especially true for investors who are near retirement, or already in retirement. A significant bear market can really alter the best laid retirement plans. Which is why we believe that for a large portion of most client portfolios, one should utilize an investing process that is durable enough to handle both up and down markets. In general, we believe clients should only take the amount of risk necessary to achieve their goals.
Risk Management Is Like An Auto Insurance Premium
There are tradeoffs with every investment strategy. With passive investing, you get all of the good and all of the bad. With tactical risk management, you get some of the good and some of the bad. You can’t have it both ways. You can, though, combine such strategies which we do for a number of clients. It just depends on the client and their goals/risk tolerance.
We’re currently using five stock market risk-management models. At present, all five are negative, a condition which in the past, both hypothetically and in real-time, stocks have on average lost money. In 2020 when Covid hit, the S&P 500 peaked at 3386 on February 19. It took until March 2 before all five models flipped negative, at an average price of 3024, which was nearly -11% from the peak. Consider that your premium. Even with risk management, one will suffer losses, but they won’t be as severe as a buy and hold approach.
In March of 2020, stocks went on to decline all the way to 2237, another -26% down. We had no way of knowing that at the time. You never do. We just followed our process, because the really big declines almost always take place after our models have turned negative. One of the tradeoffs is that often, the models get you back in at a higher price than where you sold. There may be months where stocks go up, and our portfolios barely make any money. Conversely, there can be months where stocks are down significantly, and our portfolios hardly suffer at all. Like now, that’s when we’re in Max Protect mode. I should note we do have a 20% floor represented by sector funds and a total stock index fund. This means, for example, that for Moderate risk accounts which have 55% allocated to stocks if fully invested, their current stock exposure is about 13%, plus 4% in a gold ETF.
The recent progression of SELL signals from our stock models has been as follows. The first flipped on December 1. The second turned negative January 18, followed by another on January 19. Then the fourth on January 24 and the final one January 31. The S&P 500 peaked on January 3 at 4796, and the average closing price of the index from our 5 sell signals is 4509, which is about -6% off the top. The index was down nearly -10% at its lowest close on January 26, but currently resides at 4500, essentially the same level as the average of our SELLS, though I should note we have owned other ETF’s such as the Nasdaq 100 QQQ for recent stock market exposure.
Consider the -6% from the top your premium. From here, we have no certainty of what will happen. How deep the decline will be, nor how long it will last. Nobody does. All we can tell you is that a host of technical evidence suggests a more negative outlook at present. Our high yield bond risk model is also negative, with the more sensitive version turning red in late November, and the “more leeway” version turning negative on January 31. Interest rates are rising, and credit spreads are widening. That’s not a good combination. In sum, both the stock market and high yield bond market are vulnerable to significant declines from present conditions. That doesn’t mean they’ll happen, but the odds have increased.
Unlike Jimmy G’s offensive line along with the crappy play calling from Coach Kyle Shanahan during crunch time, we’ve got your back. We’re in Max Protect mode until more favorable conditions develop.
Where’s A Good Place To Buy?
A week ago, stocks got very oversold on a short term basis, and predictably, they rallied. The S&P 500 gained nearly 7% in four days before getting hammered on Thursday after Facebook reported a lousy outlook, with the stock losing -25% of its value in one day. This is what happens when stocks are overvalued and the psychology changes.
There may, or may not be more rally ahead, but we’re operating under the assumption that stocks have peaked, and it’s more a question of how far are they going to go down? From an intermediate perspective, stocks are NOT oversold. Below is the weekly chart of the S&P 500 going back five years.

Focus on the Relative Strength Indicator in the top clip, known as the RSI. The chart is courtesy of www.stockcharts.com. I’ve circled the areas of the last two major bottoms, in December 2018 and March 2020, when the RSI reached, or went below the key 30 level. Currently, the RSI (upper right of the chart) is just below the 50 level. In order for the RSI to go below 30, prices are going to have to go much lower from here. At some point, this WILL happen, but we don’t know when.
There’s another indicator we track, and have featured before, that is more rooted in fundamentals. It’s called the Value Line Median Appreciation Potential, or VLMAP. The research firm Value Line out of NY has been publishing this indicator since 1966. Each week, the analysts at Value Line estimate the future earnings projections for 1700 companies 3 to 5 years out, along with their estimated future price/earnings ratios. The ratio of these two is called the MAP.
The indicator has ranged from a low of 13% in 1966 to a high of 255% in 1974. When you look at history, 1966 was a terrible time to buy stocks (hence, the lower the percentage, the more negative the outlook, and vice versa), while late 1974 was a tremendous time to buy stocks. Like many valuation indicators, it’s not at all perfect for timing. Especially on the sell side. The indicator has been between 25 and 50 for most of the past 3 years, and all stocks did was go up. However, during the Covid panic in March 2020, the VLMAP soared to 145%, and that was a great indication of bargains.
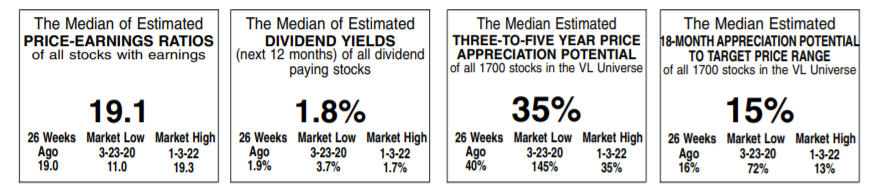
Above is the recent reading at the market peak on January 3, where the indicator was at 35%. With the recent drop in prices, the level has increased to 45%. Ned Davis Research has done some analysis with the indicator going back to 1980, showing that the indicator needs to get to around the 90 level at a minimum before one can get really interested in buying.
As noted, two years ago it went to 145, so if you jumped in at 90, you would have suffered some temporary pain. Alas, there’s no perfect method. My point is, though, to get to at least the 90 level, prices will have to drop quite a bit from current levels. How much? That’s hard to know. My guess is at least another -20%.
Another form of analysis is to measure the price advance of the bull market, and assuming it’s over, compute percentage retracements. Common levels that technical analysts look at are 38%, 50% and 62%, corresponding with Fibonacci ratios. If in fact the bull market is over (and I think it is, but that does not matter), a 50% retracement would go to 3517, and a 62% retracement to 3215. The former is another -22% down from here. Just so you know, there are a few portfolio managers out there, some of who get a decent amount of press, who are calling for at least a -50% decline from the peak, which would wipe out the entire gains from the Covid lows.
It’s hard to ignore the noise, isn’t it? We’ll let the market tell us where it’s going, and right now, the message is this is the most risky environment in at least 5 years. We’re proceeding accordingly, but just following our process.
New RMD (Required Minimum Distribution) Rules/Tables
In November of 2020, the IRS released new proposed life expectancy tables which are used for calculating required minimum distributions (RMDs) from IRA and employer retirement plans. These tables finally went into effect on January 1, 2022, and every person subject to an RMD will be affected.
In essence, life expectancies have increased, so the IRS felt it was time to update the tables, which had been in effect for 20 years. The changes are not drastic, but the overall effect is that the slight alterations to the tables will result in somewhat smaller RMDs for almost all investors.
For instance, last year was a good year for investors, and returns for the vast majority of clients exceeded their RMD withdrawals for 2021. One would think, then, that they would have to take out more in 2022. A number of clients who are on an automatic process that simply adjusts to the proper new amount for the next year called us and Sylvia Bazan, who handles almost all of the payouts for clients, wondering why their January payout was less than last year’s?
And, the reason is because the tables have been adjusted. All of you subject to an RMD, this is what has changed.
So Long, Mary!
As we’ve communicated in the past two months, our long time Office Manager and Client Services Specialist, Mary Hernandez, was going to be retiring after 21 years with TABR. Her last day was January 14, though she remains available to all of us, including Tracy Curtis, her successor.
Mary and I have known each other since the spring of 1977, when we were both sophomores at the College of Sequoias in Visalia, CA. We actually met at scholarship interviews, and if my memory serves me correctly, she won and I didn’t. She went north and attended Fresno State University, earning her Bachelor’s in Finance, while I went south to Cal State Fullerton, earning my Bachelor’s in Sports Administration.
After Fresno State, Mary met her husband, Richard Hernandez, during the time when they were both auditors at the old Security Pacific National Bank. They eventually settled in the Corona/Chino area before moving to Placentia, and we kept in touch over time. She spent some 20 years at the Bank of America, eventually running an audit department, before I enticed her to join me at Prudential Securities in 2000 while we were commuting to the Newport Beach office. Soon after, Mary recommended that I also hire Sylvia, who had worked with Mary at Bank of America. I did that as well, and those are two of the best decisions I’ve ever made.
Husband Richard expects to retire this summer from his position at Union Bank, joining Mary in retirement. Just over a week ago, Mary and Richard welcomed their third grandchild from daughter Erin into the world, granddaughter Morgan, and Mary is currently busy helping Erin in Tulare with all three of her kids, including grandsons Weston and Grayson, not to mention Erin’s husband, Daniel, who has a 10-year-old daughter. Retirement? Haha.
Last week, when 49ers quarterback Jimmy Garoppolo had what is likely his final press conference as a Niner (yes, they’re going to trade one of the best quarterbacks in the NFL because they can’t afford him), Jimmy went out with the most class any fan would want of a player they root for. He said, “It’s been a hell of a ride. I love you all.” And that sums up how all of us at TABR feel about Mary. Thank you for all you’ve done, dear friend.
A Little Titan Baseball
Last Friday and Saturday were a special two days for me, given my long time involvement with Cal State Fullerton baseball. Friday evening was the program’s annual fund raiser, Dinner With The Titans, held at the Grove in Anaheim next to Angels Stadium. We had nearly 500 people attend to hear keynote speaker Phil Nevin (the new third base coach of the Angels), along with new head coach Jason Dietrich, and we raised nearly $150,000 for the program, second to only when Kevin Costner was our keynote.
Below, I was able to say hello to former Titan and current New York Mets third baseman J.D. Davis.

J.D. (aka Bubbles, as many of us affectionately call him) was the hottest hitter in baseball during the first 3 weeks of last season before getting hit on the hand and suffering a broken bone which essentially dismantled his season. We pray for a great season of health for him and all the other Titans in the major leagues, including Chad Wallach and Michael Lorenzen, who are now with the Angels.
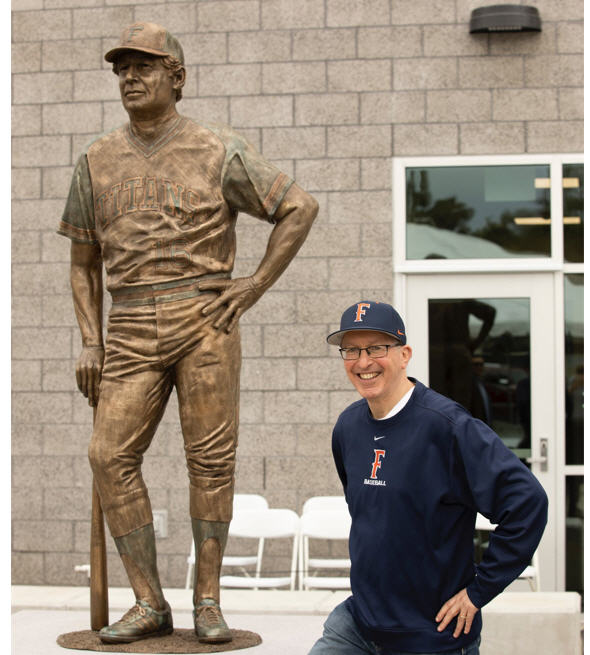
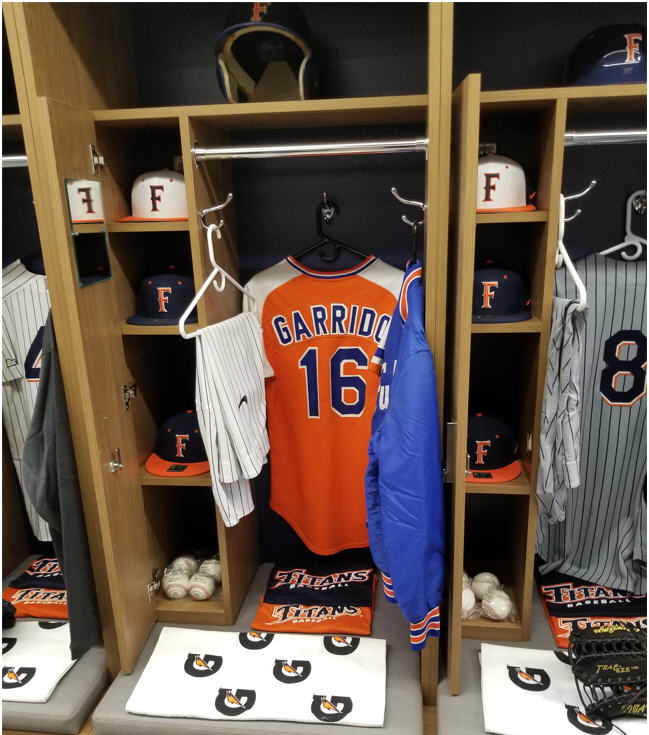
The other part of the weekend was Fullerton’s alumni game on Saturday, where former players return to play this year’s current team. That was preceded by a very special ceremony which both unveiled a statue of Coach Augie Garrido, my mentor and Coach, who put Fullerton baseball on the map. It was also the first introduction to the public of the new Titans Baseball locker room, a $14 million project some six years in the making.
Below is a mock-up locker in the new facility.
If you’re paying attention to baseball, you know the league and players are in a labor dispute, which is likely to delay the beginning of spring training, and possibly the regular season. So, if you’re wanting to scratch your baseball itch and are local, the Titans begin their season February 18 at #6 Stanford, and open their home schedule Friday, February 25 with a three-game series with Gonzaga, who thankfully is not as good in baseball as they are in basketball (but still pretty good!).
The Bob. . . . .Sled
On January 20, our family went on vacation to Park City for six days, our first ski vacation in four years. Being gone six days has put me behind by about two weeks, including this monthly update, but hey, you can’t work 52 weeks! We were blessed with great weather and a wonderful home. But the reason I wanted to mention the trip is the incredible experience we had at the Utah Olympic Park.

When we were at Whistler about 10 years ago, they also had an Olympic bobsled run from when they hosted the Winter Olympics, but we were then in April, and they had just shut it down because it was too warm. I’d always wanted to do this, so Park City has a similar set up, and I made reservations for my wife, daughter and myself to strap ourselves into a metal tube and with a professional bobsled driver steering, go careening around the 3/4 mile track at nearly 70 miles per hour.
Besides the ride, what was also cool was our “guide,” the man above on the left with Caroline, in the green lime jacket. His name is Gary Roepke, and he was a member of the USA Luge Team from 1983 to 1988, and the 2008 and 2009 U.S. Luge National Master’s Champion. He later became a commentator for the Olympics in 2002, and since has announced the bobsled events in 2006, 2010, 2012, 2014, 2018 and is currently in China to do it again.
All I can tell you is the ride was intense, and was over in 47 seconds. I couldn’t see much (being in the back) but my wife’s helmet, and had no idea when the next turn was coming. I was (all of us) holding on for dear life, trying to remember to breathe. It’s pretty amazing. For all you thrill seekers, I highly recommend the experience. For $195, it’s a hell of a bargain compared to spending $250,000 to be launched in a rocket ship courtesy of Jeff Bezos!
A Look Back at 2021 Performance
We normally take the first letter of the new year and recap how all of our strategies did, good and bad. This one’s long already, and we wanted to focus on what is happening, given the down volatility. We believe in transparency and accountability, so know we’ll cover that in our next update, even if by then it’s 8 weeks into the new year.
Material Of A Less Serious Nature
Two boys were throwing a football around in Buffalo’s LaSalle Park. One boy was attacked by an out of control Rottweiler. The other boy immediately jumped on the dog, pummeling it until it released his friend. Eventually, the dog relented and hobbled away. A newspaper reporter witnessed the incident and rushed over to interview the boys.
“My headline will be ‘Young Bills Fan Saves Friend From Vicious Animal,”’ the reporter exclaimed. “Sorry, I’m not a Bills fan,” said the boy.
“Well, how about ‘Young Sabres Fan Saves Friend?”’ asked the reporter. “Sorry, I don’t like the Sabres either,” said the boy.
“Everyone in this town loves the Bills and the Sabres. So tell me, what is your favorite team?”
“I just love the Chiefs,” exclaimed the kid.
The reporter wrote in his notebook, “Little Bastard Maims Beloved Family Pet.”
Any Buffalo Bills fans frustration with the NFL’s stupid overtime rule should be directed at the Commissioner. Can you imagine the 7th game of the World Series being decided in extra innings when the visiting team gets to bat in the top of the 10th inning, and a player hits a walk-off HR to win, and the home team doesn’t get to bat? That’s what the NFL has. Horrible.
And no, no matter how many of my friends are Rams fans, I’m not rooting for them in the Super Bowl. I wouldn’t be a 49er Faithful if I did that. Thanks for reading this far and all your trust and confidence in our team.
Sincerely,

Bob Kargenian, CMT
President
TABR Capital Management, LLC (“TABR”) is an SEC registered investment advisor with its principal place of business in the state of California. TABR and its representatives are in compliance with the current notice filing and registration requirements imposed upon registered investment advisors by those states in which TABR maintains clients. TABR may only transact business in those states in which it is notice filed, or qualifies for an exemption or exclusion from notice filing requirements.
This newsletter is limited to the dissemination of general information pertaining to our investment advisory/management services. Any subsequent, direct communication by TABR with a prospective client shall be conducted by a representative that is either registered or qualifies for an exemption or exclusion from registration in the state where the prospective client resides. For information pertaining to the registration status of TABR, please contact TABR or refer to the Investment Advisor Disclosure web site (www.adviserinfo.sec.gov).
The TABR Model Portfolios are allocated in a range of investments according to TABR’s proprietary investment strategies. TABR’s proprietary investment strategies are allocated amongst individual stocks, bonds, mutual funds, ETFs and other instruments with a view towards income and/or capital appreciation depending on the specific allocation employed by each Model Portfolio. TABR tracks the performance of each Model Portfolio in an actual account that is charged TABR’s investment management fees in the exact manner as would an actual client account. Therefore the performance shown is net of TABR’s investment management fees, and also reflect the deduction of transaction and custodial charges, if any.
Comparison of the TABR Model Portfolios to the Vanguard Total Stock Index Fund, the Vanguard Total International Stock Fund and the Vanguard Total Bond Index Fund is for illustrative purposes only and the volatility of the indices used for comparison may be materially different from the volatility of the TABR Model Portfolios due to varying degrees of diversification and/or other factors.
Past performance of the TABR Model Portfolios may not be indicative of future results and the performance of a specific individual client account may vary substantially from the composite results above in part because client accounts may be allocated among several portfolios. Different types of investments involve varying degrees of risk, and there can be no assurance that any specific investment will be profitable.
The TABR Dividend Strategy presented herein represents back-tested performance results. TABR did not offer the Dividend Strategy as an investment strategy for actual client accounts until September/October 2014. Back-tested performance results are provided solely for informational purposes and are not to be considered investment advice. These figures are hypothetical, prepared with the benefit of hindsight, and have inherent limitations as to their use and relevance. For example, they ignore certain factors such as trade timing, security liquidity, and the fact that economic and market conditions in the future may differ significantly from those in the past. Back-tested performance results reflect prices that are fully adjusted for dividends and other such distributions. The strategy may involve above average portfolio turnover which could negatively impact upon the net after-tax gain experienced by an individual client. Past performance is no indication or guarantee of future results and there can be no assurance the strategy will achieve results similar to those depicted herein.
Inverse ETFs
An investment in an Inverse ETF involves risk, including loss of investment. Inverse ETFs or “short funds” track an index or benchmark and seek to deliver returns that are the opposite of the returns of the index or benchmark. If an index goes up, then the inverse ETF goes down, and vice versa. Inverse ETFs are a means to profit from and hedge exposure to a downward moving market.
Inverse ETF shareholders are subject to the risks stemming from an upward market, as inverse ETFs are designed to benefit from a downward market. Most inverse ETFs reset daily and are designed to achieve their stated objectives on a daily basis. The performance over longer periods of time, including weeks or months, can differ significantly from the underlying benchmark or index. Therefore, inverse ETFs may pose a risk of loss for buy-and-hold investors with intermediate or long-term horizons and significant losses are possible even if the long-term performance of an index or benchmark shows a loss or gain. Inverse ETFs may be less tax-efficient than traditional ETFs because daily resets can cause the inverse ETF to realize significant short-term capital gains that may not be offset by a loss.
For additional information about TABR, including fees and services, send for our disclosure statement as set forth on Form ADV from us using the contact information herein. Please read the disclosure statement carefully before you invest or send money.
A list of all recommendations made by TABR within the immediately preceding one year is available upon request at no charge. The sample client experiences described herein are included for illustrative purposes and there can be no assurance that TABR will be able to achieve similar results in comparable situations. No portion of this writing is to be interpreted as a testimonial or endorsement of TABR’s investment advisory services and it is not known whether the clients referenced approve of TABR or its services.