No, This Isn’t 2008 Again. It Could Be Worse
That got your attention, didn’t it? Hopefully, what I’m about to share about the state of the financial markets will not be interpreted as a de-facto forecast. It’s not what we do. Rather, it’s evidence-based wisdom based on my 39 years of learning and practicing technical analysis, and watching, investing and living markets during that time.
I strive to live up to a quote I read last night from long-time baseball data geek Bill James, who was quoted regarding the current Corona virus pandemic. James said, “It’s hard to distinguish between what is being said responsibly, and what’s just being said.” What you’re about to read, I hope, will fall into the former category.
In this forum, I don’t know that I’ve ever asked a favor like this. And that is, please share this with a friend or loved one that you care about. It just might save their financial future.
What’s Happened, Where We’re At, And Estimating The Downside
Before I get into the weeds, let me first correct something from last Friday’s missive, which was mostly to communicate that we are remaining open and working at our office, until such time (hopefully not) that we are told we can’t. I titled the piece “Be Careful Out There,” and used a story about the old TV show NYPD Blue and its star, Dennis Franz. Guess what? The story I told was about the right actor (Dennis Franz), but the wrong show. It was actually Hill Street Blues, which preceded NYPD Blue, and which Franz was also a star in. Who noticed this, and corrected me? That would be my wife, Michelle. Yep. I got home Friday night, and almost the first thing out of her mouth was, “You got the right actor, and the wrong show.” Kudos to Michelle. It also validates that the readership of these updates is at least 1.
Now, onto the more serious business of the fastest stock market meltdown in history. How about 35 in 33. As in, the S&P 500 dropped nearly -35% from February 19, to March 23 (on a closing basis), in just 33 calendar days. The monthly chart below, courtesy of www.decisionpoint.com, shows the S&P 500 going back to 1996, with various retracement levels of the entire bull market, which began in March 2009 with the SPX at 676, ultimately reaching 3386. It is common for a bear market to retrace a portion of the previous bull market. With the entire rally encompassing 2710 points, there are three levels that technicians tend to focus on. Those are 38.2%, 50% and 61.8%, because they are Fibonacci ratios (remember from math class?). Those levels correspond to 2356, 2031 and 1711 on the index. Last Friday and this Monday, the 2356 level was broken handily, which now puts the other two targets into play. In technical analysis, previous resistance becomes support.

The top of both the 2000 bull market and the 2007 peak was almost identical at the 1575 level. Call it 1600. Once that level was breached to the upside in 2013, the S&P 500 then doubled in about 7 years. That would be a logical place for the decline to stop, and is also near the 62% retracement level of 1700. The 1700 level is important for another reason, and that is of valuation. See the chart below, courtesy of Ned Davis Research, at www.ndr.com.
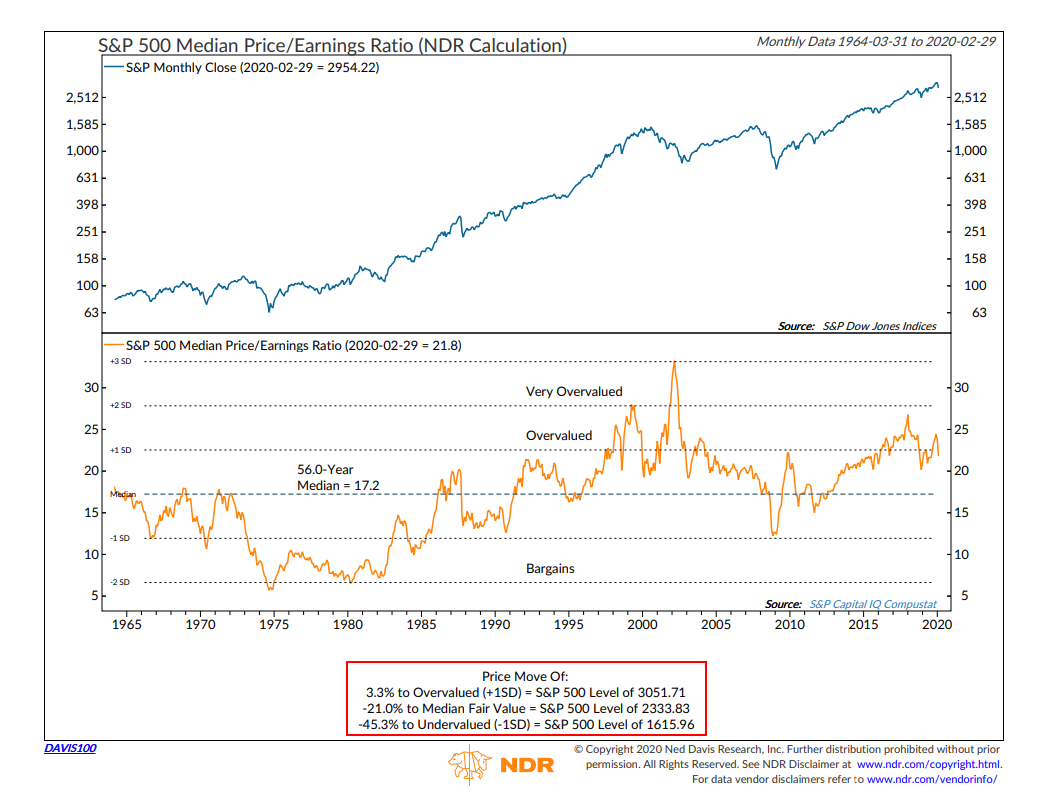
The chart represents the median Price/Earnings Ratio of the S&P 500, going back to 1965. The 56-year median is 17.2 At the end of February, stocks were overvalued at a ratio of 21.8. Fair value, as the box at the bottom indicates, is 2333, and we just reached that. Undervalued is considered one standard deviation below the median. Currently, that would be the 1616 level. Not far from the support levels mentioned above. The last time this level was reached was 2009. In that bear market, the S&P 500 fell nearly -57%. Could this happen? Of course it could. If stocks can get overvalued, and trade more than one standard deviation above their norm for several years, they can certainly do the same on the downside. There are two points I’d like to make from here, because in a moment, we’re going to be discussing this from an “IS IT TIME TO BUY” perspective.
First, if this is worse than 2008, I would expect stocks to eventually fall further than they did in that crisis. Why do I feel this is worse? Well, millions of people have lost their jobs nearly overnight, with no known point as to when life will return to “normal.” That didn’t happen in 2008. Hundreds of thousands of businesses nationwide cannot survive more than about one month without revenue. Entire industries have been uprooted with far reaching implications, from sports to concerts, movies, travel, theatre and other forms of entertainment. Most dine-in restaurants have been completely shut down, except for takeout. I could go on, but you get the picture. If stocks were to fall -60% from their peak, which would exceed the 2007-09 decline, the S&P 500 would go to 1350. For perspective, it closed today (Thursday) at 2630. From here, that would be another -48% lower. Even getting to the 1700 zone would entail additional losses from current levels of -35%.
One of the reasons I think this could happen is the monthly chart above, that we started with. On the bottom clip of that chart is the PMO indicator (Price Momentum Oscillator). It is a variation of the MACD indicator my dear mentor invented, the late Gerry Appel, who I honored just last month. Notice that at the bottom in 2003 and again in 2009, the PMO was well below the zero line. Now, look at where the PMO is currently. It may have one hell of a long way to go.
The Good News
OK, I started with the bad news. Now, we’re going to switch to good news. And, that means opportunity. Opportunity that does not come along very often. And, it is here. Right now. In the past, we have written about an indicator that has been published by Value Line since 1968. It is called the VLMAP, or Value Line Median Appreciation Potential. It’s a valuation indicator for the stock market. Each week, Value Line’s analysts crunch their numbers on the main 1700 stocks they follow, and come up with a number which represents the estimated gain for that stock for the coming 3-5 years. This is expressed in the chart below, also courtesy of Ned Davis Research. For this, a low reading is bad, and a high reading is good.
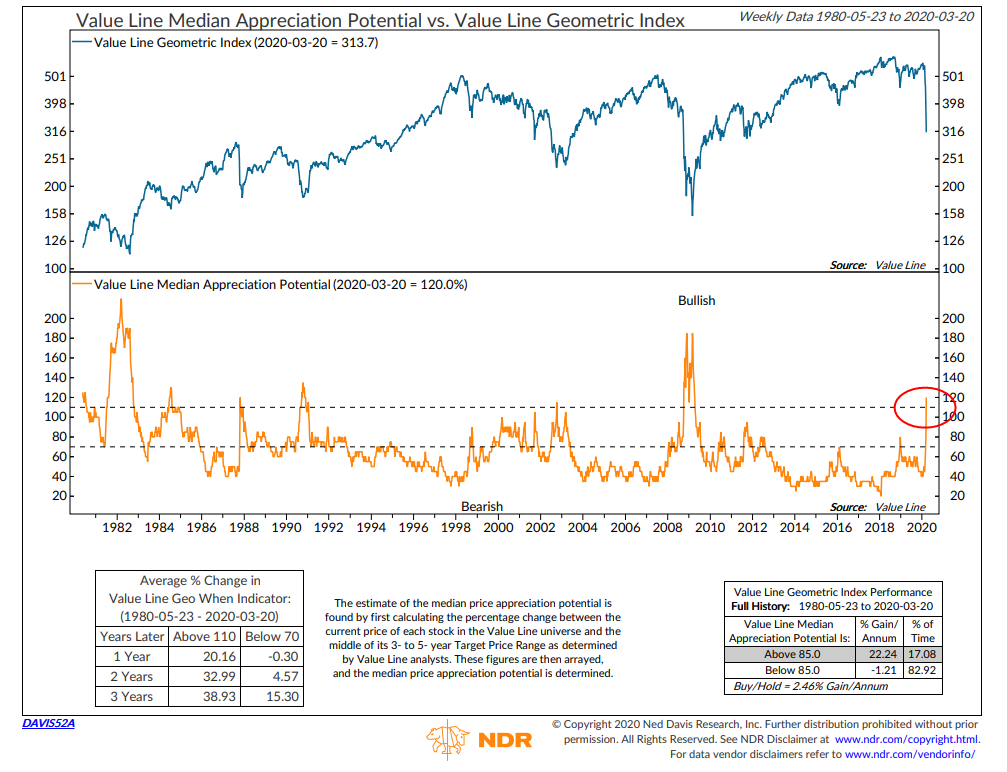
The Ned Davis chart only goes back to 1980. Last week, the indicator spiked from 80% to 120% in one week, as you can see on the far right of the chart. This is the highest weekly reading in 11 years, going back to March 2009. Recall that was a pretty good time to be buying stocks. However, a caveat. Back then, the indicator reached the 185% level, twice in a span of four months. If it goes from 120 to 185, there will be a lot of additional pain. For some additional context, below is a table I created with the data I have on the indicator going back to 1968. I’ve listed all prior readings of 120% or more.
Value Line MAP Indicator Median Appreciation Potential
| 12/14/1973 | 160 |
| 10/11/1974 | 255 |
| 10/10/1975 | 130 |
| 11/24/1978 | 120 |
| 4/4/1980 | 150 |
| 3/26/1982 | 220 |
| 8/3/1984 | 130 |
| 11/6/1987 | 120 |
| 10/26/1990 | 135 |
| 3/17/2000 | 100 |
| 10/5/2001 | 105 |
| 10/18/2002 | 115 |
| 3/21/2003 | 105 |
| 12/5/2008 | 185 |
| 3/13/2009 | 185 |
| 3/27/2020 | 120 |
As you can see, not only did the indicator go to 185% in 2008/2009, but it also went above the 200% level back in 1982 and in December 1974. Those also were two excellent times to be buying stocks, but if this indicator goes to even 185%, let alone over 200% in coming months, there will be substantial downside from current levels. That, in essence, is the dilemma. This past Monday, we made “A” bottom at 2237. But, is it THE bottom?
Another indicator we track is also showing that stocks are washed out on a near term basis. We’ve featured it in the past, and it’s called the NYSE Bullish Percent, which measure the percentage of stocks in an index which are on Point and Figure Buy signals. Below is the most recent chart, courtesy of our friends at Dorsey Wright & Associates, at www.dorseywright.com.
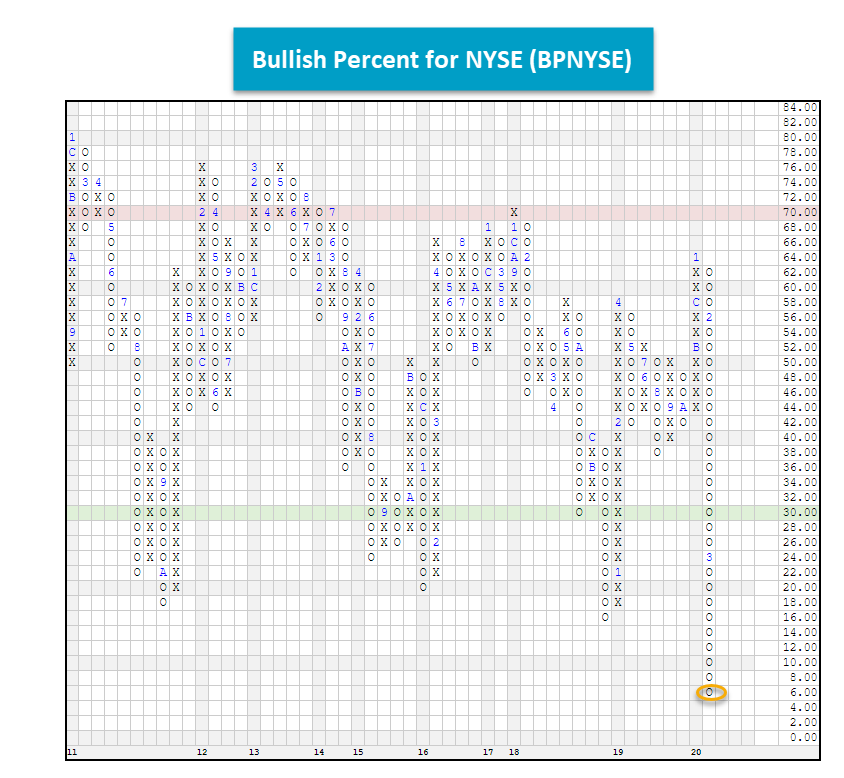
Last week, the indicator fell to 6%. That means that only 6% of the stocks on the NYSE were on Buy signals. In 50 years of data going back to 1970, this is only the fifth time the indicator has reached single digits. Five times in 50 years. The other four instances were September 1974, October 1987, October 2008 and November 2008. Three of those four times were excellent entry points for stocks. And, here’s the caveat. That was October 2008. The indicator turned up in mid-October 2008, and quickly failed, falling again into November That decline was -30% from the rally peak. My educated guess is this feels like 2008 in terms of magnitude and volatility, so I would expect at least the first rally in a lot of indicators to fail. It’s the difference between a V bottom and a double bottom. Back in December 2018, we had a V bottom. That is not the norm, but it happens. No indicator or model is perfect. We’ve just witnessed an extreme in downside momentum, with the S&P 500 falling -28% below its 50-day moving average.
According to our friend, Doug Ramsey of the Leuthold Group, “history suggests it’s extremely unlikely that a final bear market low would occur coincident with the end of such an extreme downward impulse. That jives with the work from Ned Davis Research, who recently examined waterfall declines going back to 1929. This is the 14th such episode since then. In nearly 70% of the cases, a retest or breach of the low took place, and in the larger bear markets, the magnitude of the additional declines was significant. Coupling that with economic history, the more severe the slowdown in the global/U.S. economy, the greater the equity market decline.
There’s Finally A “High” In High Yield
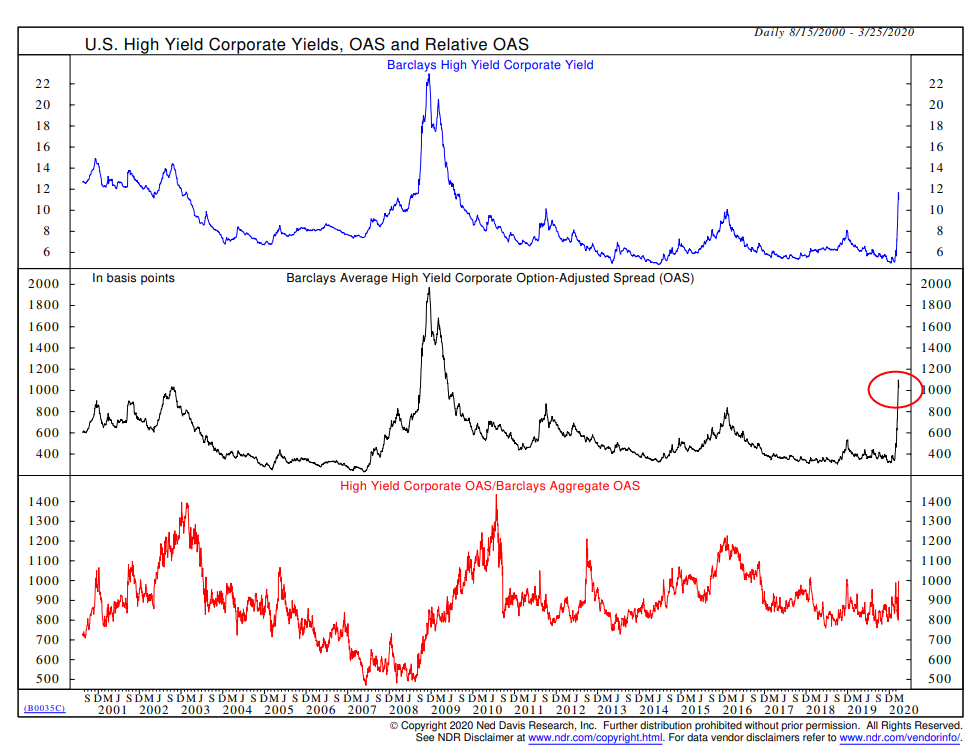
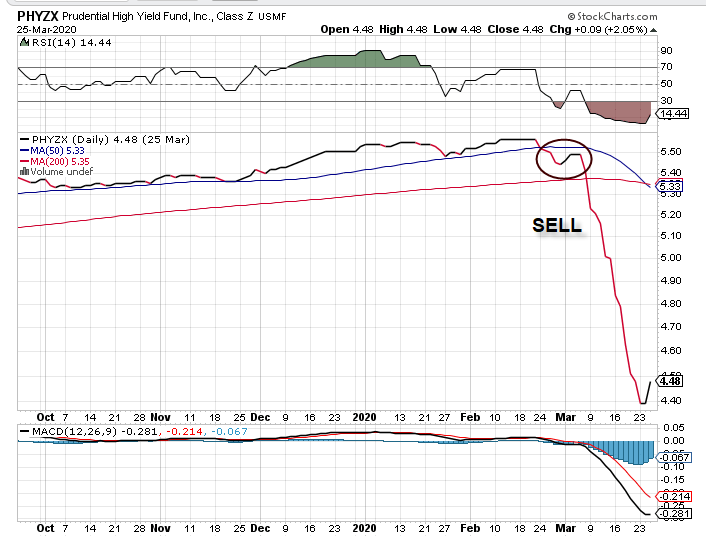
After nearly 14 months of being on a BUY signal, our risk model for high yield corporate bond funds went on a SELL February 28. In hindsight, that was a pretty effective signal. We certainly didn’t know the magnitude of the decline coming, but simply followed our process. On average, the 15 funds in our own composite declined nearly -20% from their peak on February 21 to last Friday, March 20. As a result, spreads on the yields of high yield corporates relative to Treasury yields have widened to the second-highest reading in the last 20 years. See the chart below, courtesy of Ned Davis Research. Look at the middle clip, the Barclays Average High Yield Option-Adjusted Spread.
Put another way, below is a look at what has happened to prices. We use several funds in this category for clients, and below is the daily chart of the Prudential High Yield Fund. We’ve circled the area/zone of where our model went negative, at the end of February.
So, we have the best buying opportunity in this area in the last 20 years—unless this is 2008. In that period, spreads exploded to over 22%, as you can see on the chart. Much like we’ve noted above, that is the dilemma. Many stock and bond assets are cheap. But, they can get a lot cheaper. Or not. What is one to do? In our case, we have to go back to our process. We can’t know if we are going to have spreads widen even further. They may, and may not. But, if we don’t follow our process, what do we have? Nothing. As I write this, high yield bond funds have risen for 3 consecutive days, and very well may generate a BUY signal on our model this weekend. We will certainly follow it. With volatility what it is, in both bonds and stocks, risk is higher than normal so about the only thing one can do is consider taking smaller than normal positions. Candidly, we are seeing moves in stocks and bonds in a day, or a few days, that normally might take place in an entire year or more. That’s not healthy, but it creates both risk, and opportunity.
Where We’re At With Portfolios
Since March 9 and March 11, our equity allocations have been 70% to 80% in cash. We used the strength of the last three days to lighten that further today, and are now 85% in cash. It is unlikely that any of our stock market risk models will turn positive soon, but things are happening faster than ever before, so we’ll just follow our process. Our bond allocations are currently 15% in PIMCO GNMA, and about 85% in cash. We happen to be in the midst of raising income and rebalancing accounts, which we do once per year. In January, I decided to do that in March. Little did I know of the market upheaval to come. As mentioned above, we may be getting a High Yield bond BUY signal as soon as tomorrow, which would be implemented next week. We’ll see.
One thing we are doing, though, is incrementally increasing our equity exposure, given the improvement in valuations we noted above. For the last two to three years, our allocations have been as follows:
Conservative Accounts 35% in stocks and 65% in bonds
Moderate Accounts 50% in stocks and 50% in bonds
Aggressive Accounts 70% in stocks and 30% in bonds
For several years, a number of clients would ask at an annual review—“is this the time to be more aggressive?” We’d always answer, NO. Stocks are too expensive. They are no longer overvalued as a result of the last four weeks, but nor are they bargains. So, in our view, the best approach is to make changes in increments. It’s the least regret approach. As a result of the work we’ve shown above, we are increasing allocations to stocks across all categories by 5%, and reducing bonds by 5%. Should stocks fall to the 1600 to 1800 range, we’d then move another 5% out of bonds and into stocks. So, let me be clear. If our maximum allocation to stocks is 55% for a Moderate account, and we are currently 15% in stocks, this means the total account has about 8-9% in stocks. Get it?
We’ll have more in next month’s update on the corporate bond market, along with TABR’s Dividend Stock strategy. There has been so much going on in corporate bonds, it will make your head spin, and that has certainly been the case with us. For two weeks, we’ve been fretting over a position we established back in the fall/winter of 2015 in an investment grade bond ETF, the Invesco 2024 Corporate Bond Bullet Share (BSCO). The yield to worst when we purchased it as part of our bond allocations was 3.65%. All the bonds in the portfolio mature in 2024. You just hold on until maturity. The risk of default (we thought) was quite low. From March 3 to March 19, the fund’s price dropped over -17%. That’s not a misprint. It was a combination of default fears, and liquidity issues, and as a result, the fund began to trade in the open market over -3% below the value of its holdings, called its net asset value. This is another topic we’ll address next month. By Friday, March 20, the annualized return from our purchase date almost 4 1/2 years ago had dwindled to 1%. And then, a gift from God came in (also known as the Fed), who Sunday night announced they were going to start purchasing investment grade bonds and bond funds. On Monday of this week, the price of the fund jumped intra-day nearly 8%. We used that rally to dump the entire position. In one day, our compound return increased from 1% to 2.5%, which isn’t too shabby given where interest rates are. We simply don’t want to worry about default risk for another 3 years, no matter what the Fed is doing. Maybe the worst is over for the corporate bond market (and other sectors, such as municipal bonds and mortgage-backed securities). I don’t know. But, something is broken and there is very real risk of a large number of investment grade bonds being downgraded to junk status.
Titan Baseball—An Abrupt End
Many of you know of my involvement at Cal State Fullerton, both with the baseball team and the Titan Capital Management finance class. Just three weeks ago, I was with our team as we traveled to play the University of Texas in a three-game series. Little did we know that would be the end of the college baseball season. Along with all of professional sports and other college sports, this is one of many areas currently missing from all of our lives. I feel for our young men, our coaches, and all of our students. The day before we left, March 4, the Titan Athletics website published the story below about my involvement with the baseball and softball programs. Eventually, this may also be published in the Orange County Register’s weekly section on Cal State Fullerton. I hope you enjoy it.
https://www.fullertontitans.com/general/2019-20/releases/20200304rax91i
Caroline’s Corner
Many of you are dealing with the same issues we are—schools are closed for at least the next month, and all of a sudden, your kids are home full-time, Monday to Friday. It’s not a vacation, though. In fact, it is probably more difficult than GOING to school. Our 15-year-old, Caroline, is a freshman at Orange Lutheran High School. The school is amazing. They have transitioned to online classes very rapidly, as every student has an iPad, and laptop. Being on the track team, she is quite disappointed right now that the season has been interrupted (at a minimum), but is still trying to stay in running shape with some of her teammates, organizing runs of 5 to 7 miles several days a week. Meanwhile, she created her own little office in her bedroom. She is staying connected with friends, and doing a great job. See below.

Material Of A Less Serious Nature
Five surgeons were scrubbing up. One announced to the others, “I’ve got an accountant this afternoon. They’re the easiest to work on, you open them up and everything inside is numbered.”
The second responds, “Yeah, but you should try electricians! Everything inside them is coler-coded.”
The third surgeon says, “Nah, I think librarians are the best. Everything inside them is in alphabetical order.”
The fourth surgeon chimes in. “You know, I like construction workers. Those fellas always understand when you have a few parts left over.”
The fifth surgeon, shaking his head, says, “You’re all wrong. Politicians are the easiest to operate on. There’s no guts, no heart, no brains, and no spine. Plus their head and their ass are interchangeable.”
There’s a lot of material here. I hope it’s helpful to you. These are scary, unprecedented times. May I remind you, though, that just 12 years ago, we were all experiencing the same thing. An unprecedented financial crisis that had never happened before. If we’re all alive 12 years from now, it is likely there will be another “unprecedented” event that causes the next bear market. No one call the exact bottom of this bear market, and that includes me. We will do our best in navigating it, following our processes. Just remember. Based on the data, now is one of the best times to buy stocks since March of 2009. These times don’t come around very often. But also remember that based on history, stocks could be only half way to their final destination. We’ll see. We are hoping for the best, but preparing for the worst. A disciplined process, we think, is essential for investing, and it is times like these that remind us just how important that is. Investing is not for the faint of heart.
Sincerely,

Bob Kargenian, CMT
President
TABR Capital Management, LLC (“TABR”) is an SEC registered investment advisor with its principal place of business in the state of California. TABR and its representatives are in compliance with the current notice filing and registration requirements imposed upon registered investment advisors by those states in which TABR maintains clients. TABR may only transact business in those states in which it is notice filed, or qualifies for an exemption or exclusion from notice filing requirements.
This newsletter is limited to the dissemination of general information pertaining to our investment advisory/management services. Any subsequent, direct communication by TABR with a prospective client shall be conducted by a representative that is either registered or qualifies for an exemption or exclusion from registration in the state where the prospective client resides. For information pertaining to the registration status of TABR, please contact TABR or refer to the Investment Advisor Disclosure web site (www.adviserinfo.sec.gov).
The TABR Model Portfolios are allocated in a range of investments according to TABR’s proprietary investment strategies. TABR’s proprietary investment strategies are allocated amongst individual stocks, bonds, mutual funds, ETFs and other instruments with a view towards income and/or capital appreciation depending on the specific allocation employed by each Model Portfolio. TABR tracks the performance of each Model Portfolio in an actual account that is charged TABR’s investment management fees in the exact manner as would an actual client account. Therefore the performance shown is net of TABR’s investment management fees, and also reflect the deduction of transaction and custodial charges, if any.
Comparison of the TABR Model Portfolios to the Vanguard Total Stock Index Fund, the Vanguard Total International Stock Fund and the Vanguard Total Bond Index Fund is for illustrative purposes only and the volatility of the indices used for comparison may be materially different from the volatility of the TABR Model Portfolios due to varying degrees of diversification and/or other factors.
Past performance of the TABR Model Portfolios may not be indicative of future results and the performance of a specific individual client account may vary substantially from the composite results above in part because client accounts may be allocated among several portfolios. Different types of investments involve varying degrees of risk, and there can be no assurance that any specific investment will be profitable.
The TABR Dividend Strategy presented herein represents back-tested performance results. TABR did not offer the Dividend Strategy as an investment strategy for actual client accounts until September/October 2014. Back-tested performance results are provided solely for informational purposes and are not to be considered investment advice. These figures are hypothetical, prepared with the benefit of hindsight, and have inherent limitations as to their use and relevance. For example, they ignore certain factors such as trade timing, security liquidity, and the fact that economic and market conditions in the future may differ significantly from those in the past. Back-tested performance results reflect prices that are fully adjusted for dividends and other such distributions. The strategy may involve above average portfolio turnover which could negatively impact upon the net after-tax gain experienced by an individual client. Past performance is no indication or guarantee of future results and there can be no assurance the strategy will achieve results similar to those depicted herein.
Inverse ETFs
An investment in an Inverse ETF involves risk, including loss of investment. Inverse ETFs or “short funds” track an index or benchmark and seek to deliver returns that are the opposite of the returns of the index or benchmark. If an index goes up, then the inverse ETF goes down, and vice versa. Inverse ETFs are a means to profit from and hedge exposure to a downward moving market.
Inverse ETF shareholders are subject to the risks stemming from an upward market, as inverse ETFs are designed to benefit from a downward market. Most inverse ETFs reset daily and are designed to achieve their stated objectives on a daily basis. The performance over longer periods of time, including weeks or months, can differ significantly from the underlying benchmark or index. Therefore, inverse ETFs may pose a risk of loss for buy-and-hold investors with intermediate or long-term horizons and significant losses are possible even if the long-term performance of an index or benchmark shows a loss or gain. Inverse ETFs may be less tax-efficient than traditional ETFs because daily resets can cause the inverse ETF to realize significant short-term capital gains that may not be offset by a loss.
For additional information about TABR, including fees and services, send for our disclosure statement as set forth on Form ADV from us using the contact information herein. Please read the disclosure statement carefully before you invest or send money.
A list of all recommendations made by TABR within the immediately preceding one year is available upon request at no charge. The sample client experiences described herein are included for illustrative purposes and there can be no assurance that TABR will be able to achieve similar results in comparable situations. No portion of this writing is to be interpreted as a testimonial or endorsement of TABR’s investment advisory services and it is not known whether the clients referenced approve of TABR or its services.