Out Of Touch
Shake it up is all that we know
Using the bodies up as we go
I’m waking up to fantasy
The shades all around aren’t the colors we used to see
Broken ice melts in the sun
And times that are broken can often be one again
We’re soul alone
And soul really matters to me
Take a look around
You’re out of touch
I’m out of time (time)
But I’m out of my head when you’re not around
In 1984, when the above hit single from Hall & Oates came out, I was all of 27. Next month, I’ll turn 63. A lot has changed in 36 years, certainly in investing. Brokerage offices with ticker tapes and Bunker Ramo machines have been replaced by smartphones with trading apps like Robinhood, where purportedly, one can open an account in 10 minutes and begin trading stocks for free (no commission) with the click of a few buttons.
Of course, much of this is in the name of progress and growth in our world. And, a lot of this progress is really good. Technology has opened up markets and investing to almost anyone with as little as $1000. Given the behavior we’ve read about in the past several months, though, I’d hardly characterize many of these individuals as “investors.” Gamblers and speculators would be more appropriate. And, that’s OK. Everybody gets their financial education in a different manner, and there’s no substitute for using real money.
We’ll touch on this phenomenon, and some thoughts on it. We’re uncertain of its impact on markets. But it certainly seems that everything is happening faster than ever before, and is cheaper as well.
In addition, there’s been some broadening in the participation of various market segments in recent weeks, which historically has bullish implications. We have some data on this, and circling back to “cheaper,” we dive a bit into internal fund expenses, an area that most investors have very little clue about (hey, that’s why you have us!). Maybe by the time I’m finished, I’ll figure out if I’m really Out Of Touch, or if instead, I’m Hip To Be Square, like Huey Lewis (1986).
I’d Like To Learn About Stocks
Every four to five weeks, I’ve got to come up with something that is hopefully interesting to write about, as one way to regularly communicate with all of you. These ideas come from all over the place. This month’s focus came courtesy of a question I posed to our daughter, Caroline, a couple of months ago. At that time, we were about a month away from school starting. She is a sophomore at Orange Lutheran High School, and I began to realize that soon, there would be no more drives to school where we talk about different things that are going on.
She recently got her driver’s permit, and next February will turn 16. Then will come her own car, and it will be, goodbye Mom and Dad, no more talks as we drive to school. So, my question to her was something like this—we have you with us for another 3 years before you go away somewhere to college. What would you like to learn from me before you go away? Once several weeks went by, I asked if she’d finally thought about this, and she had, and answered “I’d like to learn about stocks.”
I’ve not quite figured out how I’m going to go about this, but it definitely starts with books and discussion. In the late 1970s and early 1980s, I subscribed to several stock market newsletters, read Barron’s every week (and still do), and studied a number of books on fundamental and technical analysis. Today, newsletters aren’t nearly as prominent (perhaps because there was no internet then), but there’s a wealth of information on the web. Like many things, though, it takes wisdom to know what is credible and what is not, and for all of us, wisdom is in short supply when you’re in your 20s compared to your 50s or later.
Investing vs Trading vs Gambling
Remember Eastman Kodak. The company had been a member of the Dow Jones Industrial Average since 1930, but was removed from the average in 2004. The company has since gone the way of predecessors Blockbuster Entertainment, Research In Motion (remember the Blackberry?) and Sears. They became irrelevant because they didn’t keep up with the times. They became. . .Out Of Touch.
As recently as 2014, the stock traded over $35, but as business deteriorated, dropped to under $2 per share earlier this year. See the chart below, courtesy of www.stockcharts.com. That’s when the fun began.
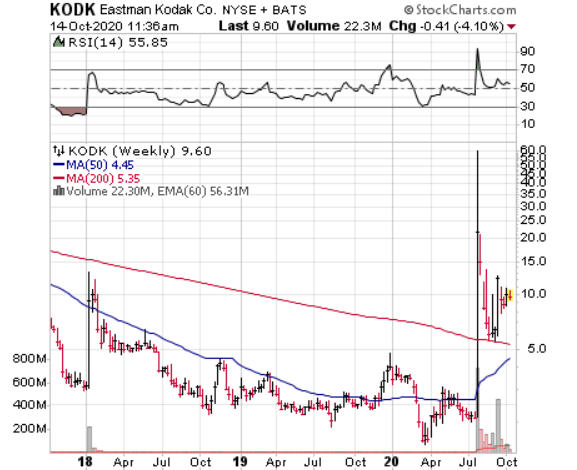
According to a report in the Wall Street Journal a couple of months ago, the stock surged from $2 to as high as $60 in two days in late July, following the preliminary disclosure of a $765 million loan from the government to make drug ingredients at its U.S. factories. Once it was clear that the agreement was far from a done deal, the stock plunged below $10 in short order, about where it sits today.
What was fascinating reading, though, was the experience of one Alex Olsen, an airline industry worker. Upon hearing the news, apparently Mr. Olsen thought it was the perfect time to buy Kodak. The next day, he purchased over 2700 shares at an average price of $35, or about $95,000. He wasn’t the only one. According to the data-mining website Robintrack, more than 100,000 users of the Robinhood app jumped in that day, helping to drive the stock to an intraday high of $60. Once the reality set in, though, the stock faded during the next two days, closing below $22. It eventually would move back to around $10 per share. Olsen, who had only started “trading” (author’s italics) earlier this year with a brokerage account at TD Ameritrade, finally threw in the towel a few days later, losing almost $30,000 in the process.
“I guess what I learned is trading is just gambling,” Mr. Olsen said. “That’s a fact.”
Actually, the fact is, Mr. Olsen is full of crap. What he did is in fact gambling, because I can assure you he didn’t know anything about what he was doing. He was just hoping to buy something that he thought was going to go up even more. Do you think he did any real research? Do you think he knew that Kodak’s shareholder equity at the end of 2019 was $281 million, while its total liabilities were (-$1.134 billion)? And that this might be the reason the stock had been trading mostly below $3 for the past three years? According to the Wall Street Journal article, Olsen felt “duped and angry.” At who? Do you think he should look in the mirror?
Individual stocks certainly have more pizzazz than steady tried and true mutual funds, but do you think he’d feel differently had he made the decision to put that money into Apple, Amazon and Microsoft? He may be scarred for life because of his experience, depending on how he reacts to it. This story reminds me of something all of us who are parents can relate to (and if we’re honest, maybe this is the way we were when we were younger). Remember those times when your teenager wouldn’t listen to you and your sage advice, because they had it all figured out? And then, whatever happens, happens, and it turns out that what you told them actually comes true? At some point, they realize that Mom or Dad was right, and that they should have listened to you. But, you can’t tell them that. They have to experience it for themselves.
And that’s how I feel about the people, mostly younger, who are using brokerage accounts to trade. According to a report from Deloitte, one of the largest management consulting firms, 43% of North American males aged 25-34 who watch sports also bet on sports at least once per week. This is likely the same demographic that has turned to trading (er, gambling).
Trading Vs Gambling/Speculation
In my role as a board member for the Titan Capital Management finance class at Cal State Fullerton, we along with other board members evaluate research reports which are produced by the students on a variety of companies, for both Buy and Sell candidates. The students are learning a variety of methods to assess company’s qualitative and quantitative factors. This work includes understanding the company’s assets, liabilities, earnings, industry performance, management, governance and other factors to determine if there is a margin of safety in purchasing the stock and its future growth prospects. Monitoring all of these factors also comes into play in determining when to sell a company.
This is real research. An example I might show our daughter is comparing Southwest Airlines to American Airlines, and how different their balance sheets are. With much of the nation locked down to various degrees, stocks of companies with stronger fundamentals and less debt have performed better than counterparts with more leverage. Coming into 2020, American Airlines had over $21.4 billion in long term debt, compared to Southwest at $1.84 billion. As one can imagine, both have suffered tremendous declines in passengers, with an 85% drop at American and a 75% drop at Southwest. But American is burning cash at the rate of $30 million per day, nearly double the $16 million figure from Southwest. Southwest has over $15 billion in liquidity, enough to sustain their business for several years at the current depressed pace. Without further loans and grants from the U.S. Government, American Airlines will be lucky to survive another 18 months.
Not surprisingly, all of the above is reflected in the stock price performance of the two companies. Year-to-date, American Airlines is down -55%, while Southwest is down -28%. Anecdotally, if you’ve flown these airlines in the past couple of years, you may have experienced what I have. Mainly, that Southwest is the most efficient carrier in the nation, and along with Delta, is considered top-notch. Meanwhile, American and United are at the bottom of customer satisfaction surveys. A quick, side personal note. I’ve had good experiences with Jet Blue, but not looked at their finances.
All in all, there are numerous ways to trade and invest with a process that doesn’t involve pressing a few buttons on your smartphone and hoping you’ll sell to a greater fool. We use relative strength to pick stocks and ETFs. Others use chart patterns, and a variety of factors, such as free cash flow, EBITDA (earnings before interest, taxes, depreciation and amortization), earnings yield, debt, operating margins and return on capital.
As Wall Street Journal columnist Jason Zweig wrote in June, “However crazy the stock market may seem, it isn’t really a casino. Play most games in most casinos long enough and you’re sure to lose. The stock market, on the other hand, tends to reward those the best who hold on the longest. Speculating has some entertainment value. You might learn something (see above) useful. There’s even a remote chance you’ll make money. But always know you’re speculating. Also know that you can lose your shirt.”
Remember Zweig’s comment about holding on the longest. At age 60, Warren Buffett’s net worth was estimated at $3.8 billion. Today, at 89, that estimate is $84 billion, even after Berkshire Hathaway stock has suffered this year. In other words, he’s made most of his fortune in the last 1/3 of his life. This is what compound interest is all about. Savings and longevity. Consider this. If a 25-year-old could save $5000 per year, each year, until they were 65, and those funds compounded at 5%, the ending sum would be over $669,000. If the return was increased to 6%, the sum increased to over $871,000. Those numbers could be considerably increased in one’s 40’s and 50’s, when earnings are likely much higher than in one’s 20’s, and one could likely save more than $5000 annually. And note I’m using a number which is 50% lower than the long term stock market return in the United States since 1926, which has been closer to 10%. There’s no guarantee, though, that the return will be 10% for the next 40 years.
Long term, though, is the key, and I certainly get it—there aren’t many 25-year olds, or 30-year olds, who are thinking about 30 years from now and beyond. They want to get rich quick. The reality, is, that rarely happens. I don’t know if this new interest in the stock market is a good thing. Time will tell. But, for those young people who are looking for primers on money and investing which are not technical, I offer several recommendations for reading:
Your Money & Your Brain by Jason Zweig
The Richest Man in Babylon by George Carlson
Think & Grow Rich by Napoleon Hill
The Psychology of Money by Morgan Housel
Why Didn’t They Teach Me This In School? by Cary Siegel
You Get What You Pay For
The move to free commissions for trading stocks isn’t all that it’s cracked up to be. In all likelihood, it has increased trading, which studies have shown is typically harmful to results. Let’s face it. If you have $2500 to trade with, and it would cost $20 to make a trade, logic would tell you people will think twice about it in comparison to when there is no cost. The cost, unfortunately, is hard to measure. But, as many of the Robinhood users are finding out, there’s no free lunch on Wall Street. A recent Bloomberg article detailed the experience of several Robinhood users whose accounts were somehow looted by hackers. When they tried to contact the company, they found out that Robinhood has no phone number. It’s all email. Good luck with that. If Robinhood wants to become a real company, they’ll eventually need to talk with their customers. People want to talk with other people. Especially when their money is involved. And I don’t think I’m Out Of Touch on that subject at all. If you’re a young person just getting started with investing, stay with the tried and true, such as Fidelity and Schwab. I think it’s ironic that Robinhood is named after the heroic outlaw who robs from the rich and gives to the poor. Your account just might be the one that gets robbed.
Expense Ratios—You Probably Don’t Know, What You Don’t Know
Anyone who owns mutual funds or exchange traded funds (ETFs) in a brokerage account or 401 (k) plan incurs expenses, even if they are not paying transaction fees or commissions to buy and sell, as noted above with most firms these days. These expenses are different and separate from investment advisory fees, which are paid to firms like TABR to manage accounts and provide financial planning services. As mentioned above, there’s no free lunch, but I can tell you that these expenses have been pushed significantly downward in the past several years as ETFs have become more and more popular, and typically have lower expenses than actively managed funds. An expense ratio for a fund is calculated by dividing the total dollar value of fund assets by the total amount of fund fees—which include management fees and operating expenses charged to investors in the fund.
More and more evidence has been published in the last five to ten years that it is harder for active equity managers to add value above and beyond benchmarks, and this has intensified the move to cheaper, more passive ETFs. This evidence is strongest in the large cap stock category, but is less convincing in small caps, mid caps, international funds, and certain areas of the bond market, such as corporate high yield funds and intermediate term bond funds.
On the Fidelity platform, there are close to 10,000 funds to choose from on an NTF basis (no transaction fee, as long as the purchase is held at least 60 days). I should point out that number is exaggerated, since some companies maintain as many as 7 to 9 share classes of the same fund, so there is much duplication in the list. Nevertheless, the average actively managed mutual fund has expenses which typically range from 0.50% to 1.25% annually, while the average ETF is around 0.44%. Passive index funds and ETFs are around 0.20%.
We realized over five years ago that if we didn’t change with the times, we were going to be Out Of Touch. Though we were ranking actively managed equity funds by relative strength, it wasn’t enough. We found we could do better by simply using low cost broad-based ETFs and still use relative strength to focus on the market’s leaders, but cut expenses substantially.
We’ve been using this approach now for five years, and we continue to feel using ETFs for stock exposure and actively managed funds for bonds is the best route. Recently, our Tactical Moderate Account looked like what is shown below in the table, and is representative of the total internal expenses of our Moderate risk accounts since the beginning of 2016.
| Fund Symbol | Fund Name | Market Value | Pct. of Account | Expense Ratio | Total Expense |
| FDRXX | Fidelity Cash Reserves | $7,196 | 0.82 | 0.38% | 0.31 |
| BHYIX | Blackrock High Yield | 88,374 | 10.07 | 0.62 | 6.24 |
| QQQ | Nasdaq 100 Trust | 102,044 | 11.63 | 0.20 | 2.33 |
| SHY | iShares U.S. Treasury 1-3 | 152,329 | 17.36 | 0.15 | 2.60 |
| IAU | iShares Gold Trust | 23,722 | 2.70 | 0.25 | 0.68 |
| OEF | iShares S&P 100 ETF | 96,792 | 11.03 | 0.20 | 2.21 |
| IVW | iShares S&P 500 Growth | 100,425 | 11.44 | 0.18 | 2.06 |
| LCORX | Leuthold Core Investment | 27,889 | 3.18 | 1.27 | 4.04 |
| PIMIX | PIMCO Income Fund | 58,209 | 6.63 | 0.50 | 3.32 |
| PHIYX | PIMCO High Yield Fund | 88,195 | 10.05 | 0.55 | 5.53 |
| PSDYX | Putnam Short Duration | 76,437 | 8.71 | 0.30 | 2.61 |
| SSIRX | Sierra Tactical Income | 55,982 | 6.38 | 1.62 | 10.33 |
| Total | 877,594 | 0.4225% |
You can see that the total expenses are just over 42 basis points annually. In my estimation, if a total portfolio has overall net internal expenses which are greater than about 50 bps, there should be some hard analysis as to why. And that goes for 401 (k) accounts, other types of retirement plans (403 (b), IRA’s, etc.) and all brokerage accounts. You can see, frankly, there are some areas in our mix that need some attention which we’ll be addressing at year-end. Nearly a third of the expenses are attributed to two funds which make up only 10% of the entire portfolio—Leuthold and Sierra. That will change, and as we begin next year, our overall numbers will be lower. One side note–we also run an all-passive account (no tactical moves) using Vanguard funds, and the total expenses of that account are just under 15 basis points.
What you don’t see above is how much we cut expenses in the overall mix compared to where our portfolios were in 2015. We won’t take up more space with another table, but we did the analysis and found our Moderate mix was at nearly 96 basis points, over double what it is today. We were able to reduce expenses by over 50% simply by getting rid of the actively managed equity funds we formerly owned, which averaged 1.22%. The ETFs we started using at the beginning of 2016 average just under 0.20%. Ultimately, these reductions fall to the bottom line and improve performance for all clients (and we’re a client, just like you, with the same exact portfolio).
Another tidbit you may not be aware of. In the fixed income area, whenever possible, we try to purchase institutional share classes of funds rather than retail share classes. In some cases, such as PIMCO and Vanguard, this may involve paying a transaction fee, whereas in other cases such as Blackrock and Prudential, to name a couple, the institutional share classes are available with no transaction fee (again, as long as the position is held at least 60 days).
This certainly affects our selection of funds paired to accounts, as we can’t really treat them all the same. A $50,000 IRA account where we might put $5000 into a high yield bond fund cannot as easily absorb a $22 transaction fee in comparison to a $500,000 account where we would be purchasing $50,000 of the same fund. As a result, we are grouping accounts by dollar size and pairing them with fixed income choices which minimize as much as possible any unnecessary expenses. We have a substantial advantage over most retail customers in a number of areas—for instance, we can purchase Blackrock High Yield Institutional Share Class which has an expense of 0.62%, while most retail customers doing things on their own can only buy Blackrock High Yield Class A shares, where the annual expense if 0.94%.
Over time, and especially now and in the coming years where interest rates are the lowest ever, paying attention to the little things really adds up.
Bullish Breadth Thrusts And Our Positioning
Regardless of one’s opinion of our political scene, the handling of the Covid virus, the economy or anything else that may have your ire up like it does mine, there is one thing all the Fact Checkers on CNN and Fox News cannot dispute. The stock market is acting really strong here. Despite the massive rally from late March, several breadth indicators flashed bullish signals in the past week, one of which is shown below, courtesy of Ned Davis Research at www.ndr.com.
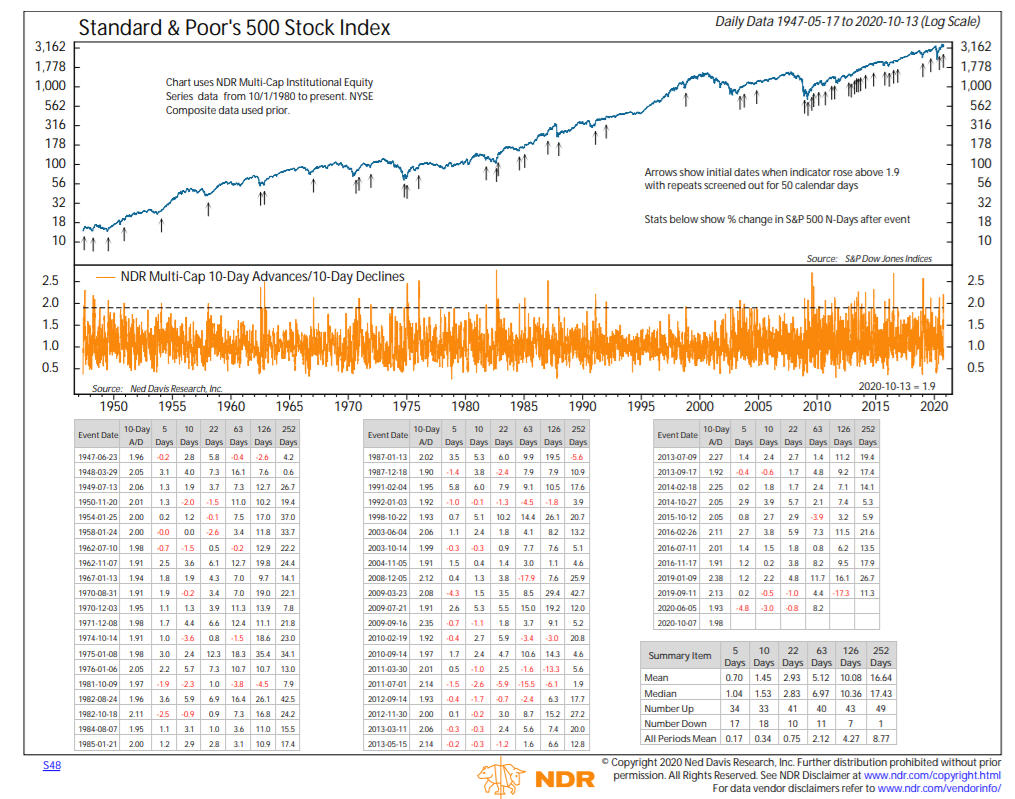
This is an indicator which measures advancing stocks versus declining stocks over a 10-day period. When the ratio of advancing stocks to declining stocks rises above 1.9, a breadth thrust is signaled. Since 1947, there have been 50 prior cases (for you math geeks, that is STATISTICALLY significant!). In 43 of those 50 cases, stocks were higher six months later by a mean of 10%, compared to all periods at 4.27%. There has been only one occasion where stocks were lower one year later, and the mean gain has been over 16%, nearly double the norm.
There are never guarantees in the markets, but if past history holds up with this signal, stocks have a high probability of being higher going out many months, perhaps in the range of another 7% to 14% from current levels. With the yield on the 10-year Treasury at 0.73%, earning 7% in stocks would be a heck of a deal. We’ll see.
In late September, it looked like stocks and high yield bonds were breaking down. But, the 10% decline off the September 2 peak created quite a bit of pessimism, and stocks have rebounded strongly. As a result, just before the recent thrusts, two of our stock models went from negative to positive, and a week ago, our tactical equity exposure was increased from 66% to 100%, or fully invested. Our high yield bond model has not confirmed yet, but it’s close to also turning bullish.
Though polls are overwhelmingly indicating that Biden will win the election, I’ve no idea. All I know is that our indicators are bullish, and our discipline demands we follow them. The narrative is that Trump is better for the stock market, and maybe he is, as right now, the election tendency I outlined last month is suggesting Trump will win unless stocks fall apart in the next 3 weeks. But, one should consider that maybe the market doesn’t care. Maybe it will go up if Biden wins. Would that surprise you? It shouldn’t, because as past history has shown us, stuff happens that we never imagined, or thought possible. Whatever happens, I’m confident we’ll be fine. And, just so you know, I voted for George Kittle. So, whichever side you’re on, don’t blame me!
Material Of A Less Serious Nature
A woman, married three times, walked into a bridalshop one day and told the sales clerk that she was looking for a wedding gown for her fourth wedding.
“Of course, madam,” replied the sales clerk, “exactly what type and color are you looking for?”
The bride to be said: “A long, frilly white dress with a veil.”
The sales clerk hesitated a bit, then said, “Please don’t take this the wrong way, but gowns of that nature are considered more appropriate for brides who are being married the first time—for those who are a bit more innocent, if you know what I mean? Perhaps ivory or sky blue would be nice?”. . .
“Well,” replied the customer, a little peeved at the clerk’s directness, “I can assure you that a white gown would be quite appropriate.
“Believe it or not, despite all my marriages, I remain as innocent as a first time bride. You see, my first husband was so excited about our wedding, he died as we were checking into our hotel.
“My second husband and I got into such a terrible fight in the limo on our way to our honeymoon that we had the wedding annulled immediately and never spoke to each other again.”
“What about your third husband?” asked the sales clerk.
“That one was a Democrat/Republican,” said the woman, “and every night for four years, he just sat on the edge of the bed and told me how good it was going to be. . .but nothing ever happened.”
Here’s hoping and praying something GOOD happens soon in regards to our world, so that LIVING has a much broader definition than the last six months has allowed. As you may know, my Dallas Stars DID make it to the Stanley Cup Finals, and my fears were founded—nobody could attend in person. Ultimately, they lost in six games, but did provide me with nearly 10 weeks and 24 playoff games of unbelievable excitement, even with no fans in the building. And now, my 49ers hardly resemble the team in the Super Bowl just last February, thanks to a plethora of injuries. In sports, luck is a big deal. And that’s true in life, too. Thanks for getting to this point. All of us at TABR appreciate your continued trust and confidence in us.
Sincerely,

Bob Kargenian, CMT
President
TABR Capital Management, LLC (“TABR”) is an SEC registered investment advisor with its principal place of business in the state of California. TABR and its representatives are in compliance with the current notice filing and registration requirements imposed upon registered investment advisors by those states in which TABR maintains clients. TABR may only transact business in those states in which it is notice filed, or qualifies for an exemption or exclusion from notice filing requirements.
This newsletter is limited to the dissemination of general information pertaining to our investment advisory/management services. Any subsequent, direct communication by TABR with a prospective client shall be conducted by a representative that is either registered or qualifies for an exemption or exclusion from registration in the state where the prospective client resides. For information pertaining to the registration status of TABR, please contact TABR or refer to the Investment Advisor Disclosure web site (www.adviserinfo.sec.gov).
The TABR Model Portfolios are allocated in a range of investments according to TABR’s proprietary investment strategies. TABR’s proprietary investment strategies are allocated amongst individual stocks, bonds, mutual funds, ETFs and other instruments with a view towards income and/or capital appreciation depending on the specific allocation employed by each Model Portfolio. TABR tracks the performance of each Model Portfolio in an actual account that is charged TABR’s investment management fees in the exact manner as would an actual client account. Therefore the performance shown is net of TABR’s investment management fees, and also reflect the deduction of transaction and custodial charges, if any.
Comparison of the TABR Model Portfolios to the Vanguard Total Stock Index Fund, the Vanguard Total International Stock Fund and the Vanguard Total Bond Index Fund is for illustrative purposes only and the volatility of the indices used for comparison may be materially different from the volatility of the TABR Model Portfolios due to varying degrees of diversification and/or other factors.
Past performance of the TABR Model Portfolios may not be indicative of future results and the performance of a specific individual client account may vary substantially from the composite results above in part because client accounts may be allocated among several portfolios. Different types of investments involve varying degrees of risk, and there can be no assurance that any specific investment will be profitable.
The TABR Dividend Strategy presented herein represents back-tested performance results. TABR did not offer the Dividend Strategy as an investment strategy for actual client accounts until September/October 2014. Back-tested performance results are provided solely for informational purposes and are not to be considered investment advice. These figures are hypothetical, prepared with the benefit of hindsight, and have inherent limitations as to their use and relevance. For example, they ignore certain factors such as trade timing, security liquidity, and the fact that economic and market conditions in the future may differ significantly from those in the past. Back-tested performance results reflect prices that are fully adjusted for dividends and other such distributions. The strategy may involve above average portfolio turnover which could negatively impact upon the net after-tax gain experienced by an individual client. Past performance is no indication or guarantee of future results and there can be no assurance the strategy will achieve results similar to those depicted herein.
Inverse ETFs
An investment in an Inverse ETF involves risk, including loss of investment. Inverse ETFs or “short funds” track an index or benchmark and seek to deliver returns that are the opposite of the returns of the index or benchmark. If an index goes up, then the inverse ETF goes down, and vice versa. Inverse ETFs are a means to profit from and hedge exposure to a downward moving market.
Inverse ETF shareholders are subject to the risks stemming from an upward market, as inverse ETFs are designed to benefit from a downward market. Most inverse ETFs reset daily and are designed to achieve their stated objectives on a daily basis. The performance over longer periods of time, including weeks or months, can differ significantly from the underlying benchmark or index. Therefore, inverse ETFs may pose a risk of loss for buy-and-hold investors with intermediate or long-term horizons and significant losses are possible even if the long-term performance of an index or benchmark shows a loss or gain. Inverse ETFs may be less tax-efficient than traditional ETFs because daily resets can cause the inverse ETF to realize significant short-term capital gains that may not be offset by a loss.
For additional information about TABR, including fees and services, send for our disclosure statement as set forth on Form ADV from us using the contact information herein. Please read the disclosure statement carefully before you invest or send money.
A list of all recommendations made by TABR within the immediately preceding one year is available upon request at no charge. The sample client experiences described herein are included for illustrative purposes and there can be no assurance that TABR will be able to achieve similar results in comparable situations. No portion of this writing is to be interpreted as a testimonial or endorsement of TABR’s investment advisory services and it is not known whether the clients referenced approve of TABR or its services.