Party Like It’s 1999? Let’s Hope Not
Back in 1982, the late Prince released a song titled 1999, that purportedly was using the phrase in reference to a nuclear apocalypse predicted to occur in the year 2000. That didn’t happen, but the stock market did mark an epic peak in March 2000, with the Nasdaq Composite plunging over -80% during the ensuing three years.
I should note that the Nasdaq had risen +85% in 1999. During that same year, you may be shocked to learn that had you owned Warren Buffet’s Berkshire Hathaway, you would have been down -20% in 1999.
This disparity brings to mind today’s market, where once again a handful of very large companies are leading market indexes higher, surprising most investors. I decided to look into the ramifications, if any.
We’ll also have some comments on the recent news affecting California homeowners and their property insurance policies, 5% yields for longer and some exciting news about the new Mustang in our family. Read on.
Market Concentration—What’s The Scoop?
According to Ned Davis Research, the five largest stocks in the S&P 500 recently accounted for nearly 25% of the index, the largest concentration on record, with data going back to 1972. In a similar vein, the top 7 stocks in the Nasdaq 100, also known as the QQQ, account for 50% of that index. It’s been said that a rising tide lifts all boats, but by looking at year-to-date numbers on the standard variety of stock indexes, most of them have been left at the dock. The figures below are through June 12.
Nasdaq 100 Index +29.40%
S&P 500 Index +13.90%
VXUS +9.43% (Vanguard Total International Stock Index)
MDY +5.86% (S&P 400 Midcap Index)
IJR +4.93% (S&P 600 Smallcap Index)
DIA +4.23% (Dow Jones Industrial Average)
RSP +3.96% (S&P 500 Equal Weight Index)
You might say 4-5% isn’t terrible, but just 12 days ago at the end of May, all four of the bottom indexes were showing losses for the year. Even today, virtually all funds and strategies related to dividend-paying stocks are down for the year, including the $51 billion Vanguard Equity Income Fund, which is down -1%. What gives? Thus far, the stocks and industry sectors which performed the worst in 2022 (think growth stocks) are suddenly once again leading the market, and the stocks and industries that did the best in 2022 (think value, dividends, energy), are doing the worst. Another way to view this is the chart below, courtesy of www.bespokepremium.com.

During the month of May, the Nasdaq Composite gained +5.8%, while the Dow Jones Industrials lost -3.5%. As shown in the chart, that was the 9th worst spread in over 50 years of data. Yet, this disparity was exceeded several times in the 1998-2000 period, as noted by the red lines. Below is another way to look at what happened during the last 6 months of 1999, in comparing the Nasdaq to the Dow. The chart is courtesy of www.stockcharts.com.
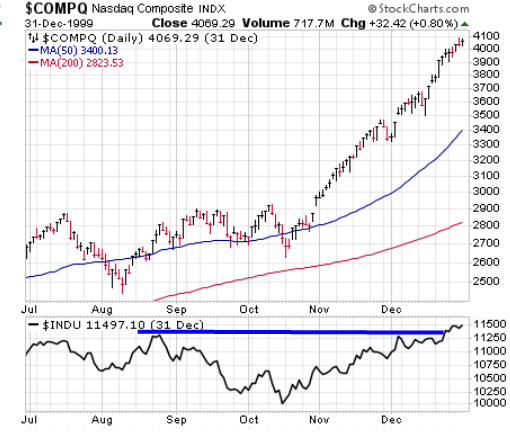
In mid-July of 1999, the Nasdaq had temporarily peaked, preceding a decline into early August. At its July peak, the Nasdaq was up 30.6% for the year. From mid-October, the index went on to gain another 42% through year-end, as one can see the trajectory of the advance, a near-vertical uninterrupted move. Yet, the Dow Industrials, shown in the bottom clip, went mostly sideways during the same period, earning less than 3% from its mid-July peak. The perspective I get from comparing these first five-plus months of 2023 to 1999 is that the disparities were substantially larger in 1999. Plus, from a fundamental standpoint, many of the companies that led the Nasdaq in 1999 didn’t have any earnings. It was the Internet bubble. Anything with dot.com after its name seemingly went up. Is today’s fascination with AI (artificial intelligence) similar? Possibly. But one notable difference is today’s leaders have real earnings, even if one can debate whether or not they deserve to be trading at high multiples, such as Nvidia at 37 times sales.
It’s possible the market will broaden out, with small and midcap stocks growing in relative strength, along with value. This has been evident in the first two weeks of June, with small caps gaining nearly 8% in 10 trading sessions. We’ll have to see if this lasts. I can’t envision the Nasdaq gaining another 40% from current levels in the next 7 months, but markets can do anything they want. I suspect there aren’t many people on Wall Street who would have thought the Nasdaq would be up 30% in five months. Most, in fact, are still expecting a recession that doesn’t seem to be anywhere in sight. With only 9 prior cases of narrow leadership to examine since 1972, Ned Davis Research found mixed results one year later, with gains in 6 of the 9 cases, ranging from 1.7% to 37.1%, but with losses of -20.2% and -24.9% in 2 of the 3 negative outcomes. Mean and median gains were substantially below average, at 4.4%, and 1.8%, respectively. Those aren’t exactly great odds to hang your hat on.
The S&P’s 200-Day Moving Average
In the early 1980s when I started in this business with the old E.F. Hutton & Company, there were many technical analysis newsletters that were being published. One was called Dick Fabian’s Telephone Switch Newsletter, and it was actually based in Huntington Beach, CA. The premise of the letter was to simply follow the trend of the market, which Fabian defined as the 200-day moving average. In simple terms, be in stocks when the index (say, the S&P 500 or the Dow) is above its 200-day moving average, and go to cash when it is below.
I suspect Fabian had other rules to reduce whipsaw trades, when the index might oscillate around the moving average. The “Telephone Switch” moniker came from the day—there was no Internet. So, subscribers would call the hotline perhaps Monday, Wednesday and Friday, and get updates and instructions on the market and what to do. Back then, technical analysis knowledge was not very widespread, so this process actually worked pretty well for many years.
However, as software and the ability to test data became easier over time, I found that this method was pretty inferior to other approaches, and never used it for trading. However, the 200-day moving average is a standard technical tool that almost everyone looks at, and other sources have detailed different ways to use it. One such method is to look at what happens to stocks when the direction of the moving average starts to shift, from down to up, or from up to down.
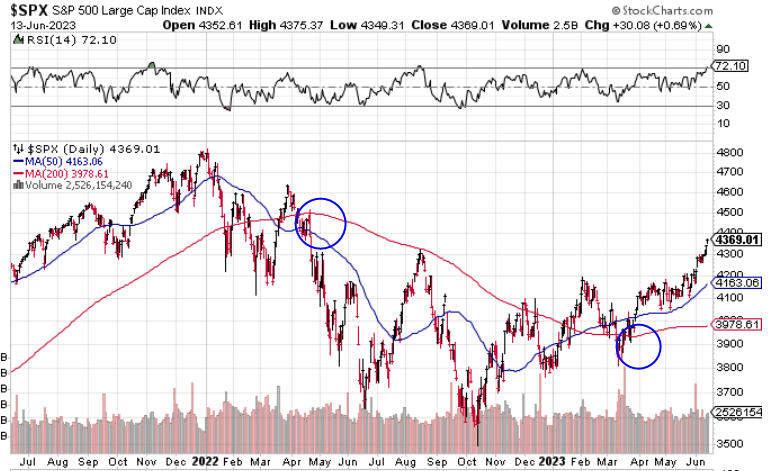
Above is a chart of the S&P 500 Index going back to July 2021 to the present. The red line is the 200-day moving average. I’ve drawn two blue circles on the chart, to show when the 200-day MA started to decline (late April 2022), and more recently, when it started to advance (April 2023). I’m not certain if I’d call this data mining, but the research team at Bespoke Investment Group found an interesting tidbit that I thought worth sharing. Since the late 1920s, there have been only 20 prior periods when the S&P 500’s 200-day MA made a 52-week low, and then rallied more than 1% off that low within the next 3 months.
The data below shows the first date in the prior periods and the S&P 500’s performance in the following one, three, six and 12 months.
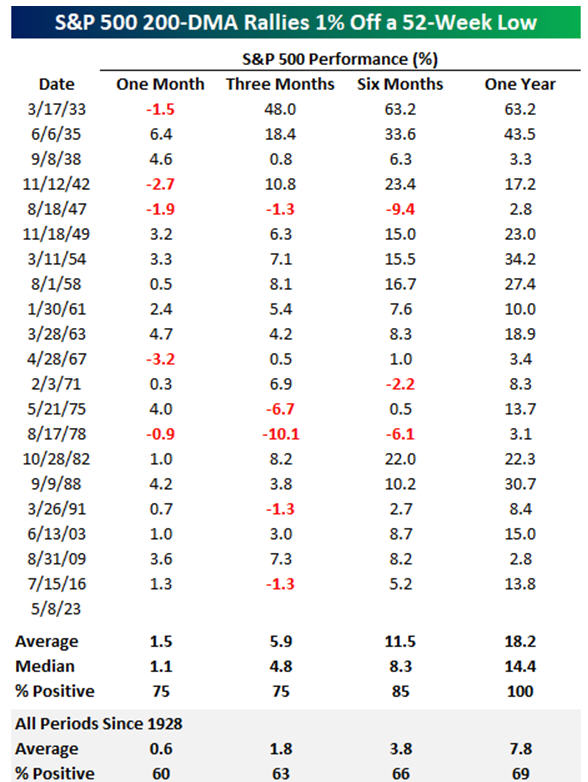
First of all, this data goes all the way back to 1933. Second, in all 20 prior cases, stocks were up one year later, with median gains of 14.4%, nearly double the average in all periods since 1928. Granted, five of the cases had gains that were fairly miniscule, from 2.8% to 3.4%. The latest “signal” if you will of this set of parameters took place a month ago, on May 8. In the first month, stocks have gained 5.57%, which was exceeded only by the 6.4% gain back in 1935.
The implications of this are that the trend of stocks has turned up, and is bullish for the intermediate term. Is this statistically significant? Nope. You need 30 data points to get to that point. Given the history of the “process,” that might take another 50 years. But, if you’re looking for a reason to be bullish, I’ve just given you one. 🙂
The Homeowner’s Insurance Dilemma
“Affordable housing” has become an oxymoron in California, but that’s not the only issue facing not only prospective buyers, but existing homeowners as well. We’ve experienced this first hand. In the summer of 2019, my wife and I decided to move, from Yorba Linda to . . . Yorba Linda. In some ways, it was a pre-emptive downsize move, knowing our daughter Caroline would be starting college in the fall of 2023 (see below). We took the opportunity to find a single story home in the process, eliminating stairs, and we also no longer felt the need for a pool. In terms of distance, our move was about 1 mile away, just north of our existing home, sitting right above Yorba Linda High School, where our son Adam had attended. As long as I can remember, our auto insurance and homeowners, as well as the personal umbrella policy, had been with AAA of Southern California, some 34 years. We also had earthquake insurance through AAA, until several years ago when they stopped offering policies, at which point we found a company named GeoVera, which specializes in earthquake coverage.
While we were in the middle of purchasing our new home in Yorba Linda, I called AAA to get an estimate for our new policy. That’s when I discovered that AAA would not insure our home, because they deemed it to be located in a fire zone. At that time, our insurance agent could not find any companies willing to write new policies in our area (I define area loosely, here, as it was merely 1 mile away from our old home, but up against a mountain on which the other side was Carbon Canyon Regional Park). As a result, we had no choice but to enroll with California Fair Plan Property Insurance, which is an entity run by the State of California to provide basic fire insurance coverage for high-risk properties when traditional insurance companies will not. AAA would not.
In the last month, you’ve perhaps read that State Farm and Allstate Insurance have announced they also will no longer be offering new policies in the state, joining AIG and Chubb, who have been reducing their exposure in the state. Why? State Farm said “because of soaring wildfire and construction costs and a ‘challenging reinsurance market.'” According to Janet Ruiz, a spokesperson with the Insurance Information Institute, “the insurance industry in the last six years has lost 20 years’ worth of underwriting profit, and that was due to the catastrophic wildfires that we’ve faced.” Bottom line is, these companies cannot make a reasonable profit with the rates they are charging, because the State of California and their legislators won’t let them. Allstate has requested a 40% increase in rates, and State Farm is asking for 28%. Can you blame them?
We may have great weather in most parts of California, but it comes at a cost. The state is known for its bureaucratic building codes, endless red tape and significant energy and labor costs. The average cost of building a new home in California excluding land is $1.35 million, according to an editorial in the Wall Street Journal. As his company was pulling back from California two years ago, the Chubb CEO said, “we cannot charge an adequate price for the risk.”
As for the California FAIR Plan (who thinks of these ridiculously incorrect names), it’s basically an insurer of last resort, with less coverage and more expensive premiums than traditional insurers. We had no choice to take it back in 2019 when we purchased, but fortunately a year later, our insurance agent in Yorba Linda was able to get us coverage with AmGuard, which is actually a division of Berkshire Hathaway. For the policy year of August 2020 to August 2021, we paid an annual premium of $3267 for dwelling coverage of $1,332,000, personal property of $666,000 and loss of use at $399,600. We had purchased the property for $1,790,000. At our renewal in August 2021, our premium was increased to $3,957, an increase of 21%. Dwelling coverage increased to $1,358,000. In August of 2022, our renewal was increased again to $4,524, another 14% bump. All in all, that has been a 38% increase in two years. During that time, according to the real estate websites Zillow and Redfin, the purported value of our home has increased to anywhere from $2.46 million to $2.55 million, a jump of 27% using the lower figure, or nearly a $700,000 increase.
Fast forward to the last month. We received a written notice from AmGuard they were nonrenewing our policy due to the property’s high wildfire risk. Hello. Our agent had given us the heads up this was happening, and indicated that unless something changed by mid-July, he could likely write a new policy with Farmers (unless they stopped selling new policies too). Meanwhile, he encouraged us to file a Certification of Mitigation Criteria Form with AmGuard. The insurance companies are assigning properties a wildfire risk score, based on their location, and if your property wildfire score is between 40-80 (ours was 56), and you are not located in a moratorium zone, completion of the form may result in possible reconsideration of a pending notice of non-renewal. In English, that means the company might renew your policy after all.
Given that it is not easy to get a new policy these days, I figured we had nothing to lose by filing the form. But it felt like you had to be a home-builder construction manager to really know the answers, or else you simply had to guess. Your home possesses a Class-A Fire Rated Roof. Your home’s exterior vents are fire-resistant. How am I supposed to know this? Doesn’t the insurance company know who built the home? Am I supposed to call Pulte Homes and find the person who can answer this stuff? Or how about this question on the form? Your property is located within a Fire Risk Reduction Community, as listed by the California Board of Forestry pursuant to Public Resources Code § 4290.1. That one, along with another similar question, was baffling. Doesn’t the insurance company already know my property address and whether it resides in this community? How the heck did they assign our property a wildfire risk score in the first place?
In any case, I did my best, answered the questions, and submitted the form. Within two days, our insurance agent emailed and said the company was rescinding their non-renewal and would be offering a renewal proposal. What we don’t know at this point is, what will be the increase? Inflation is front and center in almost everything right now—including its effects on financial markets. This section is not intended to dive into housing and all, but I do want to add some other comments about the bump in housing prices these past three years. I’m not certain how many of you feel about this, whether you are in Southern California or in other parts of the nation, all of which have slightly different housing markets. I will say this, though. I’m not any happier today than I was three years ago, because our home is supposedly worth $700,000 more. I’d be just as content if it was worth $1.78 million, less than what we paid for it. Who cares? We’re not moving anywhere. With higher home values come higher expenses, on almost everything. We can now look forward to property taxes that will be about $8000 or more higher than when we purchased the home. I honestly wouldn’t be shocked to get a renewal notice for our homeowners insurance at $6000, which would be nearly double that of four years ago.
For our children at some point, and your children as well, it’s quite challenging to find affordable housing in Los Angeles or Orange County, San Diego and the Bay Area. It’s called inflation, and it’s a problem not easily solved. I suspect many of you will be facing similar challenges with your own homeowner’s policies in coming months, so I hope this context is helpful.
5% Yields And Higher For Longer And Portfolio Allocations
As I write this on Wednesday morning, the Federal Reserve just finished their meeting and announced they were for now pausing on further increases in the Federal Funds rate, which is currently at 5% to 5.25%. This is after 10 consecutive increases which began in March 2022, from the zero level. As it stands, below is where various yields are.
Liquid Money Market 4.75%
1 Year Treasury Yield 5.20%
5 Year Treasury Yield 4.01%
10 Year Treasury Yield 3.79%
Below is a chart of the 10-year Treasury Yield, going back to 1980, also courtesy of www.stockcharts.com.

The upper left portion of the chart is obscured by the data which shows the 50-month and 200-month moving averages. The descending red line which is the 200-month moving average, is positioned almost exactly like the 40-year downtrend line that one could draw on the chart. Yields on 10-year Treasuries peaked at over 14% in 1980, and have been declining until early 2020, when they reached 0.50%. That downtrend was broken, and most technicians now feel the bond market has started a secular bull market for yields (rising yields over time). There’s a whole generation of investors who have never invested in a rising yield environment. This doesn’t mean, by the way, that yields are headed back to 14%. Nobody knows that, and given the total sum of government debt, that seems quite unlikely.
Nor is it likely that the Fed will ever take interest rates back to zero. Hopefully they’ve learned that policy is not good for markets. Even though the downtrend in 10-year yields has been broken, that doesn’t rule out a move back down in the next couple of years to the downtrend line, or the 200-month moving average, which today sits at 2.57%. That could easily happen in the most anticipated recession in history. My crystal ball isn’t any clearer than yours, but I don’t see the Fed cutting rates in 2023. I think Fed Funds rates will remain at 5% or higher into early 2024. As a result of the move in yields the past 12 months, fixed income in different areas has become the most attractive in nearly 15 years.
In that vein, let me present some context to our thinking, and what has driven a recent move in all of our tactical accounts. We’ve terminated the position in Sierra Strategic Income (SSIRX), and replaced it with the iShares iBonds December 2027 Term Corporate ETF (IBDS). This represents 6.6% of Moderate accounts, and 8.8% of Conservative accounts. We’ll go back to that, but first, look at the chart below, courtesy of our friends at Ned Davis Research, www.ndr.com.

This indicator goes back to 1951, and uses the percentage of household holdings of stocks to project future returns. According to studies conducted by writer and researcher Mark Hulbert of MarketWatch, this indicator is the single best predictor of future stock market returns (10 years out) he’s ever come across. When the indicator is in its top 20% of readings as shown on the chart, hypothetical future returns have been in the 4.25% to 4.80% range five to 10 years out. Given other stock market valuation indicators, this is the premise we’re working with. We hope its better, but market returns go in cycles, and one down year in 2022 doesn’t adjust for 12 years of 14% compound returns from the S&P 500.
Now, back to Sierra. The fund is managed by David Wright and his partner, Ken Sleeper, and is a tactical bond fund. I’ve known Wright since the mid-1980s with my involvement in the Market Technician’s Association, which today is known as the CMT Association. Sierra is a fund of funds, and has an excellent risk management approach and record. But, I’ve always been bothered by the high expense ratio of 0.94%, and also that on the Fidelity platform, it is a transaction fee fund, which means that whenever we purchase or sell it for clients, they pay a nominal fee. Why did we switch? I saw opportunity in the 2027 Term Fund, with limited risk and a fair degree of certainty that I’m comfortable with. The portfolio owns 544 different corporate bonds, all of which mature between January 1, 2027 and December 15, 2027. The duration of the fund is 3.8 years, the expense ratio of the fund is 0.10%, we can purchase and sell it for no commissions, and the yield to maturity of the portfolio is 5.26%. Yes, 55% of the portfolio is in BBB rated bonds, so there is some risk of default, but with such diversification, I’m really not worried about that. Instead, I’m looking at this like we just locked in a 5.26% return on almost 7% of Moderate portfolios for the next four years. This isn’t guaranteed, but it’s probable, in my opinion. And, relative to the chart above, this just might be a better investment than the stock market during this time.
If 4-year yields jump to 7% in the next couple of years, I’m not going to be unhappy with this. Our strategy, and these type of funds, are designed to be held until maturity. It’s likely we’ll sell the fund sometime in the first or second quarter of 2027 and evaluate what the options are at that time. Meanwhile, I’m looking at a similar strategy with a portion of our high yield bond exposure, using a 2026 Term Fund, which currently has a yield to maturity of 8.88%. With high yield bonds, there’s a much greater risk of default, so we’re weighing whether to use a passive Term Fund or an actively managed short duration fund, in the neighborhood of a 3-year duration. What gives us pause is the recession risk, as high yield bond spreads are still fairly low, so we’re doing nothing at present. We remain fully invested in high yield corporate bond funds at this time, plus the PIMCO Income Fund, and our tactical equity exposure remains at 80% of a maximum 100%, with four of our five risk models in a positive mode.
Our Daughter Is A Mustang (Cal Poly San Luis Obispo, That Is)
On Sunday, April 30, it was decision day in our household, as daughter Caroline needed to accept an invitation to attend the college of her choice no later than the next day. I asked her to go to her bedroom, and come back out wearing swag from her school of choice. We knew the colors would be green and gold, but we didn’t know which school—Colorado State or Cal Poly San Luis Obispo. It was a very difficult choice for her—both are great schools, with strong animal science programs (Colorado State also has a veterinary school, which is the second step) and great downtowns. She knows her heart, and perhaps it came down to temperature—as in 41 to 64 degrees average in December at SLO, versus 20 to 41 degrees average in Fort Collins. There is no truth to the rumor that I told her she would be on her own because she was going to be a Ram (as in Colorado State Rams). Below is a glimpse of her, and what she’s been doing these past four years at Orange Lutheran High School.


She departs Orange Lutheran with a 4.61 GPA, a STEM scholarship, many friends–some of whom are also attending SLO, and is still contemplating what to do with her musical talents which include playing the flute, oboe and the piano, as well as how to incorporate her love for running, which has been a big part of her life these past four years. Needless to say, Mom and Dad are so proud of her, and excited to see what’s next. By the way, Caroline doesn’t do anything small. She doesn’t want to just be a vet. Rather, a LARGE ANIMAL vet! Do you think Taylor Sheridan and Yellowstone will still be around in 8 years?
Material Of A Less Serious Nature
Betty went to the cemetery every day in her village to water the flowers on the grave of her deceased husband, Harry. When she was finished, she always walked backwards when leaving the grave.
One day, her friend Leila asked, “Betty, why do you always leave the cemetery walking backwards?”
Betty answered, “When Harry was alive, he always told me ‘You’ve got such a great caboose; it could bring a dead man back to life!!!’ I’m not taking any chance!!!”
Thanks for getting this far. Summer is almost officially here, and all that comes with it—more baseball, more ice cream, and more vacations hopefully for many of you (and us!). Should you need anything, reach out. We sincerely appreciate all the trust and confidence you place in all of us at TABR.
Sincerely,

Bob Kargenian, CMT
President
TABR Capital Management
TABR Capital Management, LLC (“TABR”) is an SEC registered investment advisor with its principal place of business in the state of California. TABR and its representatives are in compliance with the current notice filing and registration requirements imposed upon registered investment advisors by those states in which TABR maintains clients. TABR may only transact business in those states in which it is notice filed, or qualifies for an exemption or exclusion from notice filing requirements.
This newsletter is limited to the dissemination of general information pertaining to our investment advisory/management services. Any subsequent, direct communication by TABR with a prospective client shall be conducted by a representative that is either registered or qualifies for an exemption or exclusion from registration in the state where the prospective client resides. For information pertaining to the registration status of TABR, please contact TABR or refer to the Investment Advisor Disclosure web site (www.adviserinfo.sec.gov).
The TABR Model Portfolios are allocated in a range of investments according to TABR’s proprietary investment strategies. TABR’s proprietary investment strategies are allocated amongst individual stocks, bonds, mutual funds, ETFs and other instruments with a view towards income and/or capital appreciation depending on the specific allocation employed by each Model Portfolio. TABR tracks the performance of each Model Portfolio in an actual account that is charged TABR’s investment management fees in the exact manner as would an actual client account. Therefore the performance shown is net of TABR’s investment management fees, and also reflect the deduction of transaction and custodial charges, if any.
Comparison of the TABR Model Portfolios to the Vanguard Total Stock Index Fund, the Vanguard Total International Stock Fund, the Vanguard Total Bond Index Fund and the S&P 500 Index is for illustrative purposes only and the volatility of the indices used for comparison may be materially different from the volatility of the TABR Model Portfolios due to varying degrees of diversification and/or other factors.
Past performance of the TABR Model Portfolios may not be indicative of future results and the performance of a specific individual client account may vary substantially from the composite results above in part because client accounts may be allocated among several portfolios. Different types of investments involve varying degrees of risk, and there can be no assurance that any specific investment will be profitable
For additional information about TABR, including fees and services, send for our disclosure statement as set forth on Form ADV from us using the contact information herein. Please read the disclosure statement carefully before you invest or send money.
A list of all recommendations made by TABR within the immediately preceding one year is available upon request at no charge. The sample client experiences described herein are included for illustrative purposes and there can be no assurance that TABR will be able to achieve similar results in comparable situations. No portion of this writing is to be interpreted as a testimonial or endorsement of TABR’s investment advisory services and it is not known whether the clients referenced approve of TABR or its services.