Past Performance Is No Guarantee Of Future Results
That disclaimer is present in some form in virtually every financial document I can think of, ranging from mutual fund prospectuses to life insurance and annuity contracts and illustrations, to the voluminous disclosure documents and annual reports of private and public real estate partnerships and private equity deals.
It’s become so common, that I think we all become immune to the words. Yeah, yeah. Blah, blah, blah. I’ve been thinking, though, that given the recent 10-year performance of stocks versus bonds, this is a particularly prudent time to really remember, and take heart, in this disclaimer.
Things are different today, and we’re likely to see a very different outcome 10 years from now. We’ll explore that inside, along with a few other topics. They include how to get a 4% mortgage today, a revised tax filing deadline, higher for longer (yields?), and David slays Goliath, again.
What Does The Past Tell Us About The Future? Higher Yields For Longer?
Last month, when I was compiling the data for the review of 2022 performance, I happened to be glancing at the data for the Vanguard Total Bond Index Fund, and was quite surprised to learn that for the prior 10 years, it had earned all of 1% compounded. After the fact, of course, it’s easy to now say, “why would I own bonds?” That might especially be the case when you see the 10-year compound returns for stocks. So, we decided to dig into this area, and below, compiled the year-by-year returns of each of the funds in our TABR Passive Index portfolio, which consists entirely of Vanguard mutual funds and ETFs. It is a classic composition of the 60/40 stock to bond mix, with 20% in core bonds, and 10% each in high yield and inflation-protected bonds. The equity allocation is split 75% to domestic stocks and 25% to international stocks, with a 15% weight to Vanguard Total International Stock Index, and 12-13% weights to large cap, mid cap and small cap. There is also a 7% allocation to the Vanguard Real Estate fund. See below, with the 10-year compound returns noted in bold on the bottom row.
| Year | Total Bond BND | High Yield VWEHX | Inflation Protec VIPSX | Large Cap VV | Mid Cap VO | Small Cap VB | International VXUS | Real Estate VNQ |
| 2013 | -2.1% | 4.54% | -8.92% | 32.69% | 35.04% | 37.7% | 14.61% | 2.31% |
| 2014 | 5.82 | 4.58 | 3.83 | 13.37 | 13.75 | 7.63 | -4.74 | 30.36 |
| 2015 | 0.56 | -1.4 | -1.83 | 1.02 | -1.35 | -3.76 | -4.19 | 2.42 |
| 2016 | 2.53 | 11.19 | 4.52 | 11.78 | 11.26 | 18.44 | 4.81 | 8.6 |
| 2017 | 3.57 | 7.02 | 2.81 | 22.0 | 19.27 | 16.26 | 27.45 | 4.91 |
| 2018 | -0.11 | -2.96 | -1.49 | -4.43 | -9.22 | -9.33 | -14.43 | -6.02 |
| 2019 | 8.84 | 15.79 | 8.06 | 31.25 | 30.97 | 27.32 | 21.75 | 28.87 |
| 2020 | 7.71 | 5.28 | 10.9 | 20.98 | 18.06 | 19.16 | 10.69 | -4.68 |
| 2021 | -1.86 | 3.68 | 5.56 | 27.4 | 24.69 | 17.56 | 9.0 | 40.52 |
| 2022 | -13.11 | -9.06 | -11.95 | -19.9 | -18.72 | -17.54 | -16.09 | -26.24 |
| 10 Year Compound | 1.0% | 3.6% | 0.9% | 12.4% | 11.1% | 10.1% | 4.0% | 6.4% |
One of the best predictors of future bond returns is simply the current yield of a particular maturity, at least when it comes to Treasury bonds or notes, which for the most part, have no default risk (unless you’re really worried the U.S. Government is going to go bankrupt). Back on December 31, 2012, the yield on the 10-year Treasury Note was all of 1.75%. Nothing’s perfect, but the 10-year compound return came in at 1%, and this was primarily due to the fact that at the end of the period examined, on December 31, 2022, this yield had increased to 3.87%. At present, this yield sits at 3.69%. Remember, with bond prices, as yields rise, bond prices fall, so the fact that yields increased during the 10 years by over 200 basis points helped to account for the shortfall.
Likewise, the yield on junk bonds in December of 2012 was about 6%, using the Barclays High Yield Index as the proxy. That yield now sits around 8.5%, so high yield bonds fell short of their approximate 6% yield 10 years ago, also due to rising yields. I should add that funds have expenses that individual bonds do not, but that is not a reason to purchase individual bonds. Unless one has $millions of dollars, you can’t really diversify a bond portfolio unless you are simply purchasing treasury notes or bonds, where you mostly don’t have to worry about default risk. The vast majority of high yield bond mutual funds have expense ratios of around 50 to 60 basis points, and in our view, it’s well worth it to pay for professional management. For perspective, two of the high yield funds we currently own, Blackrock (BHYIX) and Prudential (PHYZX), have effective maturities of between 5 1/2 and 6 1/2 years, and portfolios yield to maturity of 8.60% to 9.07%. Strip out expenses, and net yields are about 8-8.50%.
It’s one thing to look at numbers in a table and try to comprehend them. I think it really helps to augment the analysis with charts. Below, see the chart of the 30-year Treasury Yield, which goes back to 1944. This is courtesy of www.decisionpoint.com.
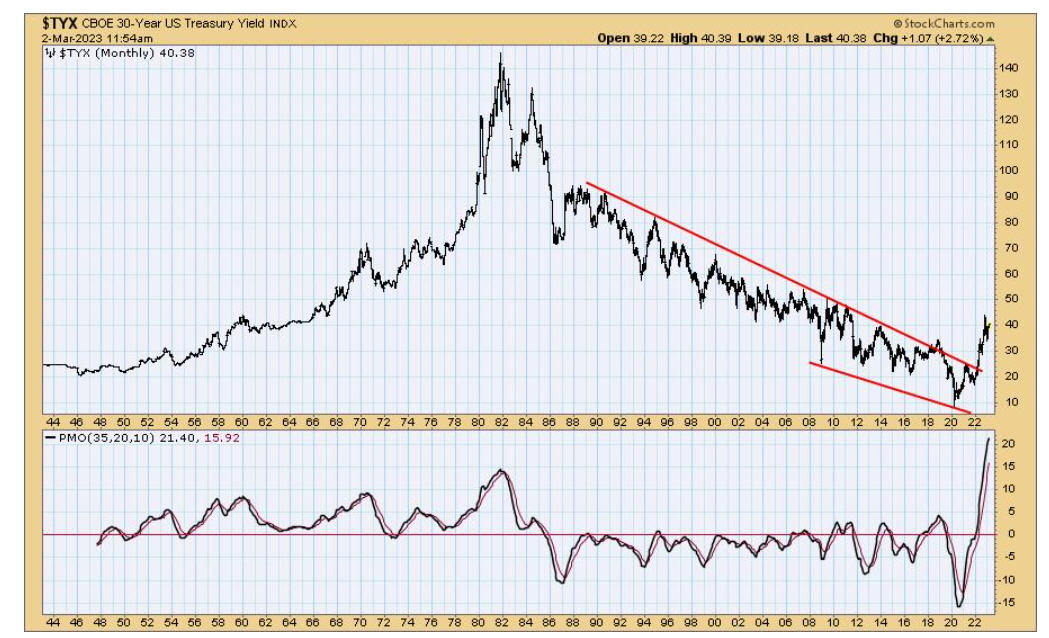
As you can see, yields have been declining since the secular peak in 1982, bottomed in 2020, and last year, broke above the near 40-year declining trend line to the upside. This is the technical evidence why many analysts see bond yields going higher, and staying higher. There is no way to know how high, or for how long, but it certainly seems likely that the prior 40 years of lower bond yields is over, and we’re in for a very different bond investing climate going forward. Below is a chart plotting the 2-year Treasury Yield, going back the last 20 years. This is courtesy of www.stockcharts.com.
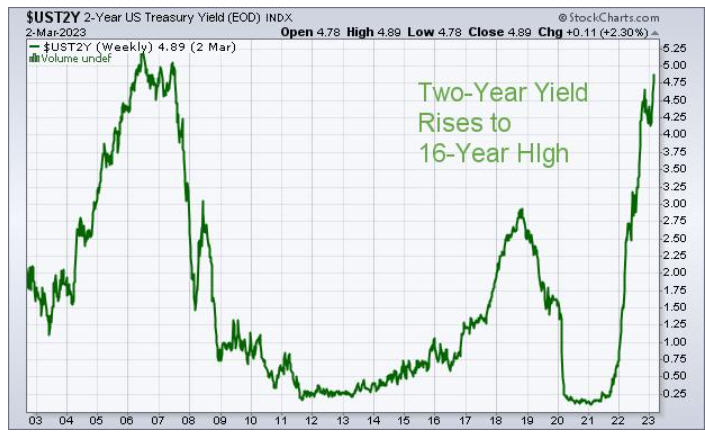
When Covid hit the world in early 2020, yields on short term Treasuries dropped to near zero, at 0.25%, but when the Fed started raising the Fed Funds rate in March of 2022, the two-year yield led the way. These higher yields are the primary reason stocks and bonds performed poorly in 2022. They are still a problem. On February 1, the yield on the 2-year had backed off to 4.10%, but then rose to 5% in the last few days, and as a result, stocks have dropped over -6% since then, as measured by the S&P 500. Higher interest rates are a continuing threat to the stock market—they make bonds more attractive, and make stocks less attractive. And, there continues to be the question of a recession. We, and many others, have written about the warnings of an inverted yield curve, and that phenomenon is more entrenched than ever, with the 10-year Treasury at 3.69%, about 90 basis points lower than where the 2-year closed on Friday, at 4.60%. Yields dropped sharply on Friday as a result of the spectacular banking failure of Silicon Valley Bank, which apparently had some contagious effects from the failure of Silvergate Capital, a San-Diego based bank who had focused on lending and deposits dedicated to crypto.
These names and banks aren’t nearly as large and familiar as Bear Stearns and Lehman Brothers, both of which collapsed in 2008. It’s hard to know what else is lurking in high finance and the connectivity to other banks and financial institutions, but one thing is clear. When the Fed is aggressively tightening, bad things tend to happen.
Bonds Just Might Be Better Than Stocks (For Awhile)
In the last few weeks, I had been working on updating some planning work for a long-time client whose wife was retiring this month. Many of you have experienced this process with us. It involves using assumptions about the future, often for 20 to 30 years, regarding inflation and investment returns. It should be noted that we’ve never found anything that can accurately predict future inflation. On the other hand, as noted above, the yield and duration on a bond portfolio can get you pretty close to the next 10 years. Let’s take two current examples. The Vanguard Total Bond Index Fund (VBMFX) has a duration of 6.57 years and a yield to maturity (YTM) of 4.26%, while the Loomis Sayles Core Plus Bond Fund (NERYX) has a duration of 7.09 and a YTM of 4.93%. As a result, I’m comfortable stating that in the next 10 years, I expect core bonds to return between 4% and 5%. If ending yields are decently higher than 5%, these returns should be lower, while if they end decently lower than 4%, these returns should be higher.
In our view, that’s the good news. The more difficult analysis is what will stocks do? I shared with our clients the data from several research firms we follow, who attempt to model stock returns going out 7 to 10 years. The results are all over the place. If you’re an optimist, go with Research Affiliates who estimate that U.S. large stocks will do 5.2%, U.S. small stocks at 8.3% and the EAFE at 10.3%. In the middle is Vanguard, who estimate U.S. stocks will earn between 5-7% and international stocks at 7.4% to 9.4%. Finally, the models from Grantham Mayo estimate that U.S. large and small stocks will earn less than 1% for the next 7 years, while John Hussman’s model predicts the S&P 500 Index will have a negative compound return for the next 12 years.
Obviously, there’s a wide disparity. None of these firms have an axe to grind. Part of our job is to separate fact from fiction (or, if you will, bullshit). As most of you know, we tend to be conservative with these assumptions, as we’d rather clients have a margin of safety in retirement and end up with more capital than expected, than to illustrate pie-in-the-sky data that doesn’t withstand scrutiny. In my on-going reading and research, I put a lot of stock (pun intended) into the work of Mark Hulbert, long-time publisher of the Hulbert Financial Digest, and columnist for MarketWatch. Mark does a lot of research on a variety of things, and always puts indicators and models through rigorous statistical analysis to see how effective they are. In late November, he updated the data on 8 different stock market valuation indicators he tracks, all of which have displayed high correlations with future 10-year stock returns. The following data and conclusions aren’t gospel, but for those investors who might be expecting (or counting on) 7% plus returns going forward, I’d recommend you grab a stiff drink and digest the tables and charts below. The data is courtesy of Mark Hulbert and Hulbert Ratings.

Hulbert regularly reports on the status of 8 different valuation models for stocks, and their current position relative to history, going back as far as 1950. When he looked back at the December 2012 data set, just over 10 years ago, he found that on average, the 8 models predicted that the S&P 500 would earn a 5.2% inflation-adjusted return for the following 10 years. This is also commonly referred to as “real” returns. Most of us, though, can more easily relate to “nominal” returns. For the math inclined, if stocks returned 8.2% (nominal) and inflation was 3%, the inflation-adjusted return would be 5.2%.
As it turned out, stocks did better than the forecast, earning 9.7% real returns. That aligns with our data above. The Consumer Price Index (CPI) averaged 2.47% from 2013 to 2022. Adding that to 9.7% gets one to 12.17%, pretty close to the Vanguard Large Cap ETF shown above. That’s all fine, but it’s the past. What about the future? See the lower horizontal line on the chart above. Now, the current 10-year stock market forecast of these 8 combined models is -1% annualized. Again, that’s a negative real return. Example—if inflation turns out to be 4%, then the nominal return from stocks would be 3% (3 minus 4 equals minus 1).
In this example, and our best guesses about the bond market, bonds would have superior inflation-adjusted returns (and, in all likelihood, much lower risk). This is one of the reasons we’ve continued to use very low real returns in our projections for financial plans, because the best times appear to be behind us, not in front of us. Mind you, stock market valuation models are no different than technical models—sometimes they don’t work very well. But, when one has a preponderance of evidence, it would be foolhardy to ignore it. On that note, below is an update on a variation of the CAPE Ratio (above) which normalizes 10 years of earnings.
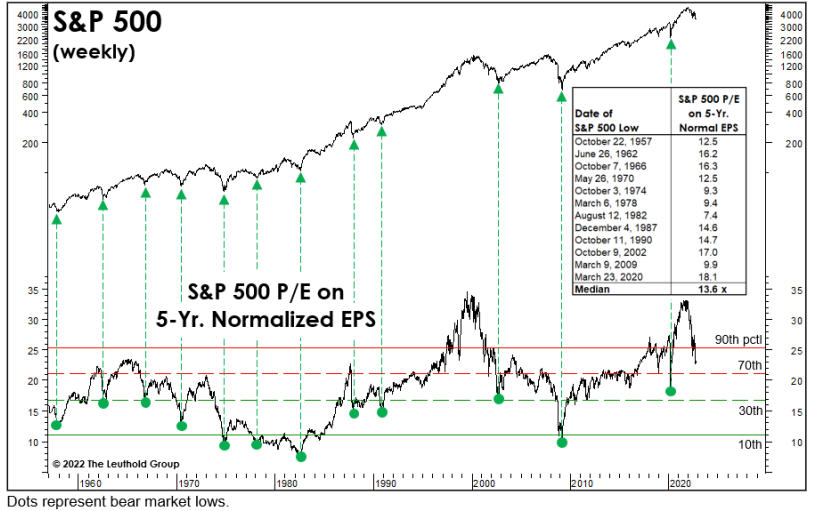
This chart, and the data, come courtesy of Doug Ramsey and the team at Leuthold Group. The table embedded in the chart shows the median 5 year P/E (price to earnings) at every bear market low since 1957. In October 22, when the S&P 500 last bottomed, that reading was at 22.7. A month ago, on February 10, the reading was 25.5. That’s nearly double the median of the last 65 years, and is 40% higher than the bottom in March 2020.
Now, one can see why bonds may be more attractive than at any time in the last 15 years, relative to stocks. Bottom line, stocks are pretty expensive historically, and the only way that gets better is to either have stocks go sideways while earnings grow, or to have stocks go down a decent amount. And, for those of you who may be real estate aficionados, it’s a similar message. In most areas of the country, commercial and residential real estate is too expensive, and cap rates are too low. In the last 20 years, stocks and real estate have become more and more connected, and higher interest rates are making both asset classes worth less than people have become accustomed to.
In our neighborhood in Yorba Linda, near Yorba Linda High School, we’ve recently been receiving letters from two homeowners who are hoping to get elected to the local HOA (Homeowner’s Association) board. Among other things, they want to do a variety of things to “help your property values grow from the $2-3 million range up to the $4-5 million range.” I’m sorry, but I can’t get behind that idea. Housing affordability is already a problem for a good portion of the population, but that’s a story for another day.
The 4% Mortgage
At the end of 2021, rates on 30-year mortgages were hovering near 3%, and had been below that level for most of the prior two years. Then, the Fed’s tightening program started in early 2022, and mortgage rates last year surged to near 7%, and remain around 6.5% today, give or take.
This curtailed the affordability for many potential home buyers, increasing monthly payments by as much as 40%. As alluded to above, home affordability has become even more acute for many younger singles and couples. Who knows when mortgage rates will be back down to the 4% level, let alone 3%, but there is a solution for some, who may be fortunate enough to be in this position. I call it The Bank Of Mom And Dad. For the purposes of this piece, that could extend to grandparents, or aunts and uncles.
Many individuals and couples can afford monthly rents in the $1500 to $2500 range, but simply don’t have the money to put down to purchase a $500,000 or $750,000 home (or more, in some cases). Not everybody has well-off parents or grandparents, but for those inclined, this is a great way to help your children or grandchildren now, while you’re here, instead of leaving a large inheritance to them when they’re 50 years old or 60 years old.
We’ve had several clients do this, and it ranges from outright gifting the money to their children (in which gift tax returns need to be filed) to where the parents are actually co-signing the loan documents, because their children couldn’t qualify on their own. There are proper ways to do this, and then there are those who don’t follow the rules. We’d highly suggest the former. Document it properly, formalize it and collaborate with your CPA so all goes smoothly. There’s even a company that specializes in this area—National Family Mortgage.
For those inclined, it’s a great way to help your kids or grandkids and still earn a competitive return on some of your nest-egg. For some of the other details to be aware of, see this article by Ashlea Ebeling of the Wall Street Journal.
The Tax Filing Deadline
For most individuals, this year’s tax filing deadline is April 18. However, because of severe weather in certain areas, the IRS has extended the deadline for residents of certain counties in California. Below I’ve simply copied the paragraphs from IRS Notice CA-2023-01.
WASHINGTON — Victims of severe winter storms, flooding, and mudslides in California beginning Jan. 8, 2023, now have until Oct. 16, 2023, to file various individual and business tax returns and make tax payments, the Internal Revenue Service announced today.
Following the disaster declaration issued by the Federal Emergency Management Agency, individuals and households affected by severe winter storms, flooding, and mudslides that reside or have a business in Alameda, Colusa, Contra Costa, El Dorado, Fresno, Glenn, Humboldt, Kings, Lake, Los Angeles, Madera, Marin, Mariposa, Mendocino, Merced, Mono, Monterey, Napa, Orange, Placer, Riverside, Sacramento, San Benito, San Bernardino, San Diego, San Francisco, San Joaquin, San Luis Obispo, San Mateo, Santa Barbara, Santa Clara, Santa Cruz, Solano, Sonoma, Stanislaus, Sutter, Tehama, Tulare, Ventura, Yolo, and Yuba counties qualify for tax relief.
The declaration permits the IRS to postpone certain tax-filing and tax-payment deadlines for taxpayers who reside or have a business in the disaster area. For instance, certain deadlines falling on or after Jan. 8, 2023, and before Oct. 16, 2023, are granted additional time to file through Oct. 16, 2023. As a result, affected individuals and businesses will have until Oct. 16 to file returns and pay any taxes that were originally due during this period. This includes 2022 individual income tax returns due on April 18, as well as various 2022 business returns normally due on March 15 and April 18. Among other things, this means that eligible taxpayers will have until Oct. 16 to make 2022 contributions to their IRAs and health savings accounts.
Similar notices were provided for residents of Alabama and Georgia. Remember—don’t put off until tomorrow what you can do today. Haha. Spoken from someone who has not yet started to organize their tax data! Be kind to your CPA.
David Slays Goliath. . .Again!
Many of you may recall I have been an equity team board member of the Titan Capital Management (Cal State Fullerton) program since its inception some 10 years ago. This is a high level class almost always consisting of seniors majoring in Finance, who are learning best practices in equity and fixed income research and company analysis, and are actually managing some $3 million of the CSUF Endowment (additional disclosure–I’m also on the investment committee at CSUF which oversees the $130 million endowment).
Every year, the students are doing great work and advancing to great jobs. Several years ago, one of TCM’s professors, Kelly Ko, spearheaded the process to have a team compete in the annual CFA Institute Research Challenge. As the CFA website states, “The CFA Research Institute Challenge gathers students, investment industry professionals, publicly traded companies and corporate sponsors together locally, regionally, and globally for an annual competition. Students research, analyze, and report on a company as if they are practicing analysts. Competing universities assemble teams of three to five business and finance students who research and prepare a company analysis. Team’s final presentations are locally evaluated by high-profile panels of heads of research, portfolio managers and chief investment officers from the world’s top firms.”
Recently, this year’s TCM team presented on Chipotle, and for the fourth consecutive year, won the local round, advancing to the sub-regional competition where they will face other universities from across the western United States. Of the 7 other schools participating in the local round, the Titans beat out Pepperdine, Loyola Marymount, USC and UCLA, among others. An interesting tidbit–to eliminate possible bias, the judges do not know what school the students are from when they present. It’s all anonymous. Below is Professor Ko, and this year’s CFA Research Challenge team with their trophy.

I’m a bit biased, but Cal State Fullerton has one of the best business schools in the nation. GO TITANS!
Portfolio Allocations
From January 17 to February 2, four of the five stock market risk models we used turned positive, and our tactical equity allocations increased from 20% to 100%. Since then, though, there’s been no follow through, and that may be telling in and of itself. Two of our models have turned negative, including one this weekend, so by Monday’s close, we’ll be down to 60% invested and holding 40% in cash.
It’s been a similar story in bonds. On February 13, we sold 40% of our high yield bond positions, and the other 60% remain close to SELL territory, but not quite yet. In addition, our model for the PIMCO Income Fund generated a SELL a couple of weeks ago, so we are currently holding a decent amount of cash in ultra-short bond funds, such as Putnam Ultra Short Duration and PIMCO Short Term Fund.
Though the stock market is oversold on a short term basis and pessimism is rising, key support levels have given way, and the probabilities that the rally off of the October and December lows is just another bear market rally that has failed are growing. Our work cannot catch and trade every short term swing, and is more focused on intermediate trends. The fact that two of our models went negative rather quickly is not a good sign, and suggests caution. As the evidence changes, we change, and right now, we are taking on a more defensive stance.
Material Of A Less Serious Nature
In the greatest days of the British Empire, a new Commanding Officer was sent to a remote African outpost to relieve the retiring Colonel. After welcoming his replacement and showing the courtesies that protocol decrees (gin and tonic, cucumber sandwiches) the retiring Colonel said, “You must meet Captain Smithers, my right-hand man. Dear God, he’s the strength of this regiment. His talent and enthusiasm is boundless.”
Smithers was immediately summoned. The new CO barely concealed his shock when he was introduced to the repulsive, toothless Captain; a hairless, scabbed and pockmarked specimen of humanity, a singularly unattractive man less than four-feet tall, exuding a foul odor, and possessing a disproportionately small head. “Smithers, old man, tell your new CO about yourself.”
“Well, sir, I graduated with honors from Sandhurst, joined the regiment and was awarded the Victoria Cross and Bar after three expeditions behind enemy lines. I’m a master parachutist and a certified pilot. I’ve participated in equestrian events and won a Silver Medal in middleweight boxing. I have researched the history of . . .”
Here the Colonel interrupted. “Yes, yes, never mind all that, Smithers! Tell the Colonel about the day you told that Witch Doctor to get f*ck$d.”
When all else fails, laugh. We may need more of that should the country go into recession. We’ll get through it, though, should that happen. Discipline and process are even more important in negative environments. Meanwhile, March Madness begins next week, college baseball is in full tilt, spring training is open in Arizona and Florida, and dare I say this, there’s hope in Anaheim for the Angels. And, my Dallas Stars are near the top of the Western Conference, and preparing for what I hope is a long Stanley Cup run. All of us at TABR appreciate your continued trust and confidence in us.
Sincerely,

Bob Kargenian, CMT
President
TABR Capital Management
TABR Capital Management, LLC (“TABR”) is an SEC registered investment advisor with its principal place of business in the state of California. TABR and its representatives are in compliance with the current notice filing and registration requirements imposed upon registered investment advisors by those states in which TABR maintains clients. TABR may only transact business in those states in which it is notice filed, or qualifies for an exemption or exclusion from notice filing requirements.
This newsletter is limited to the dissemination of general information pertaining to our investment advisory/management services. Any subsequent, direct communication by TABR with a prospective client shall be conducted by a representative that is either registered or qualifies for an exemption or exclusion from registration in the state where the prospective client resides. For information pertaining to the registration status of TABR, please contact TABR or refer to the Investment Advisor Disclosure web site (www.adviserinfo.sec.gov).
The TABR Model Portfolios are allocated in a range of investments according to TABR’s proprietary investment strategies. TABR’s proprietary investment strategies are allocated amongst individual stocks, bonds, mutual funds, ETFs and other instruments with a view towards income and/or capital appreciation depending on the specific allocation employed by each Model Portfolio. TABR tracks the performance of each Model Portfolio in an actual account that is charged TABR’s investment management fees in the exact manner as would an actual client account. Therefore the performance shown is net of TABR’s investment management fees, and also reflect the deduction of transaction and custodial charges, if any.
Comparison of the TABR Model Portfolios to the Vanguard Total Stock Index Fund, the Vanguard Total International Stock Fund, the Vanguard Total Bond Index Fund and the S&P 500 Index is for illustrative purposes only and the volatility of the indices used for comparison may be materially different from the volatility of the TABR Model Portfolios due to varying degrees of diversification and/or other factors.
Past performance of the TABR Model Portfolios may not be indicative of future results and the performance of a specific individual client account may vary substantially from the composite results above in part because client accounts may be allocated among several portfolios. Different types of investments involve varying degrees of risk, and there can be no assurance that any specific investment will be profitable
For additional information about TABR, including fees and services, send for our disclosure statement as set forth on Form ADV from us using the contact information herein. Please read the disclosure statement carefully before you invest or send money.
A list of all recommendations made by TABR within the immediately preceding one year is available upon request at no charge. The sample client experiences described herein are included for illustrative purposes and there can be no assurance that TABR will be able to achieve similar results in comparable situations. No portion of this writing is to be interpreted as a testimonial or endorsement of TABR’s investment advisory services and it is not known whether the clients referenced approve of TABR or its services.