Patience, Waiting On The Trinity, And Duration
The saying goes “April showers bring May flowers.” It supposedly is a reminder that in the case of heavy rains in April (not in Southern California!), it can bring about pleasant things, in this case, beautiful flowers. That would be a blessing to stock and bond investors, who may be feeling like they just went through a hurricane during the month, coupled with being shocked with electrical currents.
The NASDAQ, home of some of the biggest growth stocks on the planet, fell more than -13% for the month, its worst showing since October 2008. The index is down over -21% for the year, its worst start to a year in history. The S&P 500 Index, with its concentration of the top 10 companies accounting for 30% of the index, is down nearly -13%. What’s next from here?
I want to make sure we don’t hype the Bear case here, but rather focus on the evidence, and probabilities. As noted in prior updates, our technical risk models have been in Max Protect mode since late January. Nothing has changed. Sentiment is gloomy, as you’d expect it to be, but that can remain that way for many months, just as optimism remains present in a bull market environment for months and years.
The price lows from late February are being tested right now, and we don’t expect them to hold. Anything can happen, but with an unfriendly Fed and stock market valuations coming off historical highs, that’s a terrible combination coupled with 8% inflation. I’m reminding myself that everything seems to be happening faster in markets these days. But that doesn’t mean the pain for investors will be over in a few short months.
As a result, patience is required. Let the process play out. It may be a very painful experience for a lot of investors and fully invested strategies. There’s a chance that Bachman Turner Overdrive’s 1974 hit single, “You Ain’t Seen Nothin” Yet,” describes what is in our future. We’ll see. See below for more details, including one of the market breadth indicators we’re watching, and some talk on bond duration. There’s a lot to write about, and some will have to be pushed into next month, just because of length. Not everyone enjoys three-hour baseball games like I do. 🙂
The Trinity
There are three indicators we are watching to indicate the stock market has reached an intermediate oversold condition that would suggest it is washed out, and worthy of putting long term capital to work. Of course, if one is fully invested and doesn’t have any cash, that’s a problem, but that’s another story to touch on later. We featured two of these three indicators a couple of months ago, and are showcasing the third one below. Hence, the Trinity.
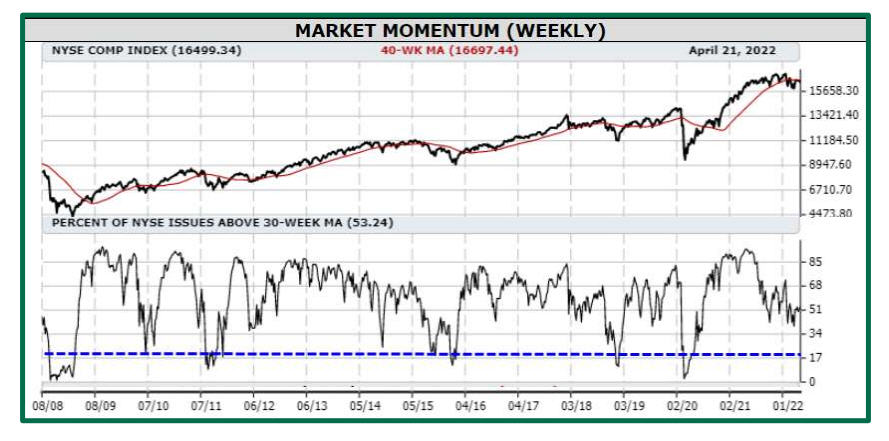
This is a chart that measures market momentum, on a weekly basis, and is courtesy of our friends at the Lowry Research Corporation, at www.lowryondemand.com. The lower clip measures the percentage of stocks on the NYSE which are trading above their 30-week moving average, equivalent to 150 trading days roughly. This version of the chart goes back to 2008.
You can see that every important stock market bottom has taken place with this indicator moving below the 20 threshold. This took place in 2008, 2011, 2015, 2018 and 2020. That’s only five times in the last 15 years. I believe we’re on our way to # 6. It’s just going to take patience, and by definition, even lower prices. How much lower? That’s really hard to know. The indicator was at 53% on April 21, and is now about 35%, with prices having dropped about -5% since that date.
It’s also not an automatic BUY signal at the 20 level. During the 2008 decline, the indicator went below 2.5%, and during the 2020 Pandemic, it was under 5%. It’s more about being ready to BUY, and having the confidence and discipline to pull the trigger. Unless you’re dealing with a 2008 scenario where stocks ended up declining over -50% from their peak, one can pretty much see that 2 years out, you’re going to be profitable. I should note that these “Trinity” indicators are not part of our formal 5 stock market risk models.
However, we’re looking to use them to tweak our allocations in Moderate and Aggressive accounts. Those are currently at 55% stocks maximum for Moderate accounts, and 75% for Aggressive accounts. They had been at 50% and 70%, respectively, along with our Conservative accounts at 35% prior to the 2020 Pandemic. We used the weakness in March of 2020 and the Value Line MAP indicator (see below) to increase those by 5%. We’re now looking to bump Moderate from 55% to 60%, and Aggressive from 75% to 80%, while leaving Conservative at its current 40% maximum. Adding exposure into weakness, especially severe weakness like we are envisioning, is not easy, but that’s where having a process in place is so important.
The other two components of the Trinity are the Value Line Median Appreciation Potential indicator, and simply paying attention to the weekly RSI indicator on the S&P 500 chart. The VLMAP as we call it, currently sits at 55%, up from 35% in early January. During that period, the S&P 500 has lost -11.6%. This indicator needs to get to at least the 90 level to suggest bargains are beginning to show up in stocks. That would probably imply at least another -10% down from current levels, placing the S&P 500 around the 3700 level.
As in the Market Momentum indicator above, though, there’s nothing magical about the 90 level. In March of 2020, the indicator rose all the way to 145%, and the S&P 500’s drawdown was -33%. We’ll just have to see. Given the tightening of financial liquidity by the Fed, which is increasing the probability of a recession, a larger decline than -20% from the peak would be more in line with recession tendencies historically. I should note that the NASDAQ Composite is already down -21% from its peak, and should continue to suffer greater losses than the S&P 500, given its concentration in growth stock issues.
Probably the least reliable of the three indicators is the weekly RSI of the S&P 500, just in the sense that it can be quite early during severe declines (to an extent, though, that is true of all three). At present, the weekly RSI is at 35, and needs to go below at least the 30 level. Obviously, the lower the better, but one never knows the lowest reading until after the fact.
A final point on market leadership. In this case, it is leadership to the downside. The NASDAQ, Russell 2000 and S&P Smallcap 600 have already taken out their February 24 price lows. The S&P 400 (Midcaps) and 500 (large caps) are sitting just above theirs, while the Dow Jones Industrial Average is some 2% above its low. Though anything is possible, and short term sentiment is definitely bearish (meaning there is a lot of pessimism), we think it’s just a matter of time before the latter three indexes follow the leaders to the downside.
Midterm Election Cycle And Seasonality
The month of April just concluded what is normally considered the end of the “best six-month period of the year,” which is typically defined as November through April. In data going back to 1950, this has been quite true. But it’s certainly not true all the time. We used to use this approach with one of our models and finally concluded it had nothing to do at all with how the market was actually behaving, and scrapped it.
If the last six months are the best six-months, with the NASDAQ losing -20.4% and the S&P 500 down -11.6%, you might be wondering what’s in store for the next six months, which are considered the “worst” six months.
This also happens to be a Midterm Election year. Historically, Midterm years are the weakest of the four in the Presidential Election Cycle. As noted, though, cycles are not perfect. Below, courtesy of Ned Davis Research at www.ndr.com, is the 4-year cycle projection for the S&P 500 Index for 2022.
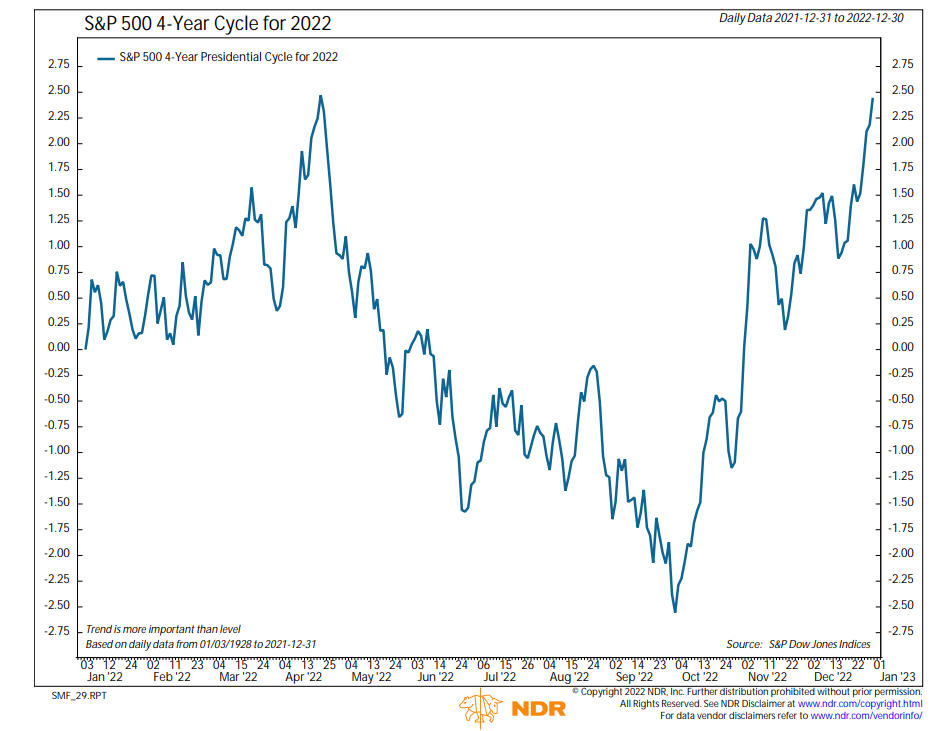
The projection wasn’t very accurate for the first four months of the year. It projected a rally/peak into April, but all we’ve had is a decline. The projection is now for weakness through October, much in line with the seasonality. It’s often instructive with indicators to compare what is expected to what actually happens. In this case, stocks were weak during a normally strong seasonal period. Does that portend they’ll be even weaker during their unfavorable period? We’ll soon find out.
Three Steps And A Stumble Adds To The Negative Environment
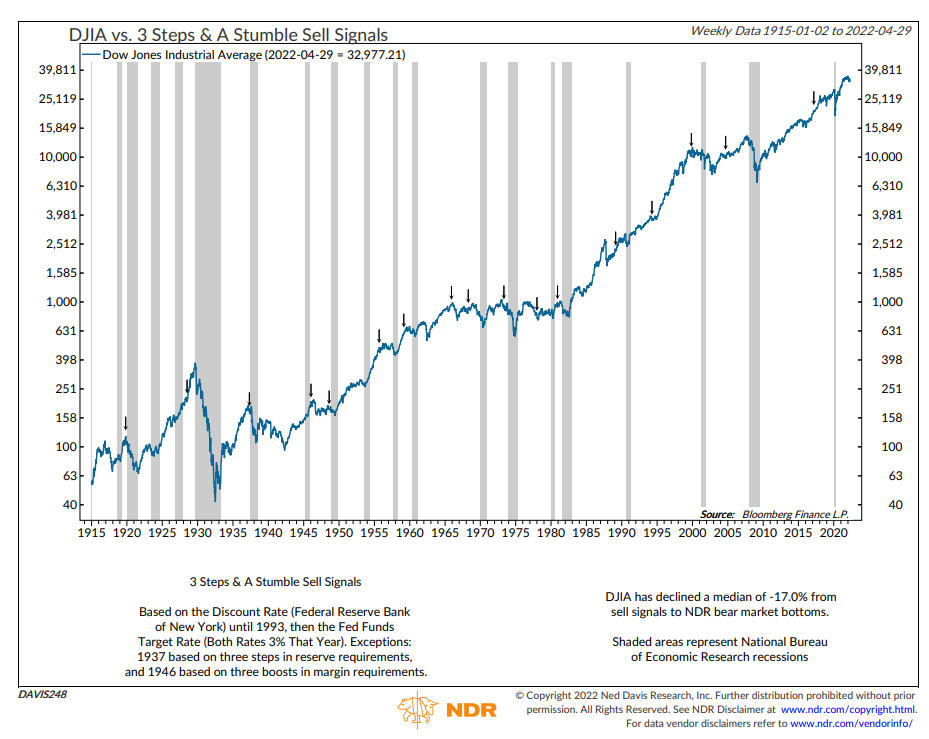
Market technician Edson Gould, who practiced from the 1940s to the 1970s, created a warning system that postulated when the Fed raises interest rates three times, the stock market would be in for trouble. Hence, the name Three Steps And A Stumble. This hasn’t happened yet, but the rule will almost certainly be in effect after the June 15 Fed meeting. The Fed meets this week and is expected to increase the Fed Funds rate by at least 50 basis points, followed by another increase of unknown amount in June. That would mark the third increase.
According to comments from Fed officials, they may raise interest rates this year as many as six times. Below is a chart of the Dow Jones Industrials Average back to 1915 showing the signals, marked by a down arrow.
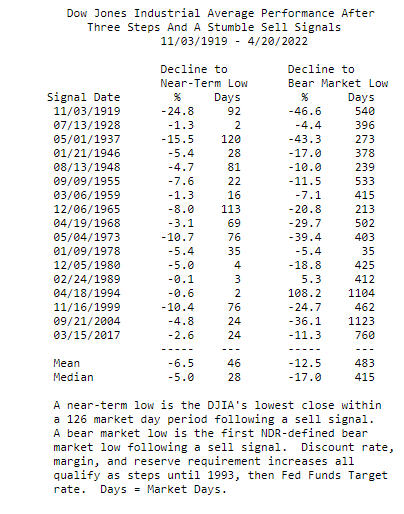
Below is the data in table form. There have been 17 cases since 1919 that the rule has triggered, and in 15 of those cases, the Dow declined a median of an additional -17% to the final bear market low. The interesting aspect will be what do stocks do between now and mid-June? Almost no economists are forecasting a recession, partly because almost all of the indicators they follow don’t look ahead, they look behind. By the time there is an official recession as defined by economists, the stock market has already declined enough to price most of it in.
By the way stocks are acting, they are telling us that trouble is ahead. How much, and how long is unknown. Amazon, one of the bull market leaders, fell -14% on Friday after a disappointing report. Netflix fell -35% in one day two weeks ago, after falling -21% several weeks back. That doesn’t happen in bull markets. The psychology has changed. Inflation is a serious problem, and as I suggested/warned in our December 2021 update, it’s really important to Listen To The Fed.
Bond Durations
I’m not certain if the rise in bond yields of varying maturities since last summer is the quickest in history, but it has to rank up there. Rates on 30-year mortgages during the 4th quarter of 2021 were at 3% or just below that level, and are now knocking on 5%. Below is a table showing the increase in yields for 4 different maturities, from June 30 of last year.
| Bond Index | 6/30/2021 | 4/29/2022 |
30 Year Treasury Yield | 2.06% | 2.94% |
| 10 Year Treasury Yield | 1.44% | 2.88% |
| 2 Year Treasury Yield | 0.26% | 2.70% |
| 1 Year Treasury Yield | 0.09% | 2.10% |
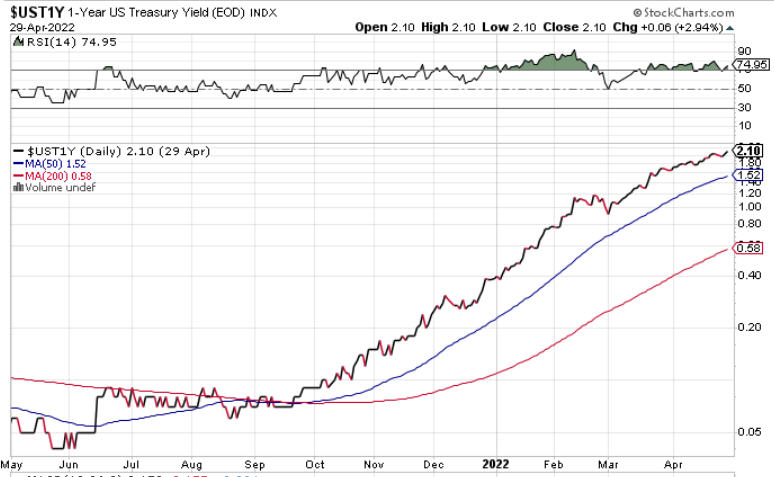
The 10-year Treasury Note has doubled in yield, while 1-year Treasury Bills have gone up by a factor of 23. As a reminder, with bonds, there are usually three factors to consider given the inverse nature of bond prices and bond yields, where bond yields go up when bond prices go down. There is credit risk (the possibility of default by the issuer), interest rate risk (yields go up or down) and duration risk. Duration is similar to the maturity of a bond, but not quite the same. It is defined as the measure of the sensitivity of the price of a bond to a change in interest rates. The longer the duration, the greater the price change, or risk, and the shorter the duration, the less the price change. Below is a chart of the 1-year Treasury Bill, courtesy of www.stockcharts.com.
With even short term bond yields going up by a factor of 10 (the 2-year note from 0.26% to 2.70%), I thought it would be instructive to see what has happened to bond funds of varying duration during this period. Unless you were investing in the 1980s, it’s doubtful you’ve experienced this, as core intermediate term bond funds are currently down nearly -10% for the year in just four months. Below is a table I created showing the duration and dividend-adjusted total returns of 8 different bond funds and ETFs.
| Bond Fund/ETF | Duration | 6/30/2021 | 4/29/2022 | Total Return |
| TLT Ishares 20 Yr Bond | 18.91 | 142.5 | 119.45 | -16.17% |
| VBMFX Vanguard Total Bond | 6.86 | 11.11 | 10.04 | -9.63% |
| AGG Ishares Core U.S. Aggregate | 6.78 | 113.7 | 102.87 | -9.52% |
| ISTB Ishares Core 1-5 Yr Bond | 2.79 | 50.61 | 47.94 | -5.27% |
| BSV Vanguard Short Term Bond | 2.71 | 81.17 | 77.03 | -5.10% |
| SHY Ishares 1-3 Yr Treasury | 1.89 | 85.94 | 82.9 | -3.53% |
| FSHBX Fidelity Short Term Bond | 1.74 | 8.645 | 8.32 | -3.75% |
| ICSH Ishares Ultra Short Term Bond | 0.4 | 50.353 | 50.09 | -0.52% |
With rates rising, as one could expect, the funds with the longest duration have suffered the greatest price declines. The data I use is dividend-adjusted to account for the payments that are reinvested each month. Even short term bond funds with durations of just under two years have suffered losses of -3.50% to -3.75%. That’s minimal, though, compared to the losses on intermediate funds, which are more stock-like at almost -10%. That’s the bad news, but the good news for bond investors and savers is that yields now are much higher than 10 months ago, and monthly payouts are being reinvested at higher rates. For instance, the SEC yield on SHY is now at 2.09% and on ISTB is 2.84%. If yields were to flatten out here during the next 8 months, these funds could recoup 1.5% to 2% in returns. Or not. Rates could continue higher, causing further losses, but I think the pace from here is not likely to match the last 10 months, with the exception of what the Fed is doing.
As everyone knows, the Fed is behind the curve. Even after this week’s meeting, the Fed Funds rate is likely to only be at 0.75%. That would at least get them to near the 3-month Treasury Yield, which sits at 0.85%. Slowly, these yields will begin to filter into money market funds and CDs, but there will be a lag effect. Other than prime money market funds which typically require a minimum investment of $1 million, core funds at Fidelity (and likely other large brokerage firms) continue to yield just 0.01% at present. This is because the expenses to run such funds are usually around 0.35% annually. Firms have been waiving hundreds of $millions of fees the past two years after the Fed cut rates to zero, simply to avoid having a negative yield. Since most money market funds have maturities of around 60 days, once the Fed raises rates to 0.75%, it will likely be around the first half of July before one should see money market yields approach the 0.40% level. That’s for liquid cash.
Many of you have online savings accounts with firms such as Ally or Capital One that we’ve recommended as alternatives to traditional bank savings accounts, which are rarely competitive. Those firms are currently paying 0.50% and 0.60%, respectively and will likely raise their rates in about two months as well. Both are way behind the bond market with their CD rates, with Ally offering 1.25% for an 18 month CD and Capital One paying 1.20% for one year. This is in contrast to 1-year Treasury Yields, which as noted are at 2.10%. Should the Fed follow through on projected increases in the Fed Funds rate, it’s possible that rate could be at 2% or higher by November. What happens to yields on the Treasury curve between now and then is anybody’s guess, though, with many inflation reports in-between.
Though this period has been painful for buy and hold bond investors, we’re hopeful that it’s setting up a tremendous opportunity in high yield bonds for our tactical risk model. The average high yield bond fund is down about -8% for the year, but yields are still only in the 5% plus range. Should stocks continue to work lower, it’s likely that junk bond yields will work their way higher.
Material Of A Less Serious Nature
Giuseppe excitedly tells his mother he’s fallen in love and that he is going to get married. He says, “Just for fun, Mama, I’m going to bring over three girls, and you try to guess which one I’m going to marry.”
The mother agrees.
The next day, he brings three beautiful women home, sits them down on the couch, and they chat for a while.
He then says, “Okay, Mama, guess which one I am going to marry?”
Mama says immediately, “The one on the right.”
“That is amazing, Mama. You are right. How did you know?”
Mama replies: “I don’t like her.”
As noted above, there’s not been much to like in stock and bond markets the first four months, but maybe the month of May will see better times. On the bright side, pro baseball is in full swing and my Giants and Angels are jockeying for first place, while my Dallas Stars sneaked into the NHL Playoffs. Maybe they’ll have another unexpected run to the Finals like 2 years ago, but this time, with fans in the building. I hope so. That would be a nice diversion. Your trust and confidence in all of us at TABR is greatly appreciated.
Sincerely,

Bob Kargenian, CMT
President
TABR Capital Management, LLC (“TABR”) is an SEC registered investment advisor with its principal place of business in the state of California. TABR and its representatives are in compliance with the current notice filing and registration requirements imposed upon registered investment advisors by those states in which TABR maintains clients. TABR may only transact business in those states in which it is notice filed, or qualifies for an exemption or exclusion from notice filing requirements.
This newsletter is limited to the dissemination of general information pertaining to our investment advisory/management services. Any subsequent, direct communication by TABR with a prospective client shall be conducted by a representative that is either registered or qualifies for an exemption or exclusion from registration in the state where the prospective client resides. For information pertaining to the registration status of TABR, please contact TABR or refer to the Investment Advisor Disclosure web site (www.adviserinfo.sec.gov).
The TABR Model Portfolios are allocated in a range of investments according to TABR’s proprietary investment strategies. TABR’s proprietary investment strategies are allocated amongst individual stocks, bonds, mutual funds, ETFs and other instruments with a view towards income and/or capital appreciation depending on the specific allocation employed by each Model Portfolio. TABR tracks the performance of each Model Portfolio in an actual account that is charged TABR’s investment management fees in the exact manner as would an actual client account. Therefore the performance shown is net of TABR’s investment management fees, and also reflect the deduction of transaction and custodial charges, if any.
Comparison of the TABR Model Portfolios to the Vanguard Total Stock Index Fund, the Vanguard Total International Stock Fund, the Vanguard Total Bond Index Fund and the S&P 500 Index is for illustrative purposes only and the volatility of the indices used for comparison may be materially different from the volatility of the TABR Model Portfolios due to varying degrees of diversification and/or other factors.
Past performance of the TABR Model Portfolios may not be indicative of future results and the performance of a specific individual client account may vary substantially from the composite results above in part because client accounts may be allocated among several portfolios. Different types of investments involve varying degrees of risk, and there can be no assurance that any specific investment will be profitable
For additional information about TABR, including fees and services, send for our disclosure statement as set forth on Form ADV from us using the contact information herein. Please read the disclosure statement carefully before you invest or send money.
A list of all recommendations made by TABR within the immediately preceding one year is available upon request at no charge. The sample client experiences described herein are included for illustrative purposes and there can be no assurance that TABR will be able to achieve similar results in comparable situations. No portion of this writing is to be interpreted as a testimonial or endorsement of TABR’s investment advisory services and it is not known whether the clients referenced approve of TABR or its services.