Protect Thy Flock, An Ode To Mom
Last Thursday evening, January 14, my mother, Hermina Kargenian, passed away at the age of 91. Since we are involved in your lives, and many of you have experienced the loss of a parent and shared with us, I thought it appropriate to do the same.
It is the nature of a Mom to protect one’s brood, whether young or old, and in a way, I think Steve Medland and I view a part of our role in this way, in serving you, our clients. Given the sharp losses the stock market has experienced in recent weeks, I thought it appropriate to “overcommunicate” a bit, something I’m sure my Mom would have advised, had she been here, and had her faculties. So, here’s to Mom.
Our Working Assumption
As we’ve been warning, stocks worldwide appear to be in a bear market. When more than 70% of stocks are trading below their 200-day moving averages, it is hard to conclude otherwise. Simply put, more stocks are going down, than up.
From a portfolio management perspective, it is not a time to make money. It is a time to protect capital. It is impossible to know the duration of the decline, nor its depth. It could be 6 months, it could be one year, it could be 3 years. Prices could fall 20%, 30%, or even as much as 50%. They’ve done the latter twice in the past 15 years, and at some point, it will happen again. This is all part of investing.
In 2000, the peak was created by the Internet bubble. In 2008, it was the housing/mortgage crisis. Right now, the headlines are China and the dramatic plunge in the price of oil, along with the unprecedented intervention in monetary policy by the Fed for the past 8 years.
In my view, preferring technical analysis, the reasons are irrelevant. Cycles are normal. Stocks get expensive, and then they get cheap. Rinse, repeat. There is a change in psychology, and this is what drives prices up and down (price/earnings ratios expanding, then contracting).
What is Probable
When a bull market is complete, and we’re assuming this one is, the question becomes, how much will the ensuing bear market take back? For a clue, look at the chart below, courtesy of www.stockcharts.com. Bear markets tend to retrace anywhere from 38% to 100% of the prior advance. The chart below shows retracements based on the advance that began in October 2011. Others will argue the advance began in March 2009, when the S&P 500 made a low at 676. It peaked in May of last year at 2130.
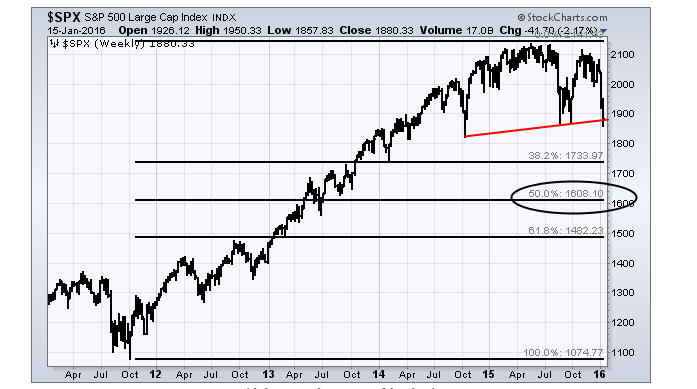
As you can see above, a 50% retracement of the advance from 2011 would result in a decline to 1608. Likewise, a 38% retracement of the entire move from 2009 would target 1578. These targets suggest a 25% decline for the S&P 500 from its peak. At present, this index has only declined about 13% on a closing basis, suggesting it is only half way to its target. In contrast, the Russell 2000, a measure of small companies, already has declined 23% from its June 2015 peak.
The worst stock market declines in U.S. history have coincided with economic recessions. Many analysts are suggesting right now that there is little evidence of recession, even saying no recession has ever been caused by crashing oil prices. We’ll leave the forecasting of recessions to others. Back in 2007, many also said housing prices would never decline. I’m very wary of any proclamations that something has never happened before, and therefore, it won’t happen. That’s a bunch of crap.
All we know is the majority of our risk models are negative, and until that changes, whether it be 3 months or a year or whatever, we will be holding very little in the way of stock market and junk bond exposure. When our models improve, we will be getting very bullish. Given the leverage and debt in the financial system, and the over-valuation of the stock market (see below), IF we go into recession, I would then think that the risks of a decline on the order of 35% or more would significantly increase.
Meanwhile, very sharp rallies will take place along the way, such as the one that appears to have started Wednesday of this week. They may last several weeks, gaining back several percent. It is all part of the process. But, it is not likely that the worst is behind us. The chart below will tell you why.
The Average Stock Is Still Expensive
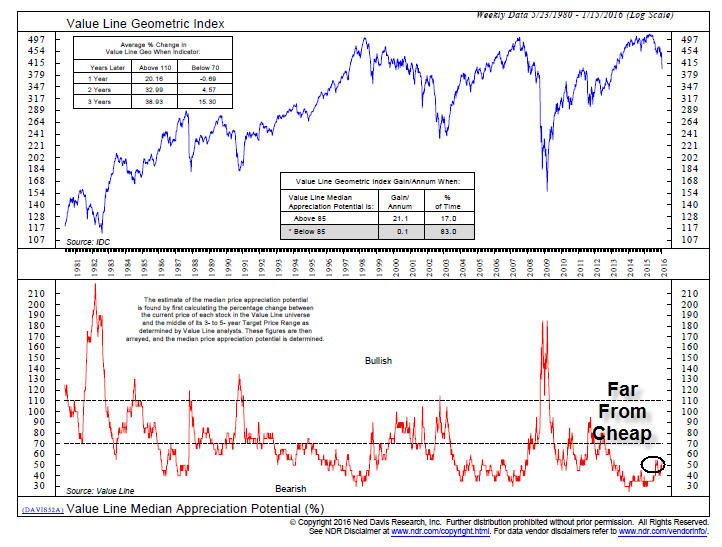
We’ve featured the chart below in prior writings. It is courtesy of Ned Davis Research, and shows the Median Appreciation Potential (bottom clip) of the Value Line stock universe, made up of some 1700 companies. The measurement looks out 3 to 5 years. The reading is currently at 55%. As you can see, important market bottoms of the past have taken place when the indicator rises to at least the 100-110% zone, double what it is today. It hit 180% in March of 2009. My guess is that when the S&P 500 gets down to the 1600 zone, this indicator may indeed be around the 100% level. We’ll have to see. That would not be an automatic BUY, but at least would be an indication that stocks were finally being priced to deliver solid returns.
401 (k) Accounts And Passive Strategies
We’re aware that many of you have retirement plans at work and money invested elsewhere where the investment strategies are different than TABR’s primary approach. Retirement plans and the majority of the financial industry almost always recommend being fully-invested at all times.
Many may be wondering what to do. Our advice is simple—if your current allocation fits your long term goals and comfort level, then you should stick with it and do nothing. That is what a passive, fully-invested strategy does—absolutely nothing. That is its strength, and also it weakness. No method, including the tactical work that TABR favors, is perfect.
The only other question you may want to ask yourself is this—can you withstand losing 30% to 50% of your equity allocation, and not panic and sell out near the bottom? At some point, stocks are going to decline much more than they already have, maybe as much as four times more. So, if you can’t imagine coping with that, let alone what it might do to your retirement goals, then I would suggest you either have the wrong allocation, the wrong strategy in place, or both, and you need to make changes.
There is not enough time now to devote to some administrative announcements we are planning on 401 (k) accounts and minimum account sizes, so I’ll defer on that until next time.
Why I’m Optimistic
Right now, only two of our 10 stock market risk models are bullish. As a result, we have about 25% tactical equity exposure, plus real estate which is about 5%. This means we’re holding the equivalent of about 70% in cash. We’re heavy in short term bond funds and almost completely out of high yield bonds, which have declined nearly 6% since our mid-November SELL.
All in all, moderate risk accounts have only about 17% of TOTAL assets in stocks, and conservative accounts only about 12%. These numbers will likely be reduced in coming weeks, as we expect our real estate model to turn negative in a week or so, and likely one of the two remaining stock models.
As we’ve conveyed in the message on our website, one of the main objectives in serving our clients is to help them achieve their financial goals with Less Risk (a smoother ride).
I’m optimistic about now, and the future, because our models are doing what they are supposed to do—protect our flock. Though the stock market (and bond market) can do anything, even shoot straight up from here and make new highs and make us and others look like fools, I doubt seriously that’s going to happen. If it did, we might miss opportunity, but we wouldn’t lose money. But, in the months ahead, there is going to be another time when it will be appropriate to Grow our flock, and I’m equally confident about our work in that regard, that we will have significant exposure when risk is lower. The markets, and it’s various signals, will tell us when that is.
Thanks, Mom, for all you’ve done, and the life you’ve given me and my brother. God Bless.
Sincerely,

Bob Kargenian, CMT
President
TABR Capital Management, LLC (“TABR”) is an SEC registered investment advisor with its principal place of business in the state of California. TABR and its representatives are in compliance with the current notice filing and registration requirements imposed upon registered investment advisors by those states in which TABR maintains clients. TABR may only transact business in those states in which it is notice filed, or qualifies for an exemption or exclusion from notice filing requirements.
This newsletter is limited to the dissemination of general information pertaining to our investment advisory/management services. Any subsequent, direct communication by TABR with a prospective client shall be conducted by a representative that is either registered or qualifies for an exemption or exclusion from registration in the state where the prospective client resides. For information pertaining to the registration status of TABR, please contact TABR or refer to the Investment Advisor Disclosure web site (www.adviserinfo.sec.gov).
The TABR Model Portfolios are allocated in a range of investments according to TABR’s proprietary investment strategies. TABR’s proprietary investment strategies are allocated amongst individual stocks, bonds, mutual funds, ETFs and other instruments with a view towards income and/or capital appreciation depending on the specific allocation employed by each Model Portfolio. TABR tracks the performance of each Model Portfolio in an actual account that is charged TABR’s investment management fees in the exact manner as would an actual client account. Therefore the performance shown is net of TABR’s investment management fees, and also reflect the deduction of transaction and custodial charges, if any.
Comparison of the TABR Model Portfolios to the Vanguard Total Stock Index Fund, the Vanguard Total International Stock Fund and the Vanguard Total Bond Index Fund is for illustrative purposes only and the volatility of the indices used for comparison may be materially different from the volatility of the TABR Model Portfolios due to varying degrees of diversification and/or other factors.
Past performance of the TABR Model Portfolios may not be indicative of future results and the performance of a specific individual client account may vary substantially from the composite results above in part because client accounts may be allocated among several portfolios. Different types of investments involve varying degrees of risk, and there can be no assurance that any specific investment will be profitable.
The TABR Dividend Strategy presented herein represents back-tested performance results. TABR did not offer the Dividend Strategy as an investment strategy for actual client accounts until September/October 2014. Back-tested performance results are provided solely for informational purposes and are not to be considered investment advice. These figures are hypothetical, prepared with the benefit of hindsight, and have inherent limitations as to their use and relevance. For example, they ignore certain factors such as trade timing, security liquidity, and the fact that economic and market conditions in the future may differ significantly from those in the past. Back-tested performance results reflect prices that are fully adjusted for dividends and other such distributions. The strategy may involve above average portfolio turnover which could negatively impact upon the net after-tax gain experienced by an individual client. Past performance is no indication or guarantee of future results and there can be no assurance the strategy will achieve results similar to those depicted herein.
For additional information about TABR, including fees and services, send for our disclosure statement as set forth on Form ADV from us using the contact information herein. Please read the disclosure statement carefully before you invest or send money.
A list of all recommendations made by TABR within the immediately preceding one year is available upon request at no charge. The sample client experiences described herein are included for illustrative purposes and there can be no assurance that TABR will be able to achieve similar results in comparable situations. No portion of this writing is to be interpreted as a testimonial or endorsement of TABR’s investment advisory services and it is not known whether the clients referenced approve of TABR or its services.